Mapping Methodology of Public Urban Green Spaces Using GIS: An Example of Nagpur City, India


1
United Nations University Institute for the Advanced Study of Sustainability, 5–53–70 Jingumae, Shibuya, Tokyo 150-8925, Japan
2
Water Researches and Technologies Center of Borj-Cedria (CERTE)-Laboratory of Natural Water Treatment (LabTEN), University of Carthage, Soliman 8020, Tunisia
3
Independent Researcher, Tokyo 100 0000, Japan
*
Author to whom correspondence should be addressed.
Sustainability 2019, 11(7), 2166; https://0-doi-org.brum.beds.ac.uk/10.3390/su11072166
Submission received: 27 February 2019
/
Revised: 25 March 2019
/
Accepted: 3 April 2019
/
Published: 11 April 2019
(This article belongs to the Special Issue Urban Green Spaces, Urban Forestry, Health and Wellbeing, Planning and Governance)
Abstract
:Faced with a lack of fine grain data availability, in rapidly emerging urban centers of developing nations, the study explored a mapping methodology to create thematic map of public urban green space (UGS). Using GIS, a thematic map of Nagpur city, India was prepared. The objective was to prepare spatial data that are relevant for planners and policy makers, with detailed UGS typologies and to update the status of overall availability and distribution of hierarchical recreational green spaces in the city. The spatial and non-spatial data with added attributes gathered through fieldwork resulted in a holistic dataset, with high accuracy of thematic map (0.93 kappa coefficient). The recorded status of different typologies as well as the distribution of recreational UGS shows disparity in the distribution of UGS. The eastern part of the city grossly lacks UGS provisions, which is compensated by the western part with larger availability of natural green spaces. The mapping methodology is novel and effective for recording qualitative status, analyzing their spatial distribution and prioritizing the provisions of UGS. Future research integrating these spatial data with more qualitative research can provide a holistic view on benefits of UGS provisions and thus facilitate effective UGS governance aiming towards better green infrastructure and hence broader urban sustainability.
Highlights:
- The overall accuracy of the thematic map is 95% and the kappa statistic is 0.93.
- The thematic map presents a realistic picture of available recreational UGS prevalent in the city.
- The hierarchical distribution of different typologies highlights the lack of provision with regard to sub-city and district green spaces.
- The spatial distribution of green spaces is uneven.
1. Introduction
Asian cities witness special dynamics of urban transition with uneven demographic densities, changing landscape patterns, traffic and congestion and other environmental challenges [1]. India in particular is a forerunner with the largest urban system, with a rising urban population of up to 300 million by 2050 [2]. By 2025, India is expected to have 68 emerging urban centers with an over 1 million population size [3], and this will absorb much of the arable lands present around the emerging cities and consequently affect their urban environment [4]. The rapid urbanization in developing countries is characterized by patterns and process of land use change [5], which poses a big challenge towards balanced and sustainable growth planning and expansion of urban centers. Catering to the immediate pressing needs of basic infrastructure priorities such as housing, water and sanitation, and energy supply, urban green space (UGS) creation and governance takes a secondary priority. Even though UGS are recognized as important elements to sustain and generate ecosystem services for urban areas and over all wellbeing [6], they are undervalued and are under tremendous pressure of destruction and degradation in almost all major cities of India [7].
Undoubtedly, UGS have a significant positive influence on wellbeing [8]. The extensive literature on UGS already showcases the diverse and broad range of ecological and social benefits of UGS and their role in achieving urban sustainability [9,10]. Despite the identified benefits, in developing countries, UGSs are under stress due to over use and are threatened in rapidly urbanizing situations, with increased vulnerability in face of global environmental change [11]. In emerging cities of India, regardless of various regulation and conservation bylaws, the planning, monitoring and management of UGS poses a big challenge [7].
In an urban transition scenario, land use change combined with a lack of UGS stewardship results in small, fragmented and degraded UGS [12]. One of the biggest challenges in this situation is the lack of capacity to plan and implement change [4], due to unavailability of data or records of the current situation of UGS [13]. This lack of complete dataset coupled with rapid administrative boundary expansion and unauthorized land conversion in the urban transition process makes the monitoring and management of UGS a more complex process. The local authorities fail to understand the associated tradeoff of land allocation and its implications on the overall urban environment of a city. The local authorities refer to the cadastral maps for planning, monitoring and management of UGS, however, these maps fail to represent the detailed landscape character, the diverse set of functions performed by UGS, their distribution and other associated attributes. This lack of base data in understanding the complex and dynamic landscapes prevalent in cities becomes one of the major hindrances in the decision-making process. Thus, the need of more detailed maps (spatial data) with spatial heterogeneity of the quantity and quality of services provisioned to guide more integrated understanding of UGS arises [14,15].
The spatial dataset augmented with detailed landscape layers facilitates the effective communication and evaluation of service supply or the demand side of UGS [16], for which geographic information system (GIS) is very effective and widely accepted as an “automated systems for the capture, storage, retrieval, analysis, and display of spatial data” [17] (p. 13). GIS allows overlaying different information in an integrated manner that is perceptive and communicable to different stakeholders [18]. Hence, GIS effectively integrates, represents and communicates data to guide the planning process of UGS. These remotely-sensed data are widely used for Land Use Land Cover Change (LUCC) studies. The coarse spatial scale (30 m resolution) identifies green spaces consistently across larger geographical units generated during classification process of imagery, in the form of arbitrary polygons with distinctive land cover, however the data may not be meaningful to planners in terms of units recognizable on the ground [19]. The classification of remotely-sensed data is based on the reflectance of ground cover, which is converted into polygons with distinct land cover, however the unit size and the classes of green spaces considered are broad and lack functional classification and ownership details (e.g., private or public green spaces), which are necessary for managed landscapes. Thus, the need to generate spatial data that consider other attributes of human dominated landscapes in addition to quantitative green space cover arises to allow more sophisticated approaches for analyzing green spaces for urban planning purposes [20]. Hence, the maps generated by analyzing the remote-sensing data, referred as thematic maps [21], which combine “spatial and non-spatial data” were explored as an important tool for dataset preparation in this study.
“Thematic maps are made for specific purpose and portrays information using some system of classification for the landscape” [22] (p. 181). The maps provide spatial data for management of landscape using GIS and allow stacking different layers of information to provide a comprehensive dataset for the geographical unit to plan and make decisions. The mapped data with a diverse set of information allows evaluation of the distribution of different types of UGS within the city, to equitably judge and make decisions between different competing land use demands. While such datasets are widely used and fairly established in developed countries, in developing countries they are still scarce [23]. For example, Greenspace Scotland prepared a spatial dataset at the national scale by mapping 23 different types of green and open spaces using GIS technology as per Greenspace Scotland (2010) as cited in [24]. Singapore has implemented green strategies to enhance their green infrastructure city level [25]. Europe is building a comprehensive dataset of UGS using GIS to map UGS and identify green areas for protection and conservation [26]. In Finland, the city of Helsinki used GIS to develop UGS map with added qualitative data on experience of these green spaces [27]. However, such dataset building is still at a nascent stage in India and other developing countries [13].
Few studies showcase the increasing use of GIS in planning, such as in Vietnam, a dataset of urban trees and green space of two cities was prepared by mapping in GIS [28]. Some more authors have used it to map urban green infrastructure and understating land cover change [20,29]. In India, as well mapping of protected green spaces (national parks and forest), urbanization and changing land use land cover trends, green space quality and quantity study at the neighborhood scale are evident in recent publications [11,21,30], however spatial data with finer details are mostly unavailable. Though this is vital for planning and decision making, at present spatial and digitized data for UGS is not available for most Indian cities, thus adversely affecting the planning process. A recent study by Anguluri and Narayanan also highlighted the need for green space mapping to support land allocations during master plan preparation for emerging urban centers [31]. Thus, to protect, manage and effectively plan the threatened and stressed UGS in an integrated manner, it is important to record what is prevalent in the city. With this context, the study endeavors to develop a mapping methodology to create a thematic map of public UGS for the Nagpur city as a case. The key objectives are: (1) prepare thematic map of public UGS with detailed classes which are relevant for planners and policy makers; (2) prepare an integrated dataset with added information and status of different typologies of green spaces; (3) update about the hierarchical distribution of recreational green spaces. In doing so, the study develops a detailed workflow which can be followed by non-GIS experts.
2. Materials and Methods
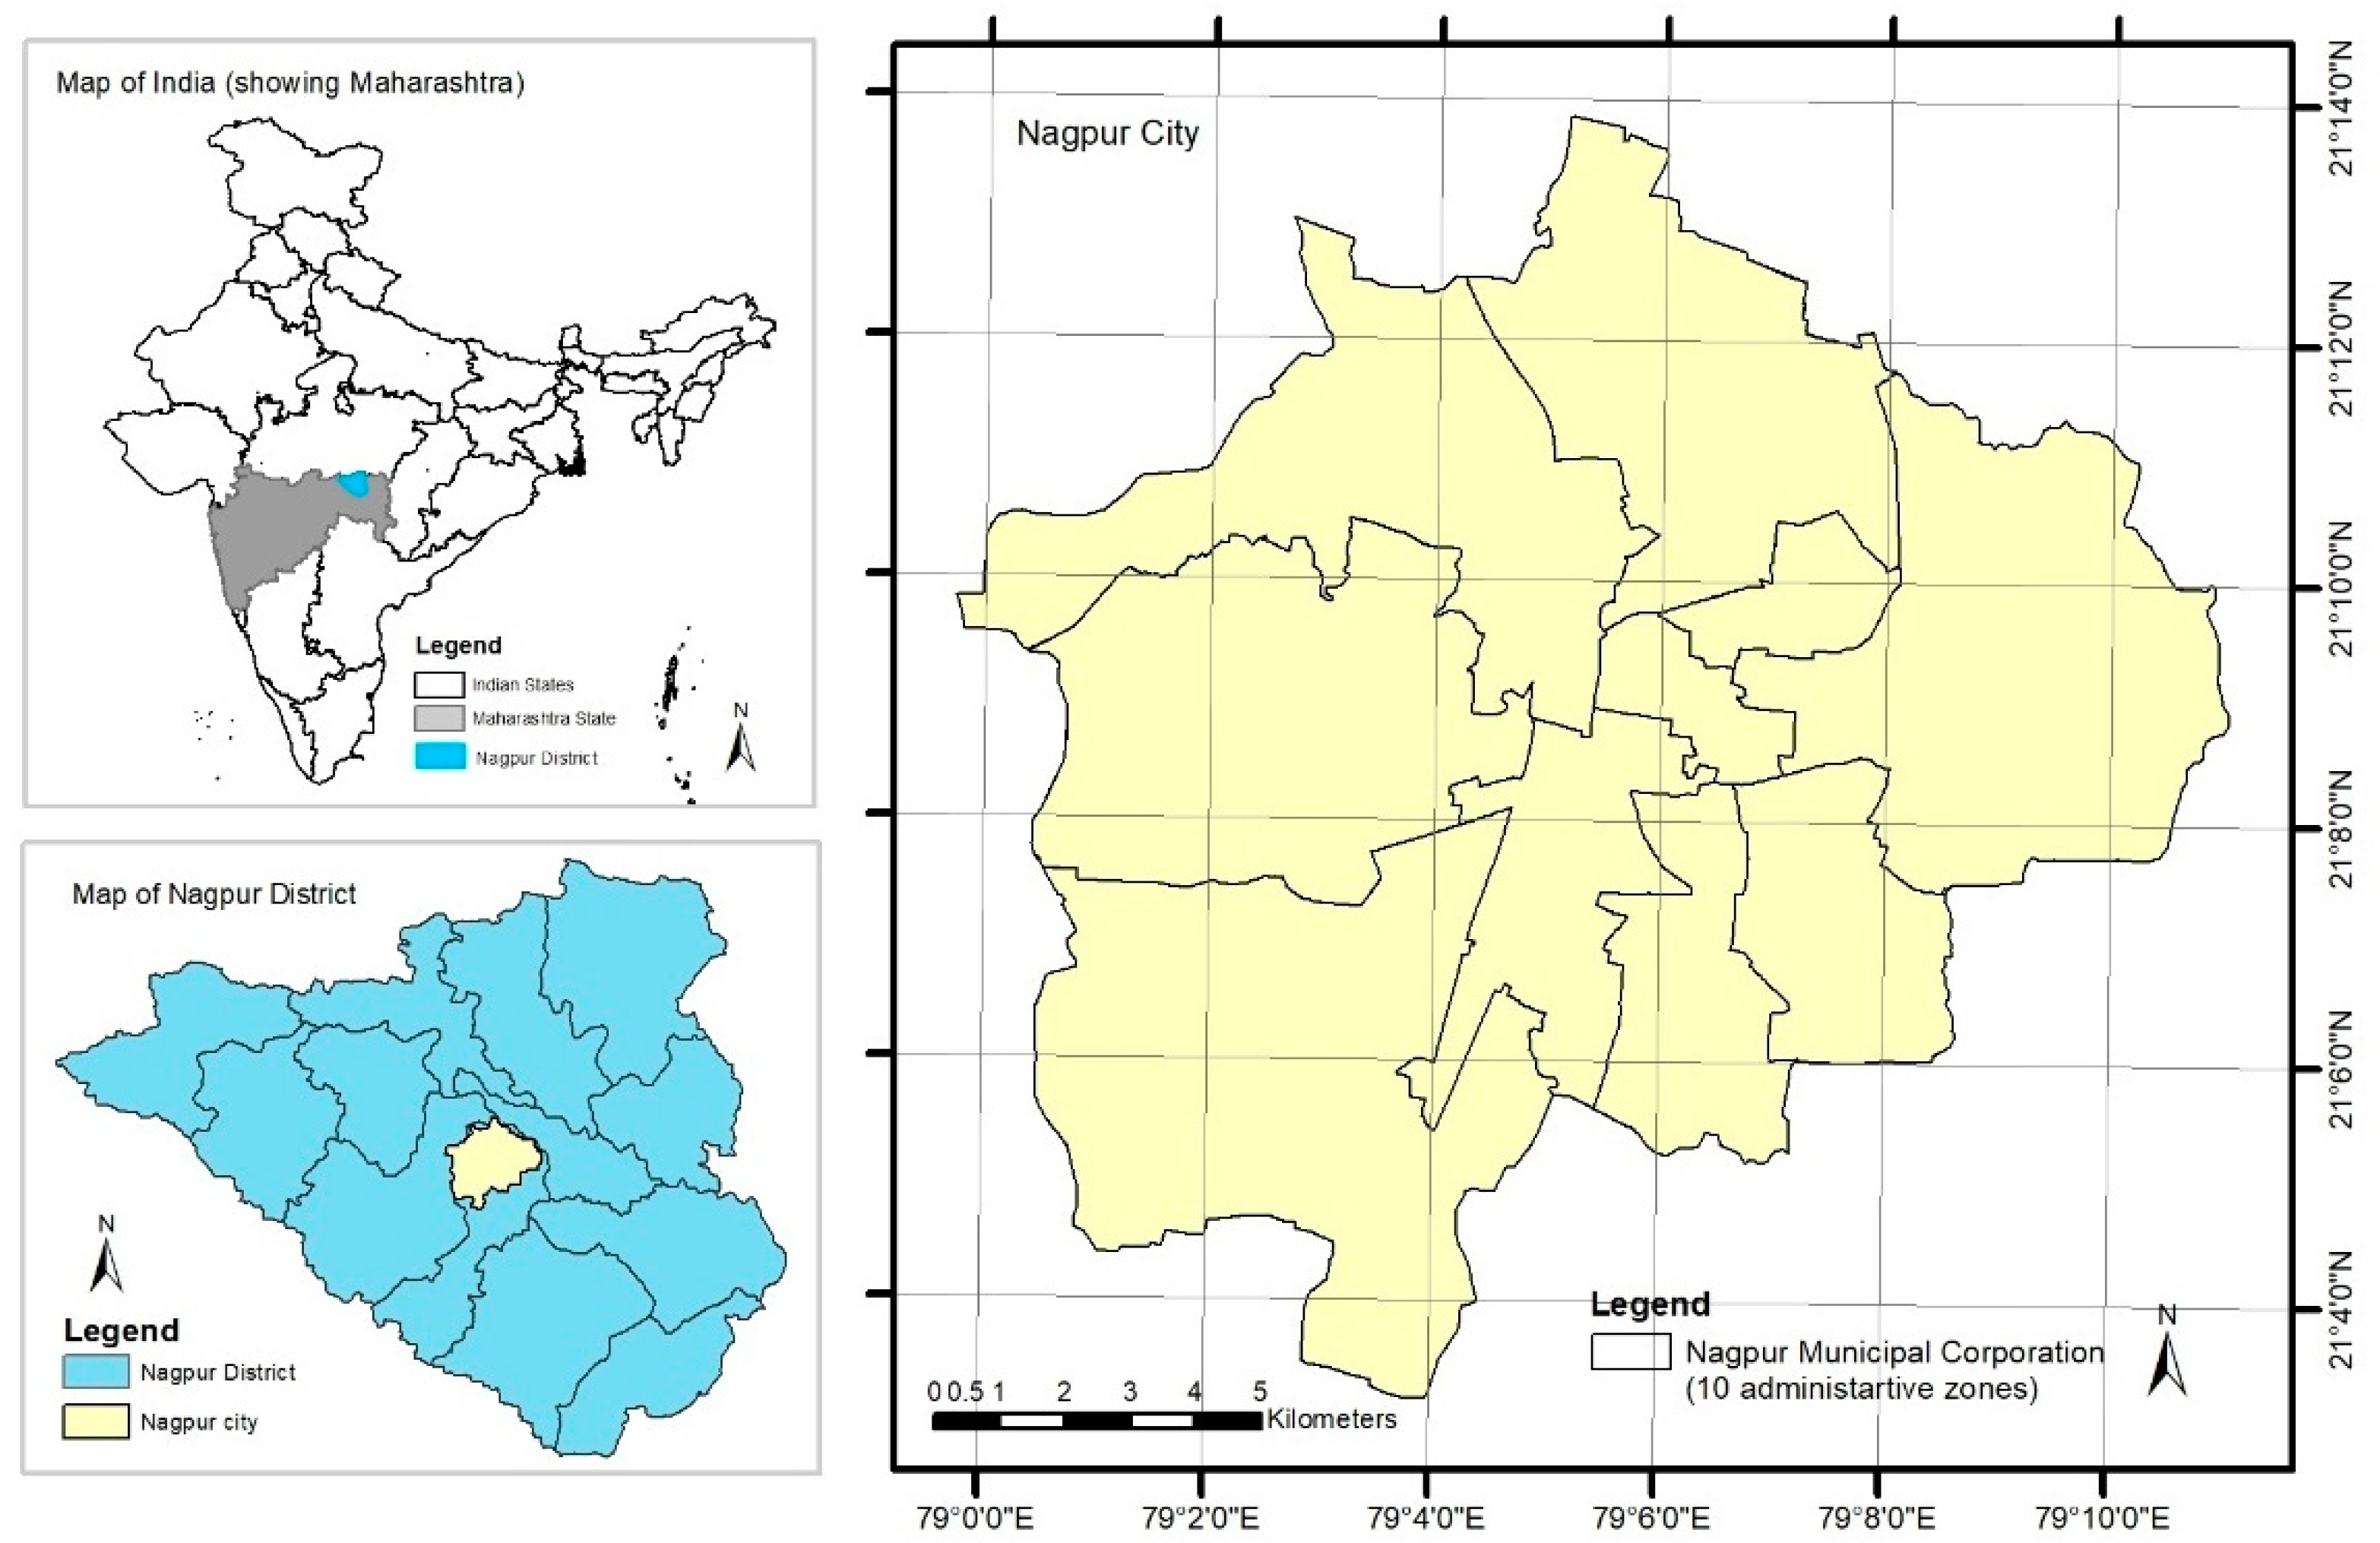
2.1. Study Area
Nagpur city was taken as the study area (Figure 1), which is also a representative example of a typical mid-level emerging urban center in India. The city ranks as the 13th biggest urban agglomeration in country and third biggest city in the state of Maharashtra. Spatially, it covers an area of 217.65 sq.km with population 2.4 million (as of the 2011 census). The city has a tropical savannah climate (Aw in Köppen climate classification), typically hot, dry and tropical weather with an average annual rainfall of 1161.54 mm, where summer temperature escalates to 48 °C and the winter temperature dips to 10 to 12 °C. Due to the recent socio-economic changes, population growth and urbanization of the city is witnessing spatial expansion in administrative boundaries, thus the natural landscape once forming the edge of the city are now within the city limits [32,33]. In this rapid urban transition scenario faced by Nagpur, the natural and managed public UGS such as lakes, drainage basins of Nag and Pili River, urban forests, institutional green spaces, parks, playgrounds and gardens are under tremendous pressure of destruction and degradation [34]. Owing to urban sprawl with subsequent land use changes, the urban dwellers are witnessing increased air and water pollution, shrinking green spaces, increased flash floods due to increased build-up areas and emergence of urban heat islands effect [34]. Regardless of various regulation and conservation bylaws, in the absence of effective UGS governance due to lack of data availability, planning, management and decision making about UGS poses a big challenge for stakeholders.
2.2. Workflow of Thematic Map
The workflow followed for mapping in represented in Figure 2, followed by detailed explanation of each step in the following sections.
2.3. Supporting Data
The supporting data used for thematic mapping (Table 1) was procured and added to ArcGIS 10.5.1. The boundary data was available in soft copy (dwg. extension). The dwg. extension file was exported to ArcGIS to change the line format to polygon by using “Feature to polygon tool in Data Management Tools”. After changing the feature, the coordinate system was transformed into projected coordinate system of “WGS_1984_UTM_Zone_44N” using “Project feature of Projections and Transformations in Data Management Tools”. The land use map was available in hard copy format, so it was scanned and georeferenced to add in GIS as base reference data.
2.4. Identified UGS Typologies and Classes for Mapping
The study followed the definition by Coles and Grayson, which considers access and function to define UGS, thus only public green spaces covered by vegetation and used for recreation and green spaces which enhance the quality of life of urban regions are considered [35]. Though private UGS are equally important, they are liable to change and are not accessible to everyone and hence were excluded from the study. Further based on the usage functionality, the research categorized the UGS typologies as in Table 2.
The different classes were digitized, and their attributes were added as separate layers in the thematic map and described in the following section. The detailed classification of public UGS allows a more holistic view to understand public UGS without hindering the broader objective of provision of various ecosystem functions and benefits.
For the two classes under recreational UGS typology (parks and garden and playground), the hierarchical categories are derived from the Urban and Regional Development Plan Formulation Implementation (URDPFI) in India guideline as represented in Table 3.
2.5. Added Attributes
In addition to the digital polygons assigned to the UGS the attributes as in Table 4 were added, for which the data was recorded during the field work. For all the typologies the GPS points were recorded (n = 192), and for the area of the features (polygons) the “Calculate Geometry” tool was used.
2.6. Methodology of Mapping
2.6.1. High Resolution Georeferenced Google Earth Imagery (GEI)
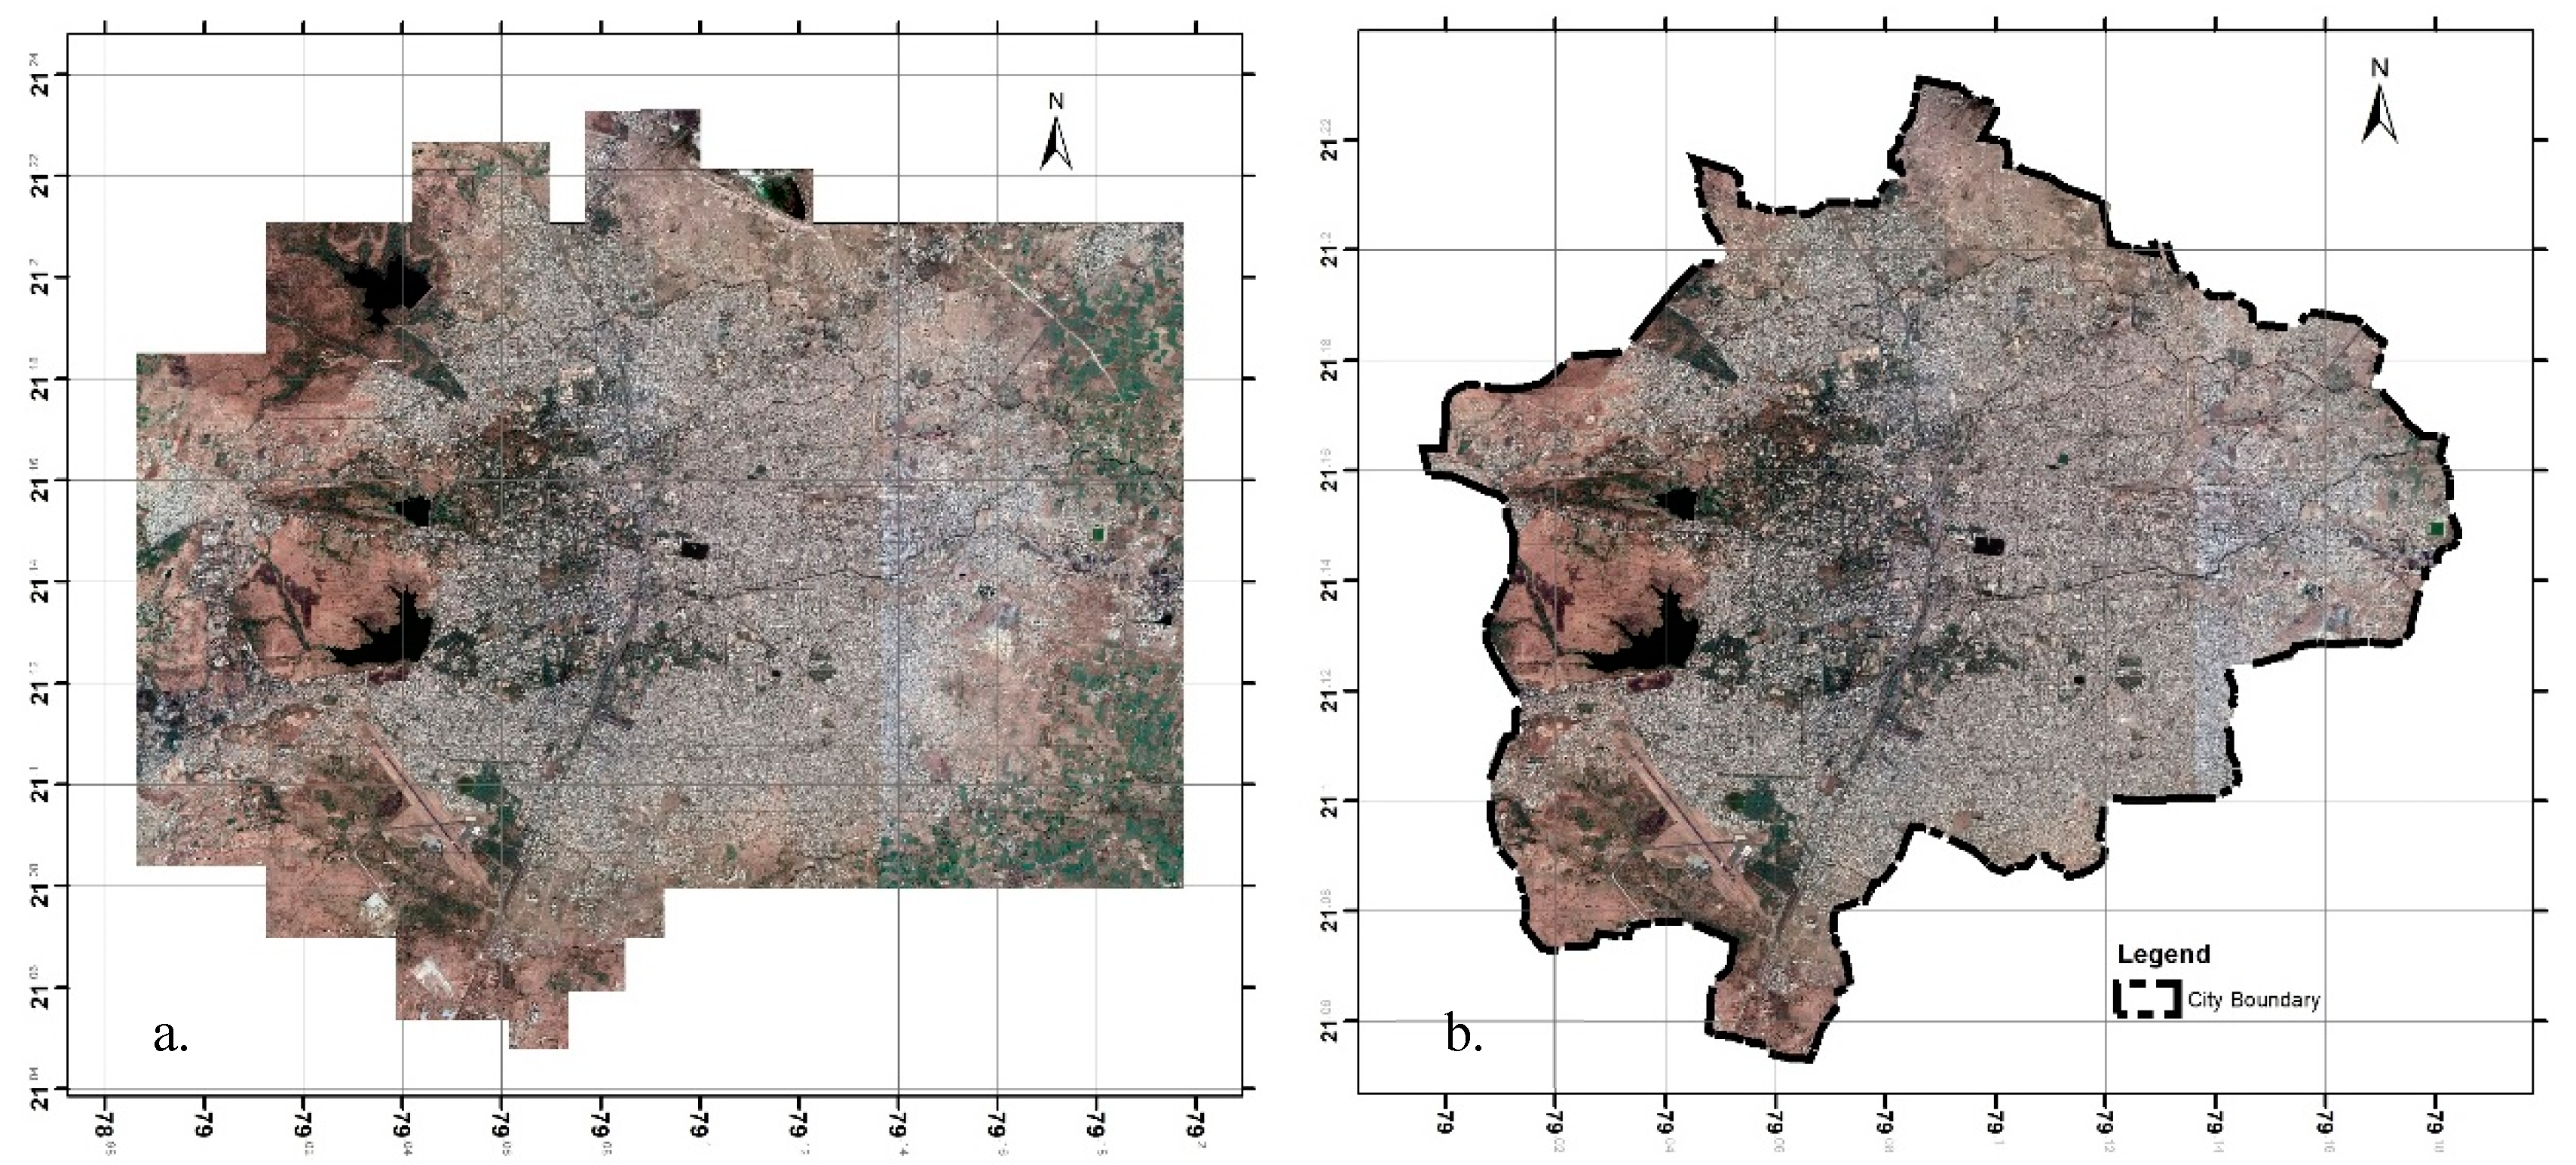
High resolution Google Earth Imagery (GEI) is an important source of information, particularly in an urban area where the land cover pattern is a complex mosaic of different land uses. The data source is open, thus for thematic map we used GEI, following visual interpretation approach by manual classification. For the base layer, high-resolution (2.5 m) georeferenced GEI was used to identify the objects on the ground to determine their meaning and significance and allocate the land class. As high-resolution image (2.5m) was not freely available, the mosaic of georeferenced GEI was prepared in ArcGIS 10.5.1 by extraction of high-resolution images from Google Earth (GE) on 26 January 2018. The JPEG images were assigned coordinates using Shape2Earth plugin for Map Window. As the number of GEI were below 500, the unregistered demo worked well. This plugin allowed to save the current view in GE window along with a world file which contained the geo-referencing (geo-referencing and image rectification involves removal of random and systematic errors in the image and then transforms the image to UTM projection and WGS 84 datum) information with coordinates, in WGS84 datum. This GEI with geo-referencing data (n = 115) was added to ArcGIS 10.5.1, the raster dataset was then converted into a single image as shown in Figure 3a using the geoprocessing tool. The “Mosaic” tool allowed to generate one raster data with a coordinate system of “GCS_WGS_1984” which was transformed into the projected coordinate system of “WGS_1984_UTM_Zone_44N” using “Project feature of Projections and Transformations in Data Management Tools”. The shape file of city boundary was added to the base layer data (mosaic raster data) with the same projected coordinates and using the “Clip” tool in “Raster Processing” under “Data Management” the base map of GEI was clipped from the feature city boundary as shown in Figure 3b.
2.6.2. Vector Mapping of UGS in ArcGIS
The high resolution GEI available from satellite sensors allows mapping by obtaining current information about green areas of the city [36]. In GIS, using GEI as the base layer, the conventional vector mapping of UGS by visual interpretation was carried out and the assigned polygons were manually created. In addition to the mapped layer, the georeferenced land use plan and shapefiles of city administrative boundary, zone boundaries, ward boundaries and road network data were added. However, owing to lack of accuracy and lack of updated data in the hard copy of the land use map the mapping of UGS in peripheral area was challenging.
2.6.3. Field Survey Data and Reference Map
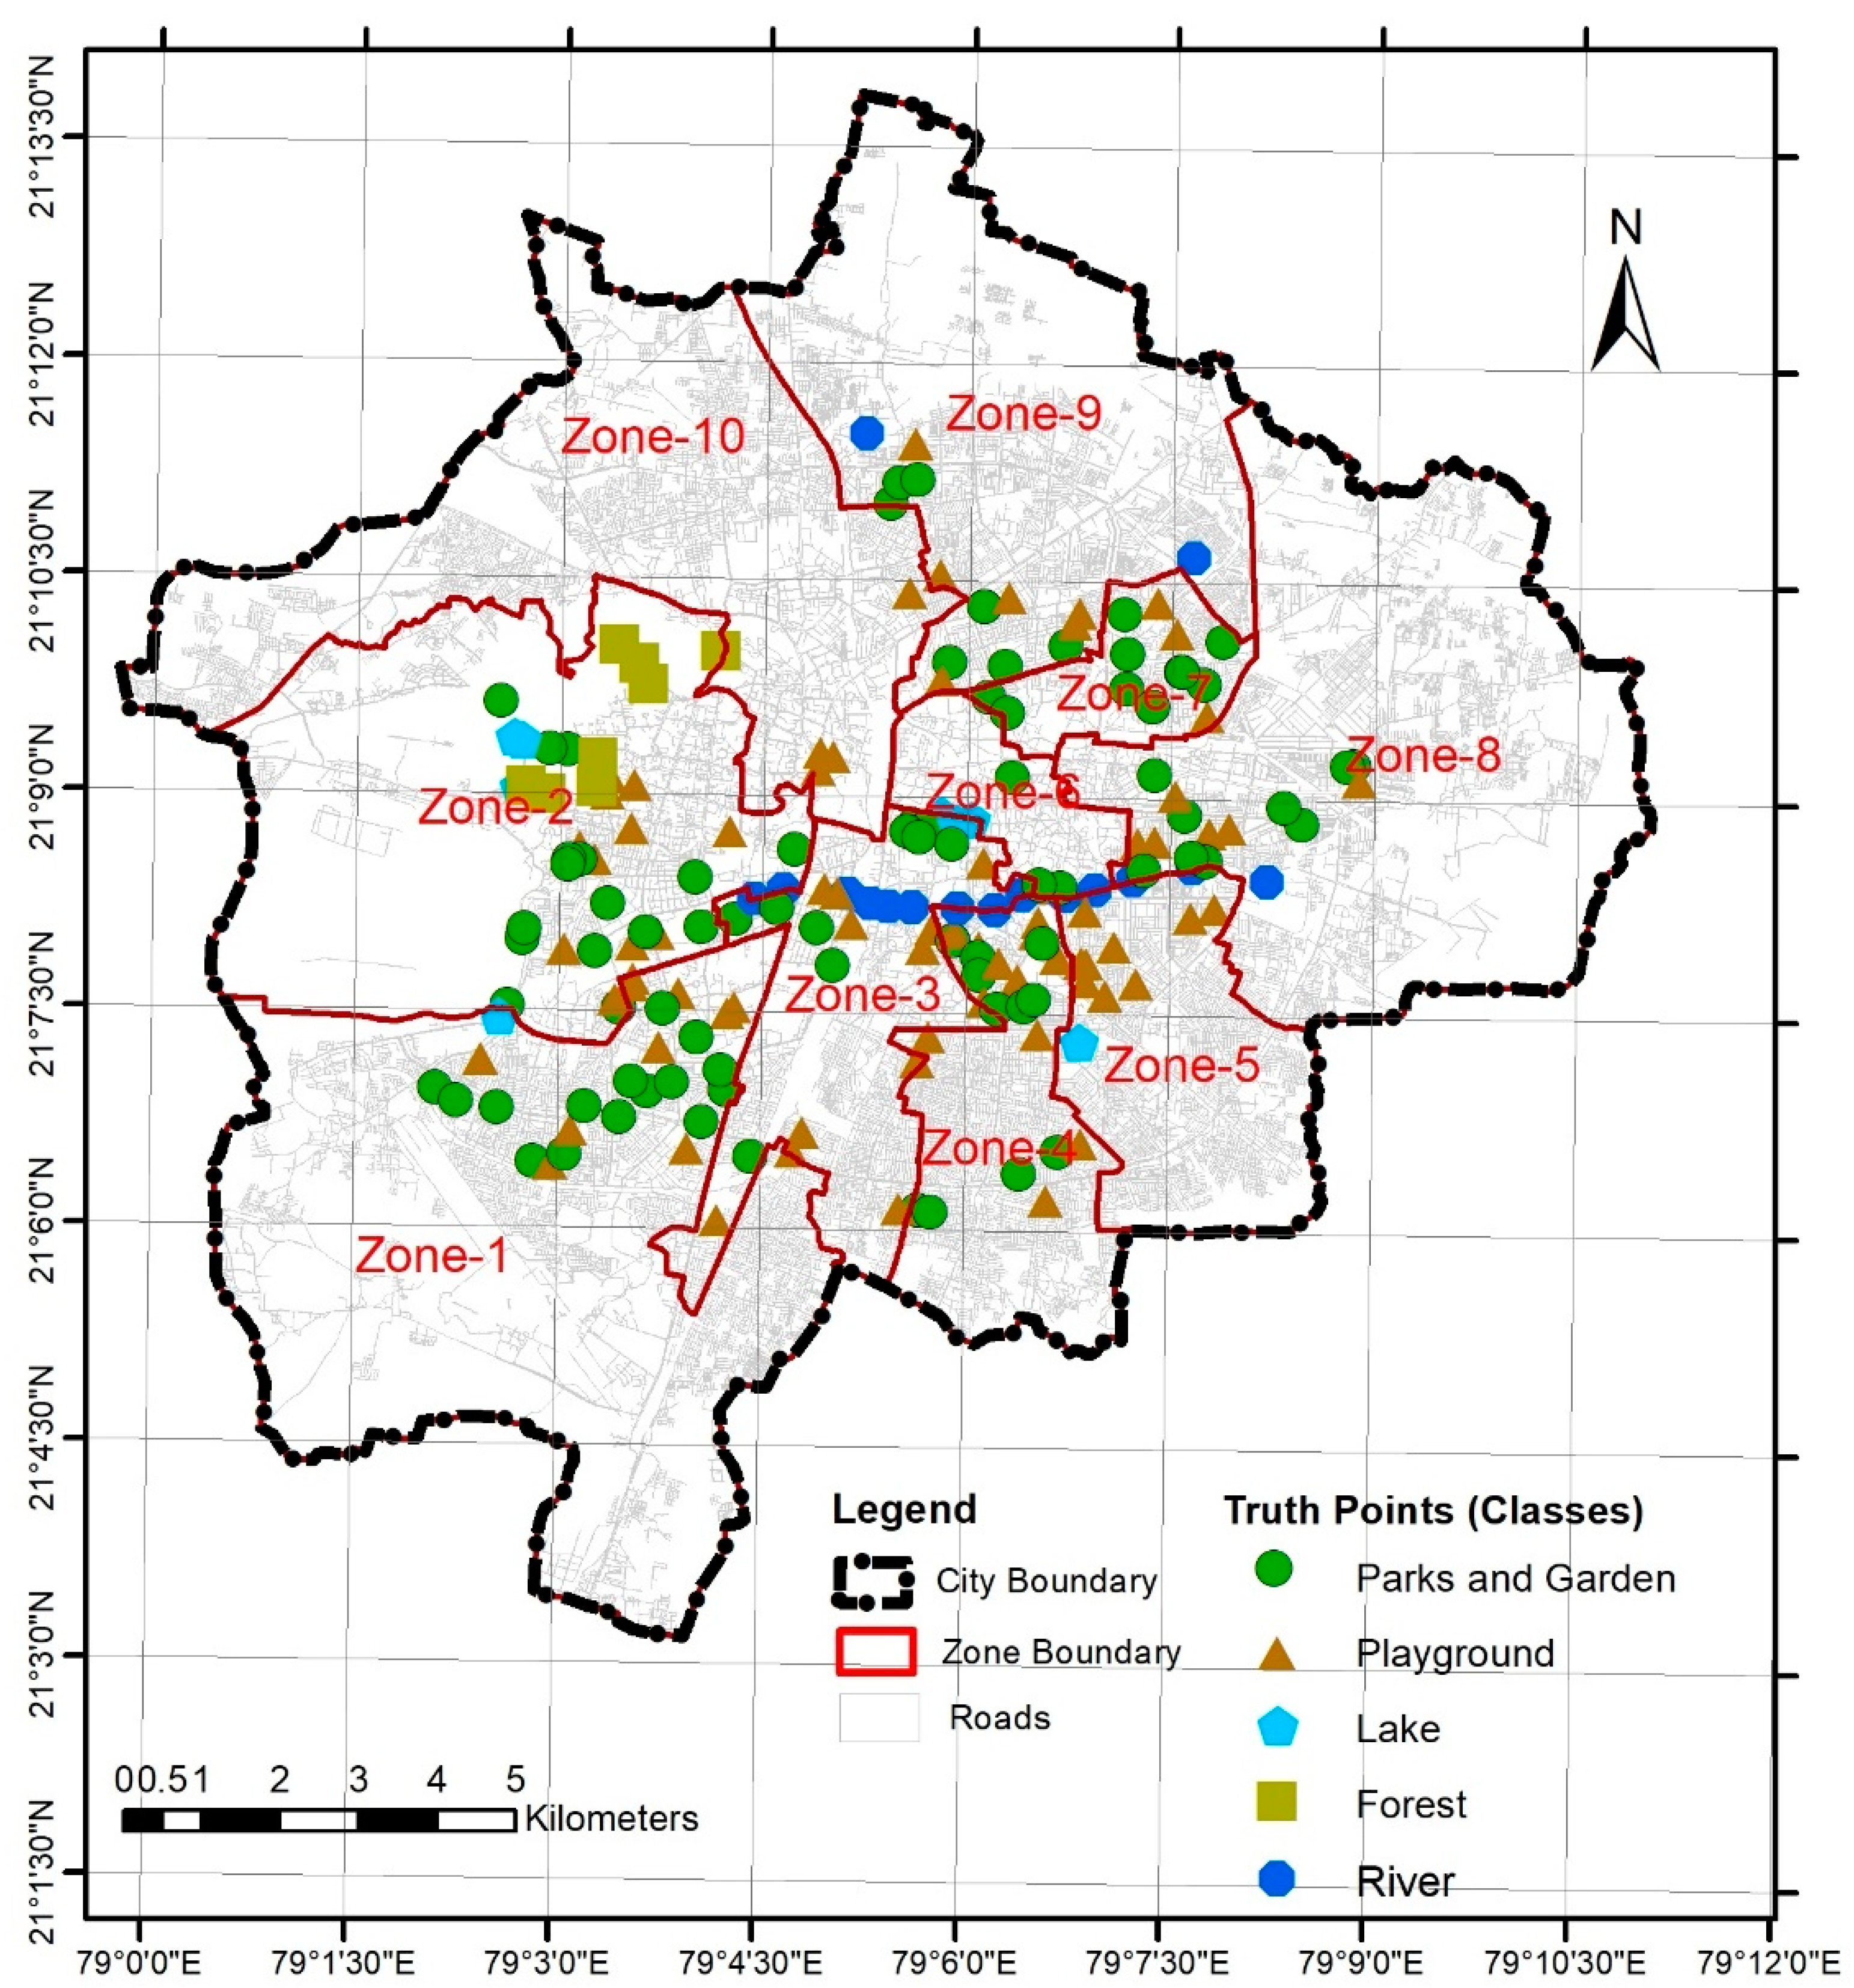
The base map (as in Figure 3b) was also used as a reference map to collect field data from 24 February to 10 April 2018. The aim was to collect the truth points using a GPS device and make additional observations to support the thematic map preparation and validation, as well as take note of added attributes to update on the status of UGS. All 10 zones were visited using a systematic random sampling method, where the study area was divided into smaller grids of 1 × 1 km (as in Figure 4a) and within each grid the between 15-18 UGS were randomly marked (Figure 4b) and visited to take on ground notes. The GPS points were taken by Garmin (etrex 30J). For the main classes under recreational UGS typology (parks and gardens and playgrounds) the truth points taken were above 50 [37]. As all the classes were not identified during the field visit, three classes namely lakes, forest and river indicated in the thematic map do not have adequate ground truth points, however, the field notes for these three typologies, were captured during the recent field visit from 10 December 2018 to 15 January 2019.
In all, 192 GPS points representing five classes of UGS were added into ArcGIS as a shape file. The GPS points were retrieved from the Garmin (etrex 30J) as track points and exported into ArcGIS as a shape file using GPS trackmaker version 13.9. The distribution of ground truth points representing different classes are shown in Figure 5.
2.6.4. Validation and Accuracy Assessment
The accuracy of the thematic map is dependent on several factors such as classification, mapping unit or image quality and may contain errors which need quantification. The accuracy represents the correctness or degree to which the attributes of the map agree with the truth reference dataset [38]. Thus, the quantified error is used to communicate the validity of results for their intended application and is calculated through accuracy assessment. While several methods are used to measure the accuracy, the most commonly used method is confusion or error matrix, for a series of descriptive and statistical analysis. To carry out the same, after adding the reference map, the thematic map file was converted into a raster map using “feature to raster” tool. The classified polygons (vectors) of the thematic maps were converted into a raster map. Using the “extract value” function in ArcGIS the values were extracted from the classified raster and compared with the truth points. Then by using the “frequency tool” the frequency of two values (truth values and predicted values) were counted. The frequency tool shows how many predictions are correct for each point. Then, using the “pivot table” tool a confusion matrix was constructed using equations (Equations (1)–(4)) to arrive at kappa statistics.
where k represents the number and the map nomenclature to be 1, 2, …, k; nij = number of sample units that in the map belong to class i and in the reference belong to class j; ni. = sum of the elements in row i, i.e., the number of sample units classified into class i in the remotely sensed classification; n.j = sum of the elements in column j, i.e., the number of sample units classified into class j in the reference; n = total number of sample units [39].
3. Results
GIS is used to maintain the inventories of UGS, through the raster dataset received from satellites for the monitoring of vegetation in urban and rural areas [40,41]. In this study using ArcGIS 10.5.1 and open source data (Google Earth), a UGS mapping methodology is proposed. The amplitude of mapping lies in the detailed list of categories and classes considered for mapping UGS. The results are discussed in detail in the sections below.
3.1. Accuracy and Validity of Thematic Map
Accuracy assessment of the map quantitatively states the accuracy of the generated map, and is important as the data derived from these maps can be used for further assessment, hence, accuracy reflects the reliability of data. The pivot table with kappa statistic is represented in Table 5. The overall accuracy of thematic map is 95% and the kappa statistic was 0.93. For the sample size (n = 192), the producer’s accuracy for all the classes was above 85%. The user accuracy for the reserved green spaces in form of parks and playground is 100%, while for lake, forest and river class it was above 65%. As per Cohen, the Kappa results are interpreted as follows: values ≤0 as indicating no agreement and 0.01–0.20 as none to slight, 0.21–0.40 as fair, 0.41–0.60 as moderate, 0.61–0.80 as substantial, and 0.81–1.00 as strong agreement, thus the 0.93 value reflects strong agreement between the thematic map and reference map and hence high accuracy of the thematic map. Thus, the derived data can be effectively used for further assessments to identify the service area gap or evaluate the quantitative and qualitative aspects by adding into further relevant attributes.
3.2. Different Categories of Public UGS Identified in Thematic Map
The generated thematic map of public UGS of Nagpur city with different typologies of public UGS is shown in Figure 6. The successive figure clearly indicates the importance of adopting a detailed classification, as the public institutionalized and infrastructure corridor significantly increases the share of UGS in the city (Figure 6c,d). Though these green spaces are not directly used for recreational purposes they provide various intangible benefits and connect the green spaces throughout the city. The share of vacant land is also significantly high at present in the peripheries, however owing to the urban transition scenario these lands are subjected to change into residential areas.
3.3. Status of UGS typologies
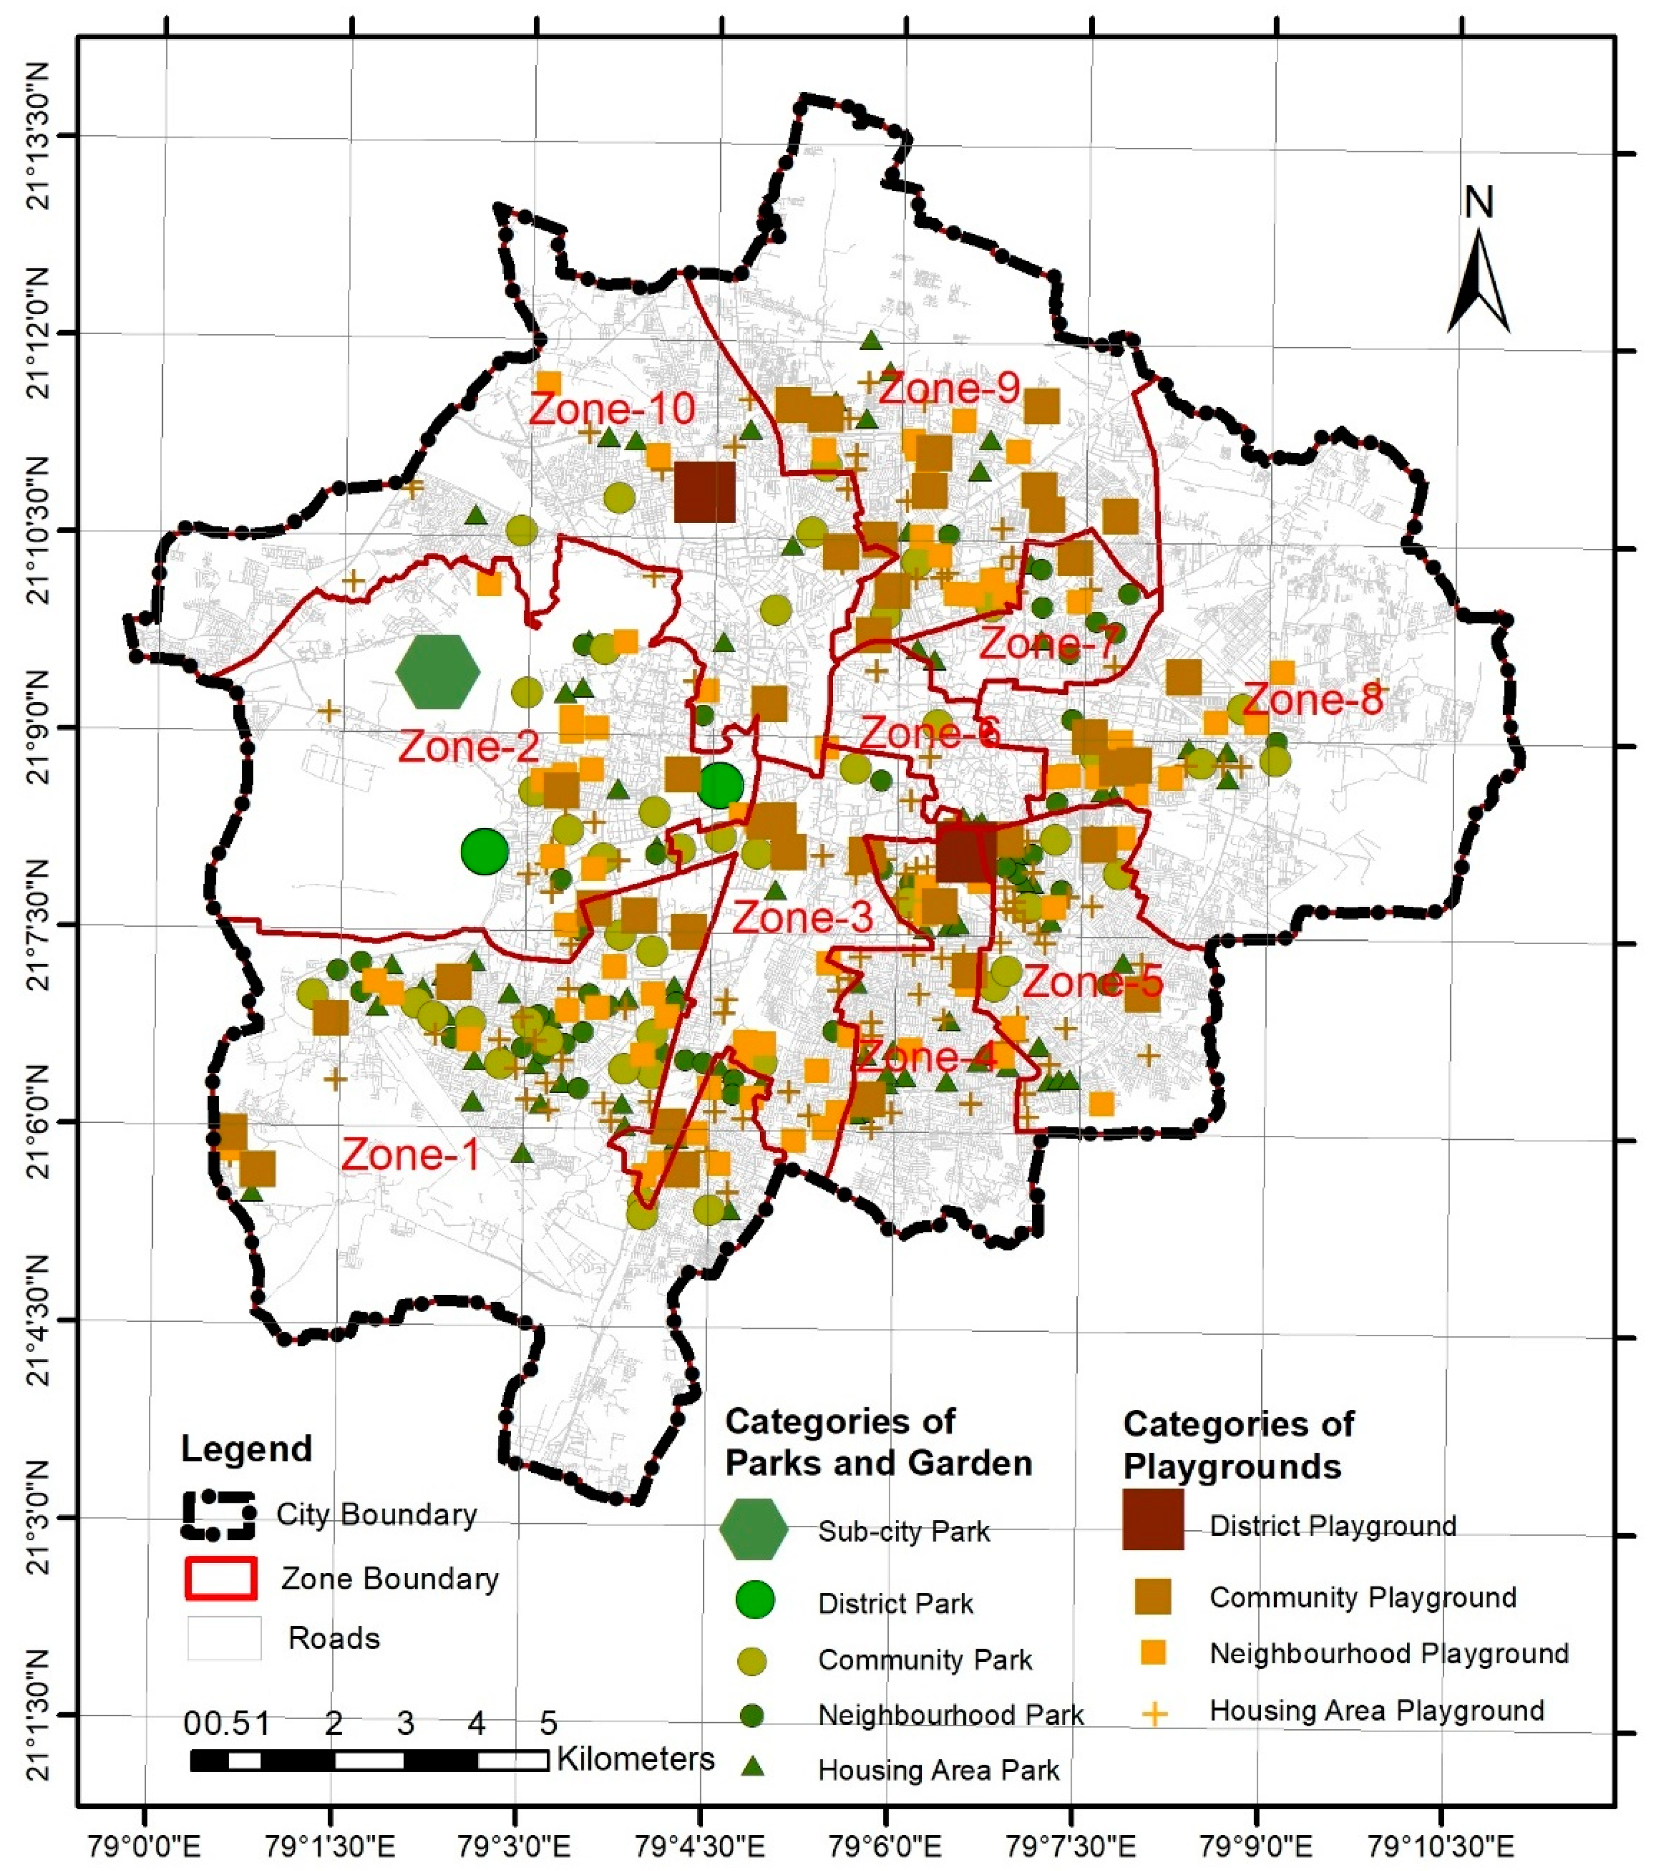
The realistic picture of available recreational UGS as in Figure 6a shows that the recreational UGS, though important due to direct recreational benefits, owe relatively smaller portions in cities UGS provisions, which reflects the deficit identified by local authorities in the development plan (Ministry of Urban Development, 2015). The hierarchical distribution based on the URDPFI guideline as in Table 6 and spatial distribution as in Figure 7 highlights the lack of provision as well accessibility issue with regard to sub-city and district green spaces.
3.3.1. Recreational UGS Typology—Parks and Gardens
The parks and gardens are maintained by Nagpur Municipal Corporation (NMC). Most of the housing area and neighborhood parks and gardens have a typical layout with similar activities, however vary in terms of size and degree of maintenance. The typical areas are sitting areas, walking trails, kids play sections, green gym sections, open lawns and shaded platforms for yoga (Figure 8a–f).
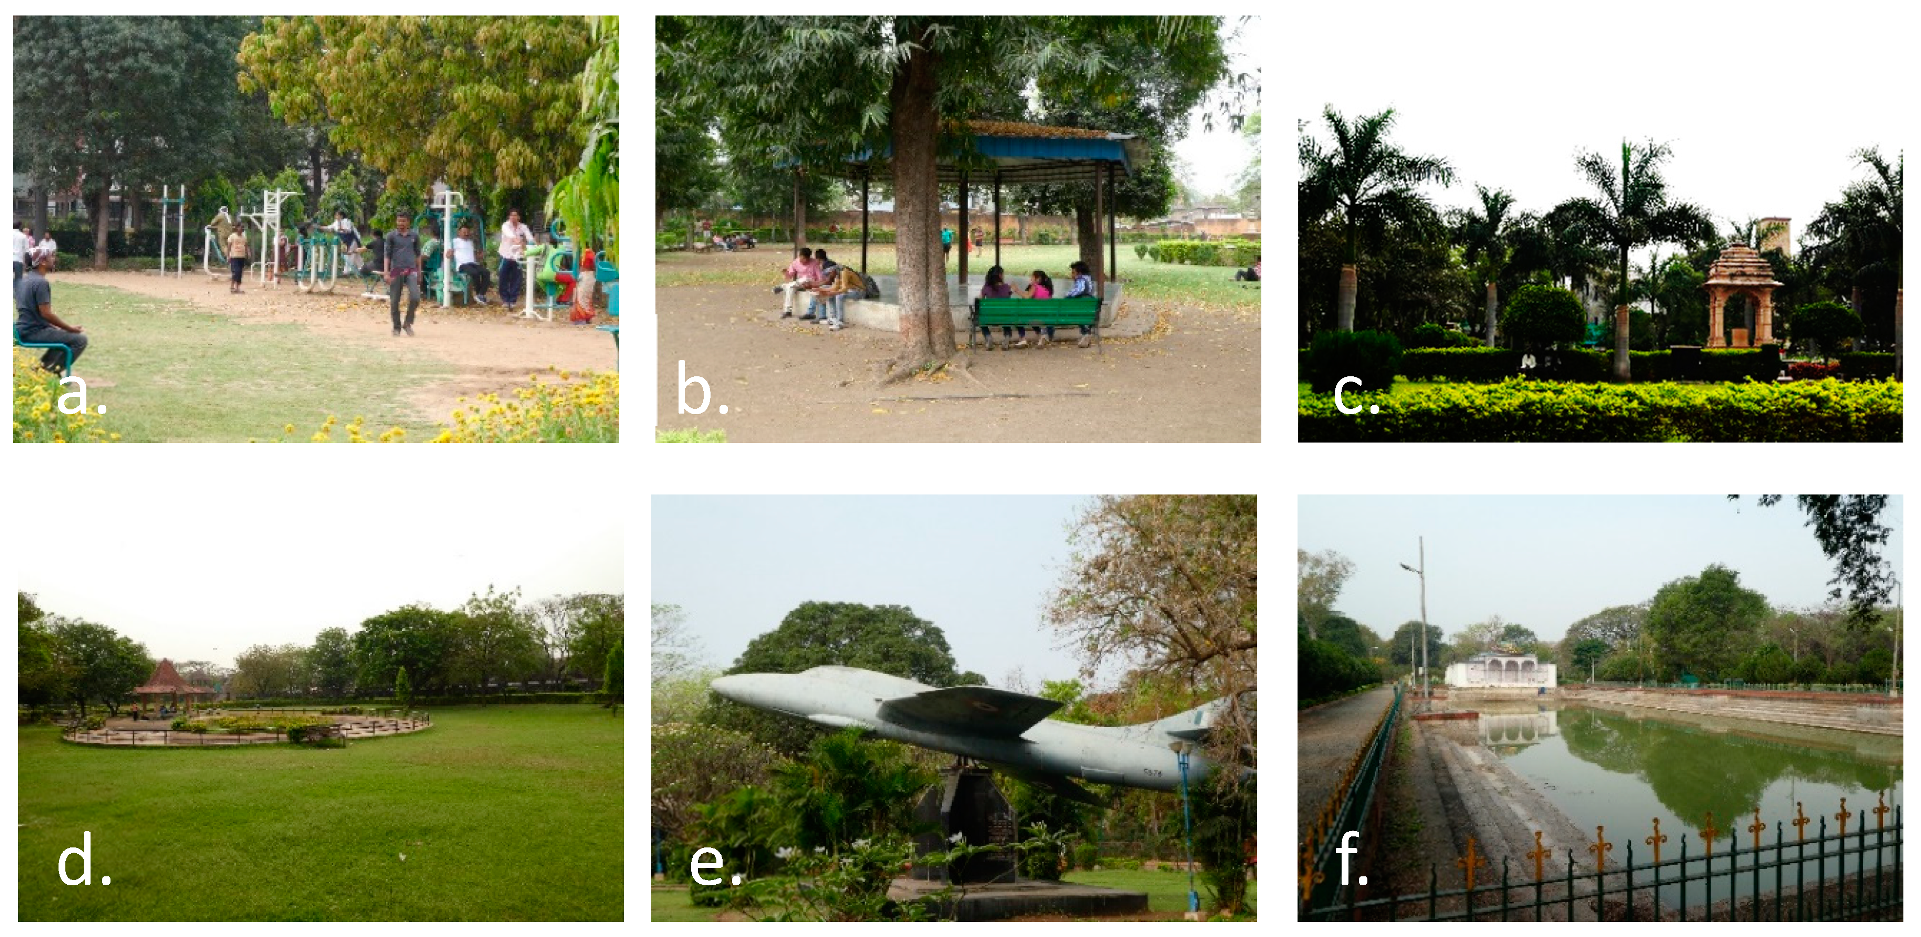
The green gym and shaded platforms for yoga are recent additions (3–4 years before) and are widely used, however at many places the position is random. As the community and districts parks have more areas, added features such as water fountains, sculptures, gazebos are seen with bigger lawns and play areas (Figure 9a–f).
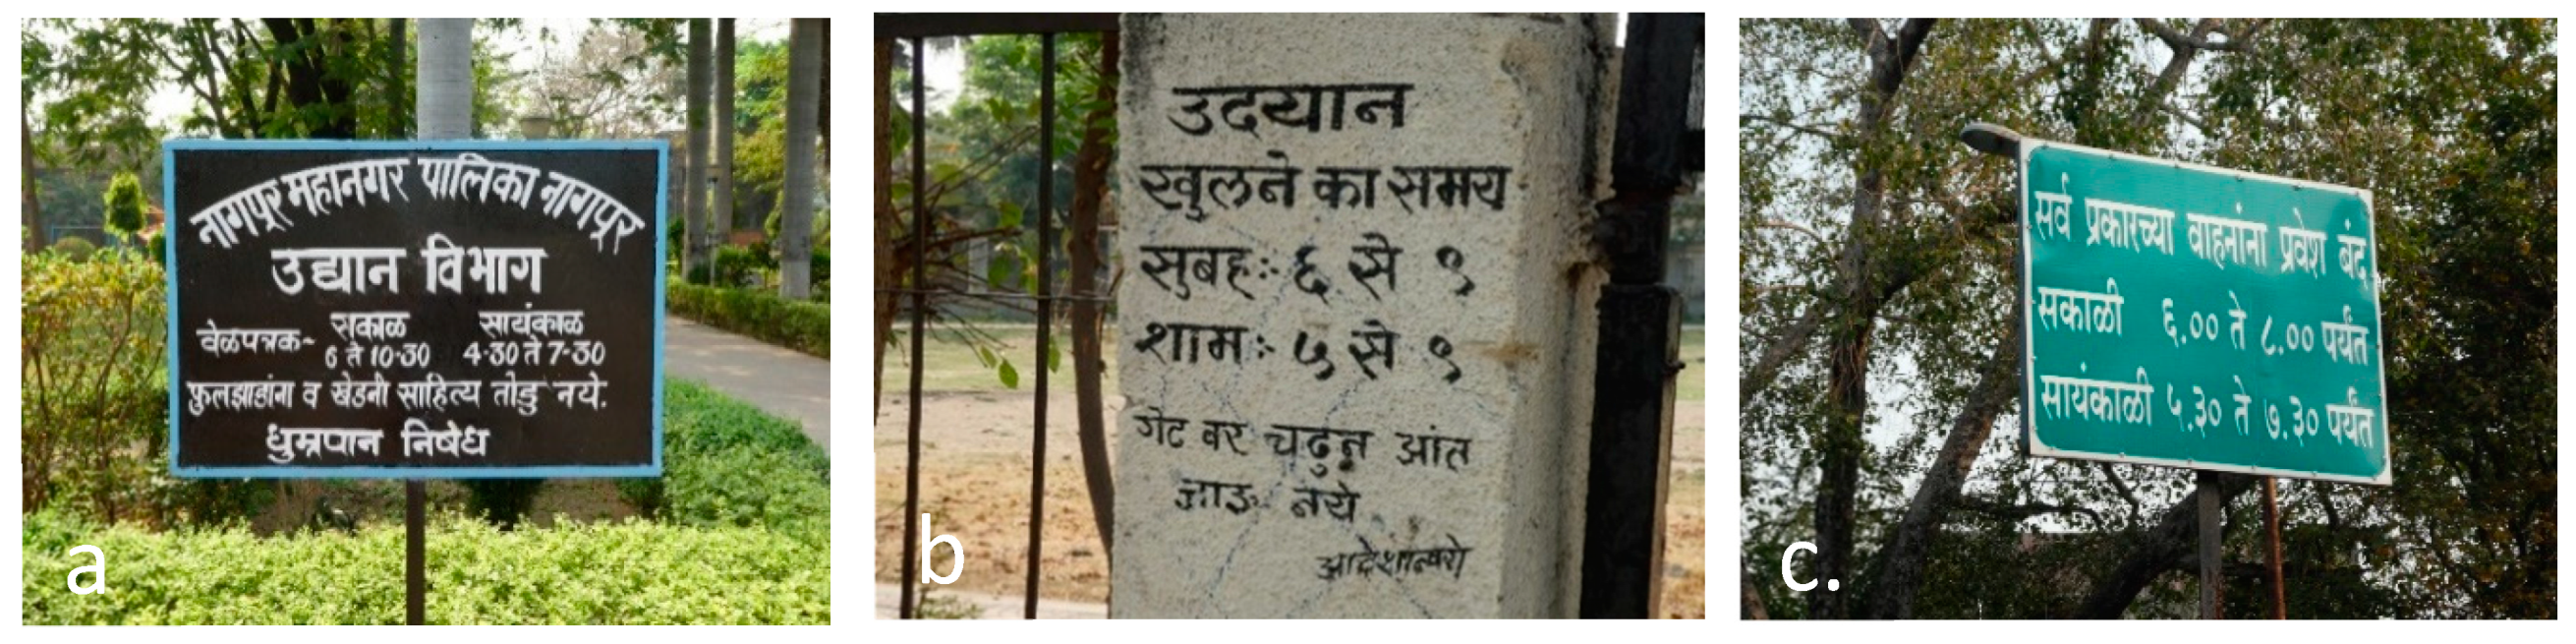
Most of the parks and gardens have free access except 4 to 5 community and district parks having nominal entrance fees. They are maintained by NMC with permissible access during day and evening time for 3 to 4 hours, with differing timings depending on the location as shown in Figure 10a–c. In afternoon they are closed for maintenance and cleaning purposes.
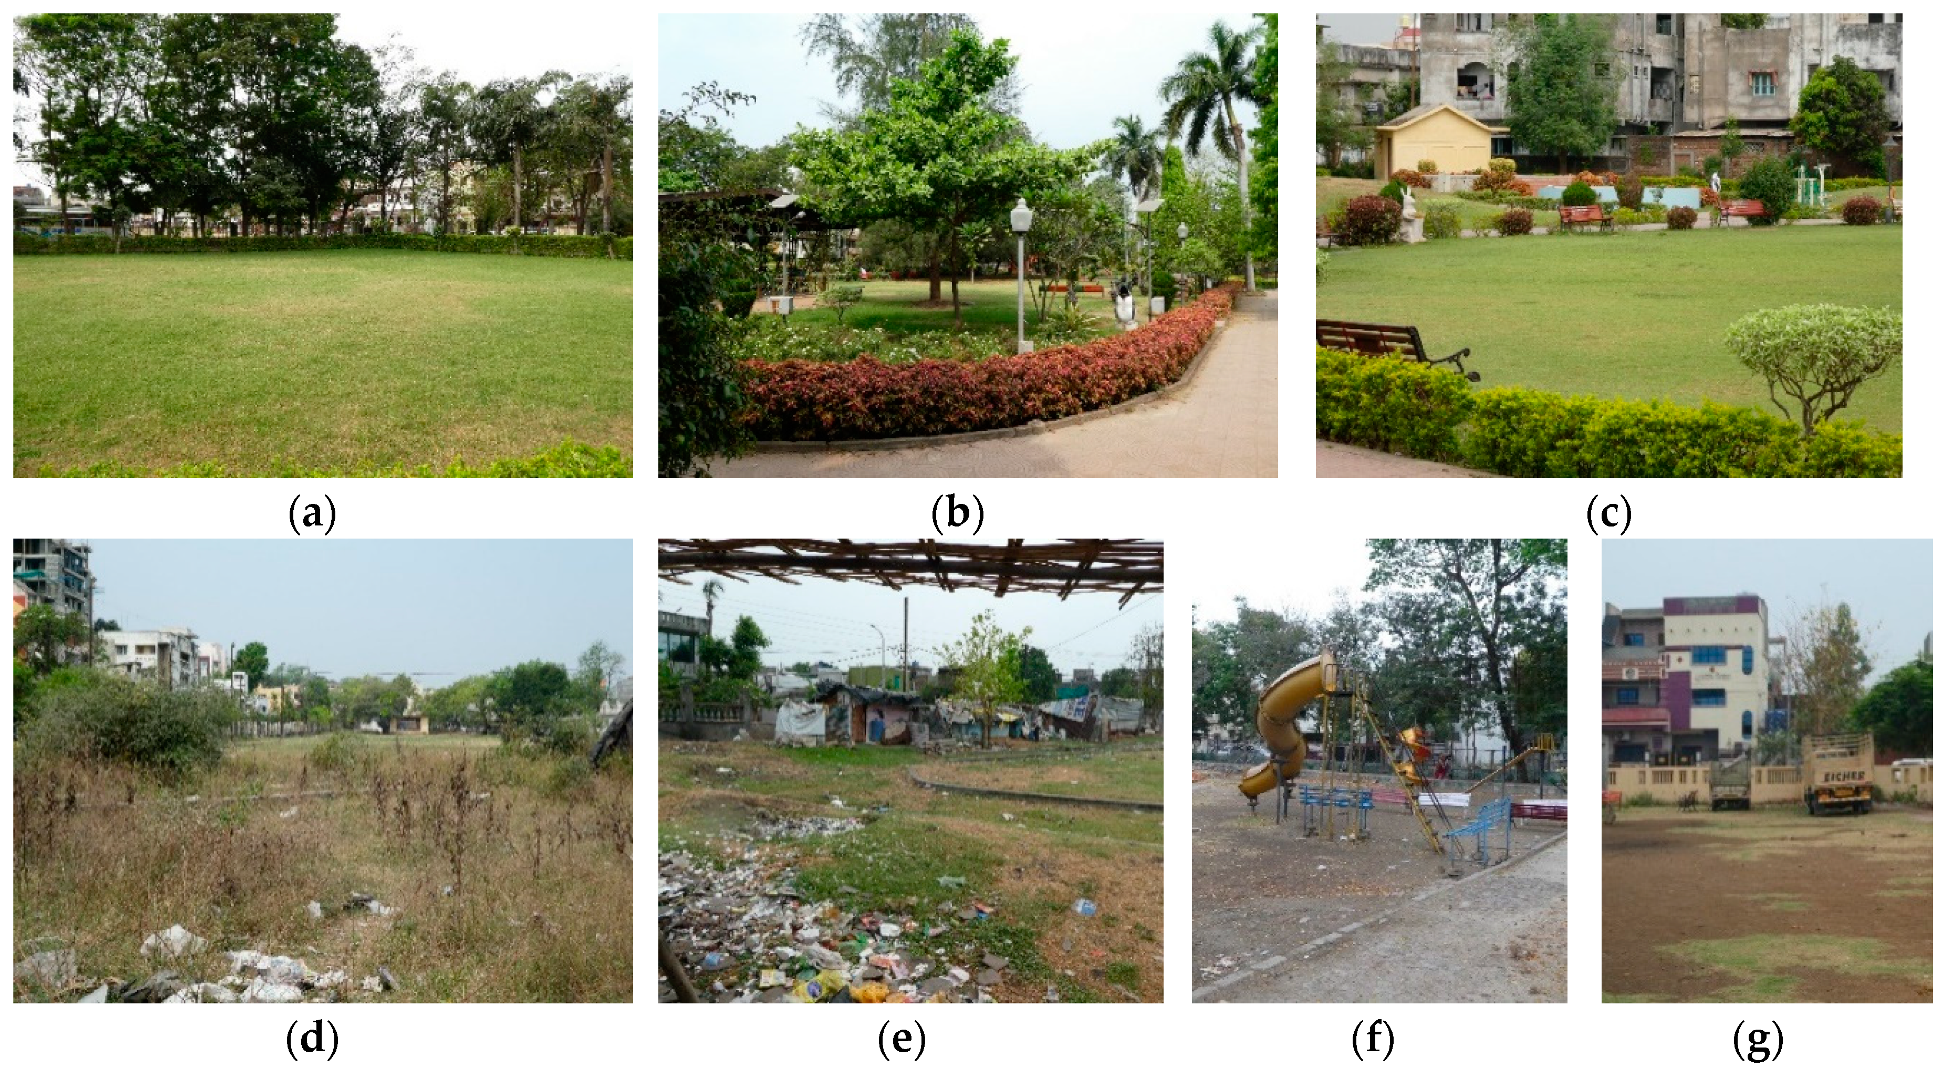
Though more detailed qualitative analysis through field study is recommended to understand the vegetation character of each class, the below photographs give a general idea about the vegetation character that is prevalent. The parks and gardens have manicured landscapes in form of mowed lawns, pruned shrubs, shady trees and flowering plants (Figure 11a–c). Maintenance varied across the city, most of the gardens of the westerns parts and central areas are well maintained while the garden towards the peripheral area of north, east and south-east sides lacks maintenance with overgrowth, litter, vandalism, stray animals and even encroachments (Figure 11d–g).
3.3.2. Recreational UGS Typology—Playgrounds
Playgrounds have barren compacted lands with very low peripheral vegetation (Figure 12a). Only few playgrounds had paved surfaces and courts to support sports activities such as basketball and badminton (Figure 12b). The district and community playgrounds are often used and maintained by staff, however, the housing area and neighborhood playground are not well maintained (Figure 12c–e) and hence underutilized.
3.3.3. Recreational UGS Typology—Lakes
The natural lakes in western peripheries with attached parks and gardens (Figure 13b) are developed to fulfil recreational needs (Figure 13a,c), however they cater to a limited population due to access issues as well as activities catering to the younger generation. While, the lakes within the city are not being optimally used owing to congested surroundings and maintenance issue (Figure 13d,e). Despite revitalizing efforts by the local authority, owing to the top down approach in redeveloping the lake front, the provisions are under-utilized (Figure 13f). Other water bodies within the city are also underutilized and are being used as sewage and garbage disposal points.
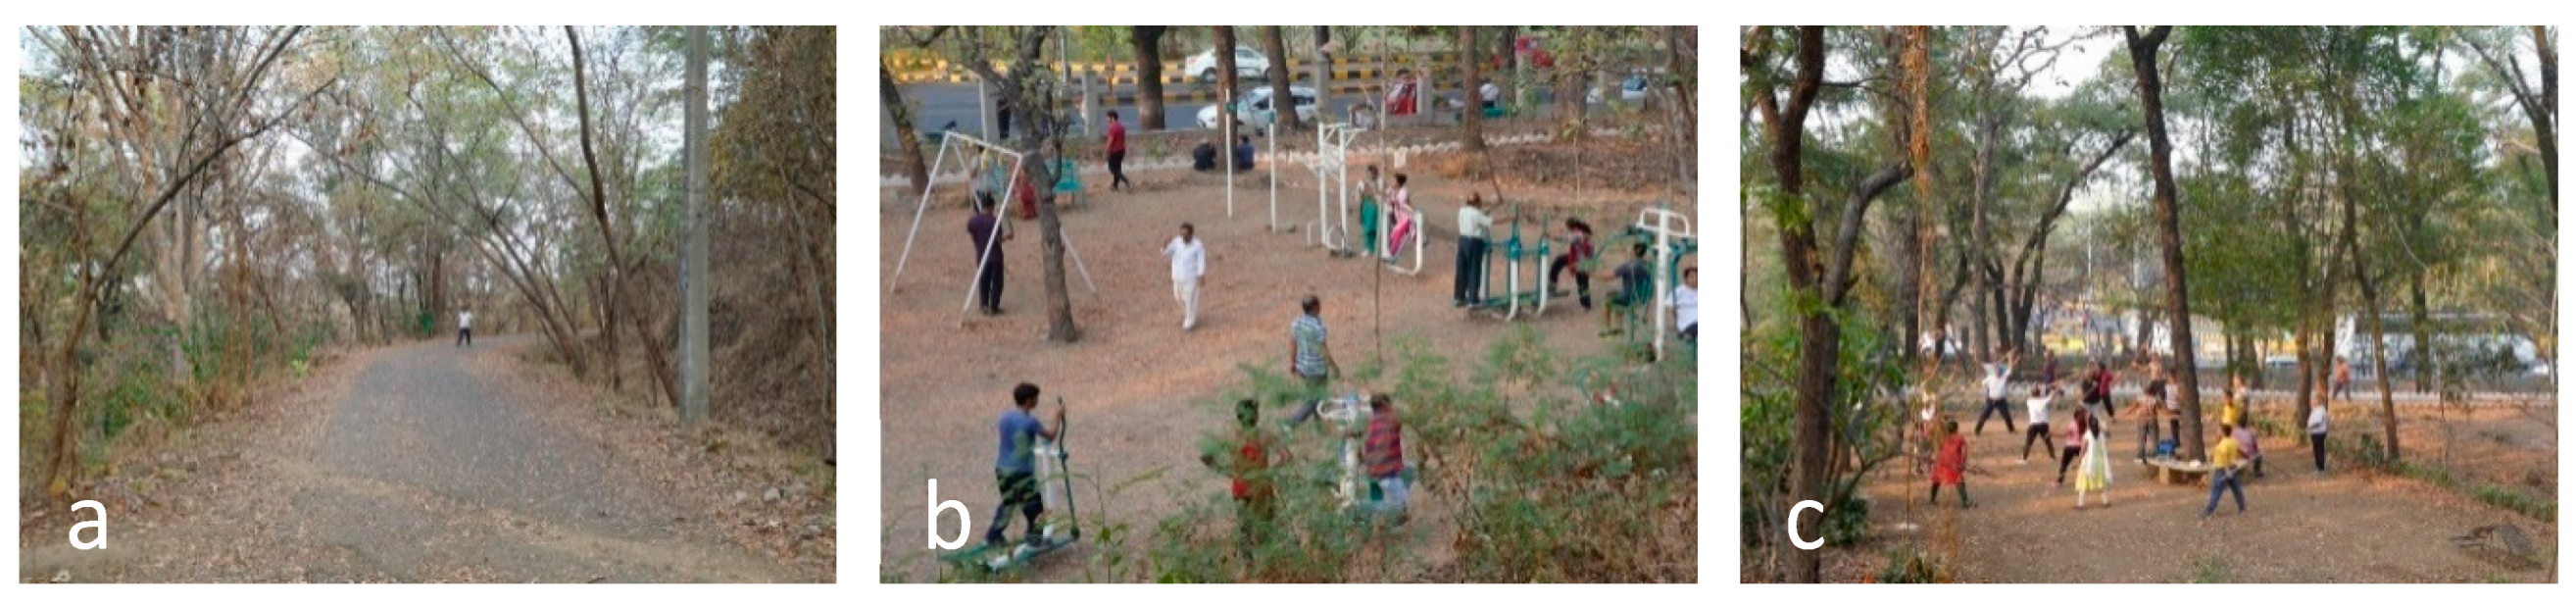
3.3.4. Recreational UGS Typology—Urban forest
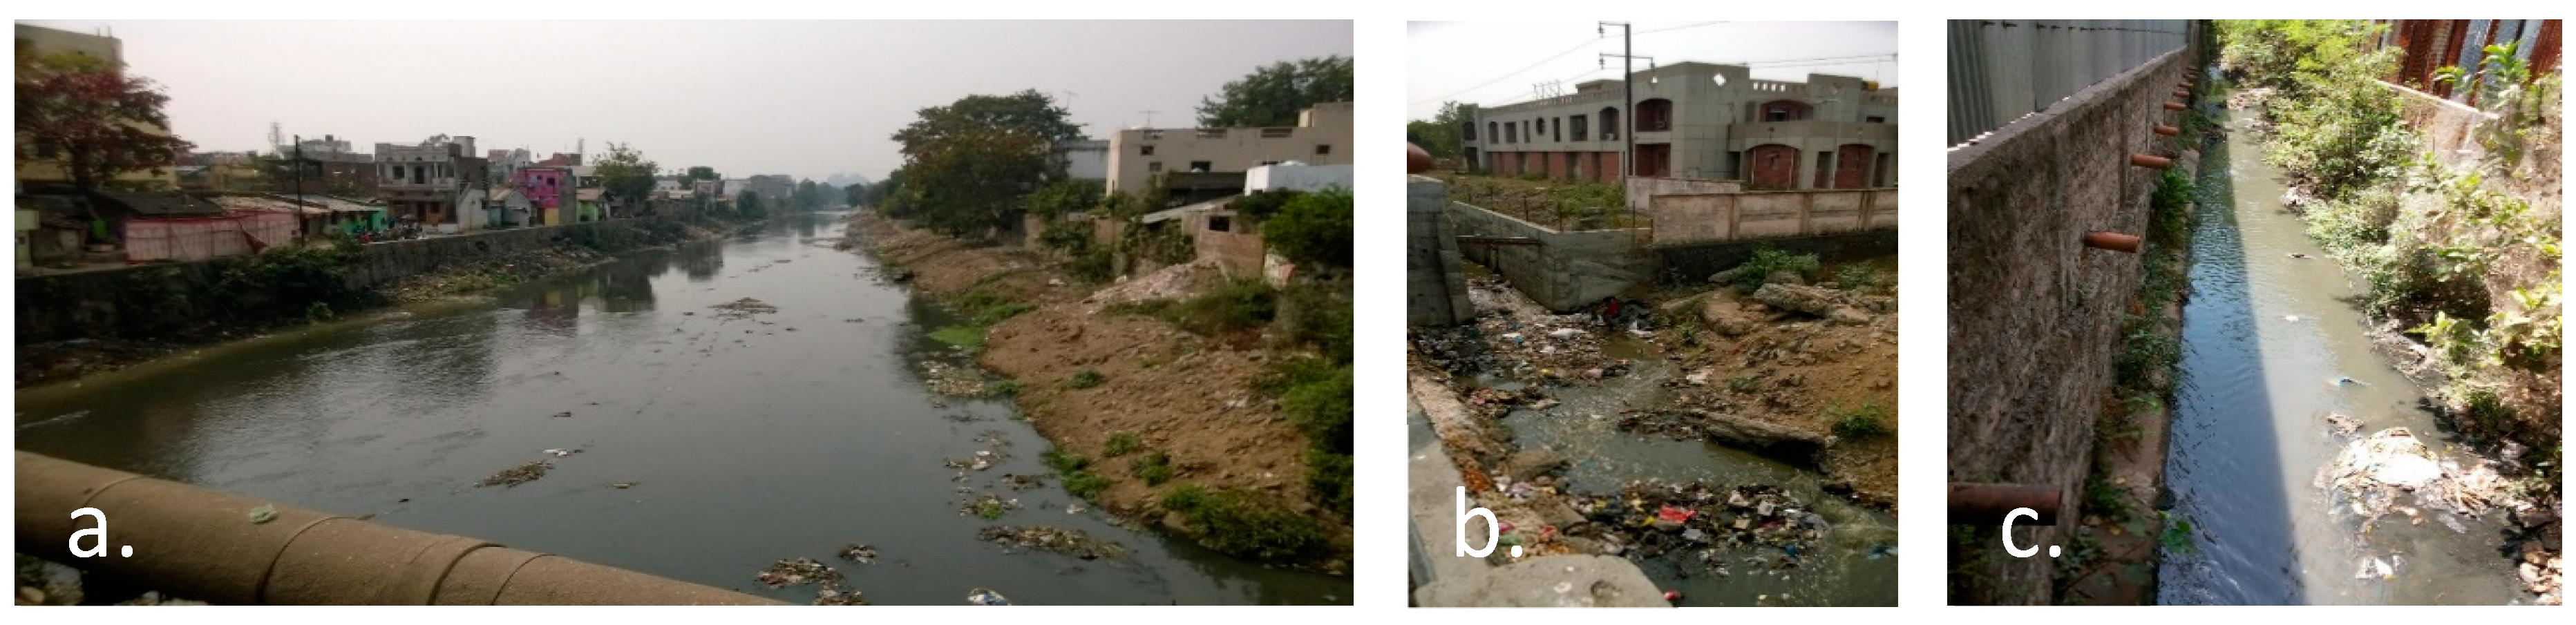
3.3.5. Open UGS Typology—River
In addition to underutilized water bodies (lakes), the water channel traversing the city with a stretch of around 17 km of varying width and depth, are also untapped public UGS with status as sewage channels along most of its course (Figure 15a–c). Though in the proposed city development plan the city envisions to establish treatment plants along the water course and develop these water tributaries as recreational spaces [42], at present they are in a dilapidated state [34].
3.3.6. Institutionalized UGS
The institutionalized green spaces within institutional campuses and government housing campuses form the major share of public UGS with coarse vegetation, however most of these institutions are in the western part of the city (Figure 6c) and have restricted access. Though few campuses allow access to neighborhoods in certain parts of the campuses for morning strolls and exercise, mainly these green spaces are for the population within the compounds, however the greater environmental benefits such as heat sinks and thick vegetation are experienced by nearby neighborhoods [43]. In terms of vegetation, the institutionalized green spaces have dense vegetation maintained in a natural form and hence rich in flora and fauna [43,44].
3.3.7. Infrastructure and Utility Corridor
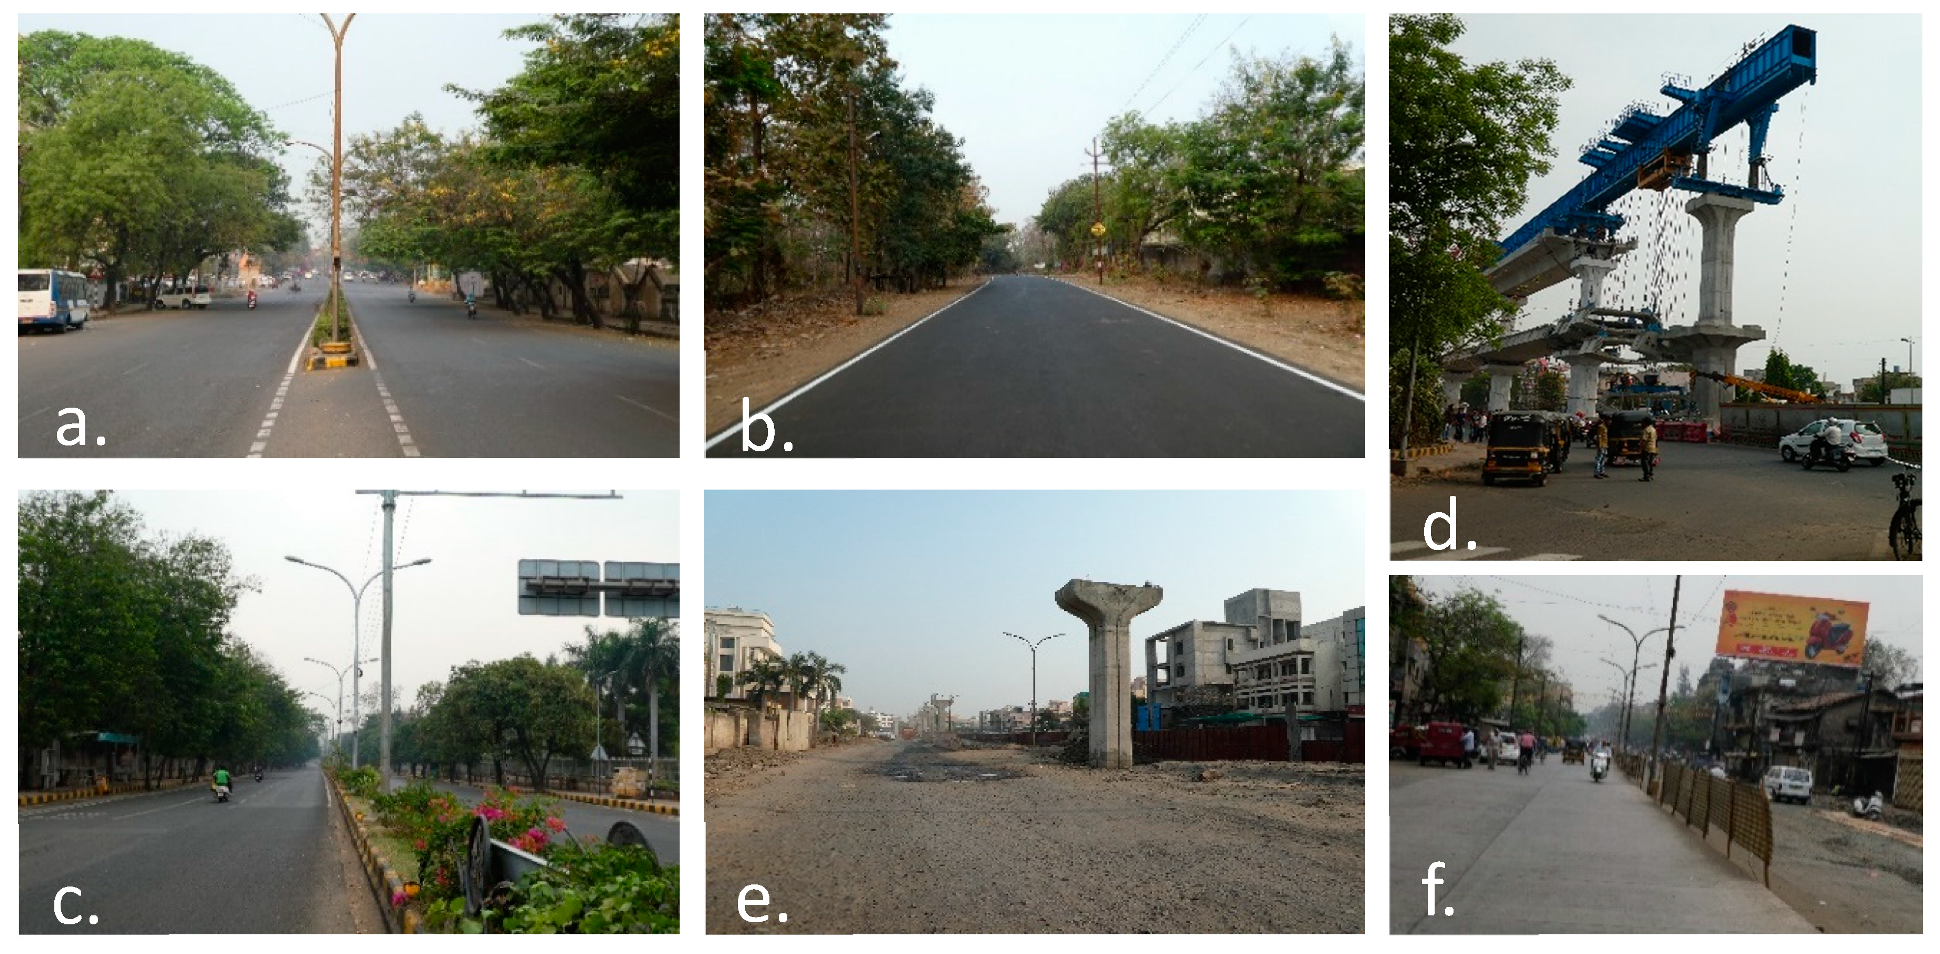
Adding the fourth typology, the road networks to the map gives a more integrated picture of how these linear spaces, if enhanced with green spaces, can help to build network of green spaces to enhance the urban environment of city. Although at present the roadside green spaces is affected due to road widening and metro construction projects, these linear spaces hold a great amount of potential area to increase the total available UGS. Some of the major arterial roads on the west side of the city still have good road side plantations (Figure 16a–c), while other trees along the roads are subjected to compensatory plantation or are left in a suffocating situation in the urban transition process (Figure 16d–f). Most of the arterial roads in the east part of the city lack avenue plantation due to an organic growth pattern, the countable trees planted as an afterthought and are under stress with increased pollution and vandalism.
3.3.8. Vacant Land
The fifth typology in the form of vacant land is in the peripheries, which mainly includes the agriculture land which is converted into residential land use. As the available development plan is not updated and the peripheries were subjected to illegal conversion under the Guntewari act, the land use and ownership patterns in the peripheries are quite complex and unclear. Including vacant land as part of public UGS due to available open land gives a false impression about the available UGS in the city as they are subject to change.
3.4. Distribution of Accessible Public UGS (Five Classes)
Considering the importance of direct benefits of recreational facilities of the city, the five main classes are analyzed at finer administrative unit referred at zones. The city is divided into 10 zones, amongst which Western zones have lower population density with enhanced green cover due to the presence of natural landscape in the form of lakes and reserve forest. Zone 2 has highest share of available accessible public UGS with natural lakes and associated sub-city parks and Zone 10 is the second greenest due to the presence of urban forest. On the contrary the Eastern zones have a low share of available UGS, while the central areas have high population density and thus the available green spaces are more stressed. The map as in Figure 17 and the graphical abstract shows the share of different classes of green spaces in each zone.
4. Discussion
Under the urban transition scenario prevalent throughout India [2,3], UGS are under tremendous pressure and hence need to be protected against unauthorized land allocations [45]. Thus, there is a dire requirement to record the status of UGS and prepare spatial data to support planning, management and decision making to facilitate UGS governance aiming towards a broader aim of overall urban sustainability. Within this context, the study proposed a methodology to prepare a thematic map of UGS for Nagpur city, which combines high resolution GEI data with field data (ground data) to update the status of typologies prevalent in the city and their distribution. In addition to the quantitative data, through field work many other attributes were added which presents a holistic view of prevalent classes of UGS, thus presents integrated spatial data which can support logical and informed urban greening.
The thematic map with detailed classification has high accuracy and is reliable to be used as a base map for further analysis. The quantitative details as well as the distribution of recreational UGS within the city and at the zone level is very clear and evident in maps. Data about quantity or available UGS to the urban dweller can be derived from these maps to calculate the per-capita UGS availability. In addition, owing to the high accuracy, the spatial data can be used by local authorities to decide on possible expansion areas for future UGS provisions. The data can be further explored with added attributes for community mapping or participatory GIS mapping to arrive at locally derived sustainability indicators and practices [46].
The distribution of green spaces indicate that Eastern zones grossly lack UGS, while Western zones compensate the deficit by having high amount of UGS in all the classes of green spaces. The presence of natural green spaces along with the higher share of institutional green spaces makes the Western part of city the greenest due to which the city owes the title of “Green City” [44]. Though Nagpur has relatively good overall green cover, the local authorities need to enhance green space provisions in the Eastern part which lacks natural green spaces [44] and have substantially low provisions of reserved green spaces. The city also indicates uneven distribution of UGS [42,44]. Further, many playgrounds are underutilized, planning of which can be revisited by involving local users in planning and management processes with local authorities for well maintained and accessible play provisions [47]. Thus, though the recreational reserved green spaces are protected against land use change, they need more attention towards planning and management due to increased dependency of citizens on these spaces to fulfill their daily recreational needs as well perform additional functions to maintain the urban environment of the city.
The Western zone with natural lakes has major recreational areas, but these lakes are subjected to pollution due to discharge of domestic sewage [48] and hence effective monitoring of water quality, conservation of wetland and maintenance is recommended. For lakes within the city, strategic rejuvenation and revitalization is recommended with a more inclusive and participatory approach wherein the potential of the lakes as major recreational space can be realized with enhanced green spaces to overcome the identified deficit. Additionally, the water tributaries, though currently in a highly degraded state, offer good opportunity of optimization of UGS, by increasing the greenbelt with enhanced plantation along the linear corridor the landscape provision of the Eastern zone can be improved while creation of small neighborhood parks along its course can fulfil the shortage of reserved green spaces. Thus, in a scenario of current deficit in recreation UGS [42], and further decline in peripheral green spaces with demographic growth, the open recreational UGS needs to be enhanced and revitalized to fulfil the recreational and social needs of the citizens in the changing city structure.
Though few studies have captured the floristic diversity [49], more studies on institutionalized green spaces are needed as they provide various socio-ecological benefits to urban dwellers, which needs to be incorporated in planning processes to have a holistic view of UGS coverage. Further, though in the urban expansion green spaces along the arterial roads are decreasing [50], the road networks are key to integrate the fragmented green spaces, as well effective planning of roads can allow easy access or linkage between small and larger green spaces. Thus, more detailed analysis to strategically plan towards linear green spaces though enhanced roadside plantation is recommended with thematic maps as base maps to facilitate integration. With the indicated urban sprawl, due to poor land use planning leading to consumption of open lands [30], the pressure on the existing reserved UGS, institutionalized green spaces as well other typologies is very high and hence needs careful and inclusive planning approach and policies, with stringent implementation to overcome the gap and realize the vision of “Green Nagpur” [42]. For the vacant land which is subjected to residential development, in the near future particularly in the Eastern peripheries, effective and mandatory greening policies for private lands could be effective to curtail the shortfall caused by land use change.
5. Conclusions
The study contributes towards an effective mapping method of UGS for recording status, analyzing their spatial distribution and prioritizing the provisions. The geographical units identified in the map are of fine resolution where the smaller unit of below 0.1 ha is also identified and mapped along with detailed classes. Though time consuming due to dependence on open source data, the methodology can be very effective and fast for local authorities as high-resolution data may be more readily available to local authorities. In addition, the manual mapping of polygons to represent the extent and distribution of public UGS has certain limitations, such as, the road networks inclusion leads to a dramatic increase in area of public UGS, however, these open spaces have relatively low vegetative cover, and hence leads to overestimation of green space if accounted as it is. Similarly, the institutional green spaces are mapped considering the site boundaries without excluding the built-up areas within the campus, and hence gives a higher side in terms available open space. These limitations can be addressed by object-based classifications (supervised) using high resolution satellite imagery, as they allow to determine more details such as density and variety of vegetation on the geographical unit [19]. However, for preliminary data generation, the adopted methodology with an aim to give an overall representation of available typologies of UGS is justified.
In addition to current UGS mapping, in future research per-capita UGS availability and accessibility mapping [51,52], thematic maps of social and environmental justice mapping [53,54], ecosystem benefits mapping [55,56], heat island effect mapping [32] and more qualitative mapping is suggested. These attributes would help to understand the invisible tradeoff as well as foreground understanding to diverse stakeholders, which are often based on place specific local identity and cultural influences. In addition, this work can be also more relevant with the assessment of global sensitivity and uncertainty analyses (GSUA) [57,58]. In fact, GSUA can be useful to determine the contribution of driving factors to detect potential urban green space. We also suggest more studies for local level spatial data generation using thematic maps to qualitatively assess UGS, such as the vegetation data, carbon sink potential of different typologies and more participatory studies to capture local social demands to be explored to make significant contributions to enhance our understanding about urban greening.
Author Contributions
S.L. conceived the original idea and carried out the field work and mapping work. S.L. wrote the manuscript with support from A.L. M.K. supervised and guided in mapping process. O.S. provided critical feedback throughout to finetune the research work and manuscript.
Funding
This research was funded by Ministry of the Environment, Japan, grant number: S15.
Acknowledgments
This research was funded by the Environment Research and Technology Development Fund (S-15 “Predicting and Assessing Natural Capital and Ecosystem Services” (PANCES), Ministry of the Environment, Japan). We are thankful to Udit Laddha and Rajeshwari Laddha for their support and valuable time. We give our sincere thanks towards the Garden Department head and other NMC staff for sharing their knowledge and time.
Conflicts of Interest
The authors declare no conflict of interest with respect to the research, authorship, and/or publication of this article.
References
- Satterthwaite, D. Cities’ contribution to global warming: Notes on the allocation of greenhouse gas emissions. Environ. Urban. 2008, 20, 539–549. [Google Scholar] [CrossRef]
- UN-Habitat. World Cities Report 2016. Urbanization and Development: Emerging Futures; UN-Habitat: Nairobi, Kenya, 2016. [Google Scholar]
- McKinsey. India’s Urban Awakening: Building Inclusive Cities, Sustaining Economic Growth. 2010. Available online: https://www.mckinsey.com/featured-insights/urbanization/urban-awakening-in-india (accessed on 10 April 2019).
- ICLEI—South Asia. Green Growth Good Practices; ICLEI—Local Governments for Sustainability, South Asia: Delhi, India, 2015; Volume 3.
- Schetke, S.; Qureshi, S.; Lautenbach, S.; Kabisch, N. What determines the use of urban green spaces in highly urbanized areas?—Examples from two fast growing Asian cities. Urban For. Urban Green. 2016, 16, 150–159. [Google Scholar] [CrossRef]
- Alberti, M.; Marzluff, J.M.; Shulenberger, E.; Bradley, G.; Ryan, C.; Zumbrunnen, C. Integrating humans into ecology: Opportunities and challenges for studying urban ecosystems. BioScience 2003, 53, 1169–1179. [Google Scholar] [CrossRef]
- Rao, P.; Puntambekar, K. Evaluating the Urban Green Space benefits and functions at macro, meso and micro level: Case of Bhopal City. Int. J. Eng. Res. Technol. 2014, 3, 359–369. [Google Scholar]
- Gómez-Baggethun, E.; Barton, D.N. Classifying and valuing ecosystem services for urban planning. Ecol. Econ. 2013, 86, 235–245. [Google Scholar] [CrossRef]
- Kabisch, N.; Qureshi, S.; Haase, D. Human-environment interactions in urban green spaces—A systematic review of contemporary issues and prospects for future research. Environ. Impact Assess. 2015, 50, 25–34. [Google Scholar] [CrossRef]
- Tzoulas, K.; Korpela, K.; Venn, S.; Yli-Pelkonen, V.; Kazmierczak, A.; Niemela, J.; James, P. Promoting ecosystem and human health in urban areas using green infrastructure: A literature review. Landsc. Urban Plan. 2007, 81, 167–178. [Google Scholar] [CrossRef]
- Bhaskar, P. Urbanization and Changing Green Spaces in Indian Cities (Case Study—City of Pune). Int. J. Geol. Earth Environ. Sci. 2012, 2, 148–156. [Google Scholar]
- Dallimer, M.; Davies, Z.G.; Diaz-porras, D.F.; Irvine, K.N.; Maltby, L.; Warren, P.H.; Armsworth, P.; Gaston, K.J. Historical influences on the current provision of multiple ecosystem services. Glob. Environ. Chang. 2015, 31, 307–317. [Google Scholar] [CrossRef] [Green Version]
- Town & Country Planning Organisation. Urban Greening Guidelines; Ministry of Urban Development, Government of India: New Delhi, India, 2014.
- Troy, A.; Wilson, M.A. Mapping ecosystem services: Practical challenges and opportunities in linking GIS and value transfer. Ecol. Econ. 2006, 60, 435–449. [Google Scholar] [CrossRef]
- Meyer, B.; Grabaum, R. MULBO—Model framework for multi critieria landscape assessment and optimisation. A support system for spatial land use decisions. Landsc. Res. 2008, 33, 155–179. [Google Scholar] [CrossRef]
- Groot, R.S.D.; Alkemade, R.; Braat, L.; Hein, L.; Willemen, L. Challenges in integrating the concept of ecosystem services and values in landscape planning, management and decision making. Ecol. Complex. 2010, 7, 260–272. [Google Scholar] [CrossRef]
- Clarke, K. Analytical and Computer Cartography, 2nd ed.; Prentice Hall: Upper Saddle River, NJ, USA, 1995. [Google Scholar]
- Muyphy, E.; King, E.E. Mapping for sustainability: Environmental noise and the city. In Methods of Sustainability Research in the Social Sciences; Sage: Newcastle upon Tyne, UK, 2013; 232p. [Google Scholar]
- Yusof, M.J.M. The True Colours of Urban Green Spaces: Identifying and Assessing the Qualities of Green Spaces in Kuala Lumpur, Malaysia; Institute of Geography, University of Edinburgh: Edinburgh, UK, 2012. [Google Scholar]
- Dennis, M.; Barlow, D.; Cavan, G.; Cook, P.; Gilchrist, A.; Handley, J.; James, P.; Thompson, J.; Tzoulas, K.; Wheater, C.P.; et al. Mapping Urban Green Infrastructure: A Novel Landscape-Based Approach to Incorporating Land Use and Land Cover in the Mapping of Human-Dominated Systems. Land 2018, 7, 17. [Google Scholar] [CrossRef]
- Gupta, K.; Sharma, K.P.; Krishnamurthy, Y.V.; Kolapkar, R. FUNCTIONAL ASSESSMENT OF URBAN GREEN SPACES SPACES—A GIS ANALYSIS. In Proceedings of the 12th ESRI India User Conference, Noida, India, 7–8 December 2011. [Google Scholar]
- Gopal, S.; Woodcock, G. Theory and Methods for Accuracy Assessment of Thematic Maps Using Fuzzy Sets. Photogramm. Eng. Remote Sens. 1994, 60, 181–188. [Google Scholar]
- Sreetheran, M.; Adnan, M. Green network development of Kuala Lumpur City: From the perspective of Kuala Lumpur Structure Plan. Int. J. Postgrad. Stud. Archit. Plan. Landsc. 2007, 7, 38–41. [Google Scholar]
- Kafafy, N. The Dynamics of Urban Green Space in an Arid City: The Case of Cairo-Egypt; UMI Number: U584501; Cardiff University: Cardiff, UK, 2010; Available online: http://orca.cf.ac.uk/54400/1/U584501.pdf (accessed on 10 December 2017).
- Tan, P.; Wang, J.; Sia, A. Perspectives on five decades of the urban greening of Singapore. Cities 2013, 32, 24–32. [Google Scholar] [CrossRef]
- CABE Space. Urban Green Nation: Building the Evidence Base; CABE Space: London, UK, 2010. [Google Scholar]
- Tyrväinen, L.; Mäkinen, K.; Schipperijn, J. Tools for mapping social values of urban woodlands and other green areas. Landsc. Urban Plan. 2007, 79, 5–19. [Google Scholar] [CrossRef]
- Tran, H.; Pham, K.C. GIS-Based Management of Urban Tree and Green Spaces in Vietnam Cities. 2012. Available online: http://www.yepat.uni-greifswald.de/greenercities/images/stories/PDFs/8.pdf (accessed on 13 September 2018).
- Hassan, M.M.; Southworth, J. Analyzing Land Cover Change and Urban Growth Trajectories of the Mega-Urban Region of Dhaka Using Remotely Sensed Data and an Ensemble Classifier. Sustainability 2018, 10, 10. [Google Scholar] [CrossRef]
- Surawar, M.; Kotharkar, R. Environmental Impact Assessment in Urban Fringe to Achieve Urban Sustenance. In Proceedings of the International Conference on Advances in Architecture and Civil Engineering (AARCV 2012), Bangalore, India, 21–23 June 2012. [Google Scholar]
- Anguluri, R.; Narayanan, P. Role of green space in urban planning: Outlook towards smart cities. Urban For. Urban Green. 2017, 25, 58–65. [Google Scholar] [CrossRef]
- Surawar, M.; Kotharkar, R. Assessment of Urban Heat Island through Remote Sensing in Nagpur Urban Area Using Landsat 7 ETM+. Int. J. Civ. Environ. Struct. Constr. Archit. Eng. 2017, 11, 851–857. [Google Scholar]
- Verma, S.R.; Chaudhari, P.R.; Singh, R.K.; Wate, S.R. Studies on the Ecology and Trophic Status of an Urban Lake at Nagpur City, India. Rasayan J. Chem. 2011, 4, 652–659. [Google Scholar]
- Dhyani, S.; Lahoti, S.; Khare, S.; Pujari, P.; Verma, P. Ecosystem based Disaster Risk Reduction approaches (EbDRR) as a prerequisite for inclusive urban transformation of Nagpur City, India. Int. J. Disaster Risk Reduct. 2017, 32, 95–105. [Google Scholar] [CrossRef]
- Coles & Grayson. Improving the Quality of Life in Urban Regions though Urban Greening Initiatives-EU URGE-Project. 2004. Available online: https://www.researchgate.net/publication/237553539_Improving_the_Quality_of_Life_in_Urban_Regions_Through_Urban_Greening_Initiatives_-_EU_URGE-Project (accessed on 12 December 2017).
- Rozenstein, O.; Karnieli, A. Comparison of methods for land-use classification incorporating remote sensing and GIS inputs. Appl. Geogr. 2011, 31, 533–544. [Google Scholar] [CrossRef]
- Hay, A.M. Sampling designs to test land-use map accuracy. Photogramm. Eng. Remote Sens. 1979, 45, 529–533. [Google Scholar]
- Mas, J.F.; Azucena, P.V.; Adrián, G.; Silvia, M.; Jaime, O.; Ernesto, V. A Suite of Tools for Assessing Thematic Map Accuracy. Geogr. J. 2014, 2014, 372349. [Google Scholar] [CrossRef]
- Congalton, R.G.; Green, K. Assessing the Accuracy of Remotely Sensed Data: Principles and Practices, 2nd ed.; CRC Press: Boca Raton, FL, USA, 2009. [Google Scholar]
- Lang, S. Object-based image analysis for remote sensing applications: Modelling reality—Dealing with complexity. In Object Based Image Analysis; Springer: Heidelberg/Berlin, Germany; New York, NY, USA, 2008; pp. 1–25. [Google Scholar]
- Liu, Y.; Meng, Q.; Zhang, J.; Zhang, L.; Jancso, T.; Vatseva, R. An effective Building Neighborhood Green Index model for measuring urban green space. Int. J. Digit. Earth 2015, 9, 387–409. [Google Scholar] [CrossRef]
- Ministry of Urban Development. City Development Plan for Nagpur, 2041; Government of India: New Delhi, India, 2015.
- Katpatal, Y.B.; Kute, A.; Satapathy, D.R. Surface- and Air-Temperature Studies in Relation to Land Use/Land Cover of Nagpur Urban Area Using Landsat 5 TM Data. J. Urban Plan. Dev. 2008, 134, 110–118. [Google Scholar] [CrossRef]
- Chaturvedi, A.; Kamble, R.; Patil, N.G.; Chaturvedi, A. City–forest relationship in Nagpur: One of the greenest cities of India. Urban For. Urban Green. 2013, 12, 79–87. [Google Scholar] [CrossRef]
- Govindarajulu, D. Urban green space planning for climate adaptation in Indian cities. Urban Clim. 2014, 10, 35–41. [Google Scholar] [CrossRef]
- Fahy, F.; O’Cinneide, M. Re-constructing the urban landscape through community mapping: An attractive prospect for sustainability. Area 2009, 41, 167–175. [Google Scholar] [CrossRef]
- Bhonsle, K.D.; Adane, V.S. Status of Childrens Outdoor Play in Urban Settings-Casestudy-Nagpur [Maharashtra, India]. Am. J. Civ. Eng. Archit. 2015, 3, 200–207. [Google Scholar]
- Lanjewar, K.Y.; Kelkar, P.S. Studies on Rejuvenation of Futala Lake, Nagpur. In Proceedings of the 12th World Lake Conference, New Delhi, India, 29 October–2 November 2007. [Google Scholar]
- Gupta, R.B.; Chaudhari, P.; Wate, S.R. Floristic diversity in urban forest area of NEERI Campus, Nagpur, Maharashtra (India). J. Environ. Sci. Eng. 2008, 50, 55–62. [Google Scholar]
- Kumar, M.; Tripathi, D.K. Spatial Monitoring of Urban Growth of Nagpur City (India) Using Geospatial Techniques. J. Settl. Spat. Plan. 2014, 5, 91–98. [Google Scholar]
- Rosa, D.L. Accessibility to green spaces: GIS based indicators for sustainable planning in a dense urban context. Ecol. Indic. 2014, 42, 122–134. [Google Scholar] [CrossRef]
- Khalil, R. Quantitative evaluation of distribution and accessibility of urban green spaces (Case study: City of Jeddah). Int. J. Geomat. Geosci. 2014, 4, 526–535. [Google Scholar]
- Comber, A.; Brunsdon, C.; Green, E. Using a GIS-based network analysis to determine urban greenspace accessibility for different ethnic and religious groups. Landsc. Urban Plan. 2008, 86, 103–114. [Google Scholar] [CrossRef] [Green Version]
- Nicholls, S. Measuring the accessibility and equity of public parks: A case study using GIS. Manag. Leis. 2001, 6, 201–219. [Google Scholar] [CrossRef]
- Braquinho, C.; Cvejić, R.; Eler, K.; Gonzales, P.; Haase, D.; Hanse, R.; Kabisch, N.; Rall, E.L.; Niemela, J.; Paulei, S.; et al. A Typology of Urban Green Spaces, Ecosystem Services Provisioning Services and Demand. Green Surge, Report: D3.1. 2015. Available online: https://greensurge.eu/working-packages/wp3/files/D3.1_Typology_of_urban_green_spaces_1_.pdf/D3.1_Typology_of_urban_green_spaces_v2_.pdf (accessed on 25 March 2018).
- Burkhard, B.; Maes, J. Mapping Ecosystem Services; Pensoft Publishers: Sofia, Bulgaria, 2017; 374p. [Google Scholar]
- Convertino, M.; Muneepeerakul, R.; Azaele, S.; Bertuzzo, E.; Rinaldo, A.; Rodriguez-Iturbe, I. On neutral metacommunity patterns of river basins at different scales of aggregation. Water Resour. Res. 2009, 45. [Google Scholar] [CrossRef] [Green Version]
- Convertino, M.; Muñoz-Carpena, R.; Chu-Agor, M.L.; Kiker, G.A.; Linkov, I. Untangling drivers of species distributions: Global sensitivity and uncertainty analyses of MaxEnt. Environ. Model. Softw. 2014, 51, 296–309. [Google Scholar] [CrossRef]
Figure 1.
Geographic location of study area Nagpur city, Maharashtra, India.

Figure 2.
Flow diagram representing overall work flow adopted to arrive at thematic map of public UGS of Nagpur city.
Figure 2.
Flow diagram representing overall work flow adopted to arrive at thematic map of public UGS of Nagpur city.

Figure 3.
(a) Mosaic of georeferenced high-resolution raster images of Nagpur city; (b) clipped base layer of Google Earth Imagery (GEI).
Figure 3.
(a) Mosaic of georeferenced high-resolution raster images of Nagpur city; (b) clipped base layer of Google Earth Imagery (GEI).

Figure 4.
Base reference map. (a) High resolution GEI for field data collection; (b) zone wise smaller grids used in the reference map for random sampling.
Figure 4.
Base reference map. (a) High resolution GEI for field data collection; (b) zone wise smaller grids used in the reference map for random sampling.

Figure 5.
Reference map showing the distribution of ground truth points.

Figure 6.
Thematic map showing successive mapping layers of public UGS. (a) shows recreational UGS with identified four classes as parks and garden, playground, lake and forest (b) shows open UGS as river (c) shows institutionalized green spaces such as government institution and campuses (d) shows all road networks and vacant land in the periphery of the city.

Figure 7.
Distribution of different categories of recreational UGS.

Figure 8.
Typical design element presents in parks and gardens of the city. (a) Sitting area; (b) walking trails; (c) kids play equipment; (d) physical exercise equipment area referred as green gym; (e) open lawns; (f) shaded platform for yoga activities.
Figure 8.
Typical design element presents in parks and gardens of the city. (a) Sitting area; (b) walking trails; (c) kids play equipment; (d) physical exercise equipment area referred as green gym; (e) open lawns; (f) shaded platform for yoga activities.

Figure 9.
Typical design elements present in parks and gardens of city. (a) Green gym equipment randomly installed with not enough space for free moments while exercising; (b) yoga shed in the center of the park; (c) gazebo; (d) bigger lawn areas; (e) sculpture; (f) water feature.
Figure 9.
Typical design elements present in parks and gardens of city. (a) Green gym equipment randomly installed with not enough space for free moments while exercising; (b) yoga shed in the center of the park; (c) gazebo; (d) bigger lawn areas; (e) sculpture; (f) water feature.

Figure 10.
(a–c) Timing boards to access recreational UGS.

Figure 11.
Vegetation character and maintenance aspects prevalent in parks and gardens of the city. (a) Mowed lawns; (b) pruned shrubs, flowering plants and well-maintained gardens; (c) manicured lawn with sparse vegetation; (d) overgrown vegetation; (e) litter and garbage disposal in some of the parks and gardens; (f) un-maintained play equipment; (g) encroachment of park areas for parking.

Figure 12.
Playgrounds. (a) Open ground facilities in neighborhoods for active recreation; (b) few playgrounds have facilities in the form of basketball courts and badminton courts; (c–e) Un-maintained playgrounds with peripheral vegetation.
Figure 12.
Playgrounds. (a) Open ground facilities in neighborhoods for active recreation; (b) few playgrounds have facilities in the form of basketball courts and badminton courts; (c–e) Un-maintained playgrounds with peripheral vegetation.

Figure 13.
Lakes of the city. (a) Promenade of Futala lake; (b) Abazari garden attached to Abazari lake; (c) Futala lake front; (d) inner city lake; (e) Shukrawari Talav; (f) lake front development (kiosks) by Nagpur Municipal Corporation (NMC).
Figure 13.
Lakes of the city. (a) Promenade of Futala lake; (b) Abazari garden attached to Abazari lake; (c) Futala lake front; (d) inner city lake; (e) Shukrawari Talav; (f) lake front development (kiosks) by Nagpur Municipal Corporation (NMC).

Figure 14.
Reserve forests are open for public usage. (a) Pathways within the urban forest open for the public. (b,c) Community garden at the edge of the urban forest.
Figure 14.
Reserve forests are open for public usage. (a) Pathways within the urban forest open for the public. (b,c) Community garden at the edge of the urban forest.

Figure 15.
(a–c) Different courses of water tributaries passing though the city.

Figure 16.
Roads of Nagpur city. (a–c) Avenue plantation along the major roads; (d,e) metro construction work in progress leading to cutting and compensatory plantation of many road side trees; (f) cement road construction projects leaving stressed vegetation along its course.
Figure 16.
Roads of Nagpur city. (a–c) Avenue plantation along the major roads; (d,e) metro construction work in progress leading to cutting and compensatory plantation of many road side trees; (f) cement road construction projects leaving stressed vegetation along its course.

Figure 17.
Zone wise distribution and share of different classes of public UGS (size of the circle is relative to the available public UGS present in each zone and normalized by the zone area).
Figure 17.
Zone wise distribution and share of different classes of public UGS (size of the circle is relative to the available public UGS present in each zone and normalized by the zone area).


Table 1.
Supporting data used during thematic mapping of public urban green space (UGS) (governing bodies in Nagpur city).
Table 1.
Supporting data used during thematic mapping of public urban green space (UGS) (governing bodies in Nagpur city).
| Sn. | Data | Data Source |
|---|---|---|
| 1 | NMC-City Boundary | NMC * |
| 2 | Zone Boundaries | NMC |
| 3 | Ward Boundaries | NMC |
| 4 | Land use Map | NMC |
Note: * NMC—Nagpur Municipal Corporation.
Table 2.
UGS classes used in the thematic map.
| Sn. | Public UGS Typology | Green Space Classes | Remark |
|---|---|---|---|
| 1 | Recreational UGS | Parks and garden | Direct and indirect recreation |
| Playground | |||
| Lakes | |||
| Forest | |||
| 2 | Open UGS | River | Currently degraded and serves as sewer channel but has an ambitious rejuvenation plan for future recreational corridor |
| 3 | Public institutionalized GS | Government institutions | Restricted access but are important and influential presence in urban set-up |
| Government campus (housing and offices) | |||
| 4 | Infrastructure and utility corridor | Road network | Mapping of green spaces not done however form important part of networking various green spaces |
| 5 | Vacant land | Vacant land in the peripheries | Vacant plots under residential land use which are subject to change |
Table 3.
Categories of parks as per the Urban and Regional Development Plan Formulation Implementation (URDPFI) guidelines.
Table 3.
Categories of parks as per the Urban and Regional Development Plan Formulation Implementation (URDPFI) guidelines.
| S. No. | Category | No. of Parks Required Unit | Unit Area in Ha |
|---|---|---|---|
| 1 | Sub-city | 1 for 1,000,000 population | 100 |
| 2 | District | 1 for 500,000 population | 25 |
| 3 | Community | 1 for 100,000 population | 5 |
| 4 | Neighborhood | 1 for 15,000 population | 1 |
| 5 | Housing area | 1 for 5000 population | 0.5 |
Table 4.
The details of different attributes added to the digital polygon in ArcGIS.
| Attributes | Classification | Data Source |
|---|---|---|
| Zone | 10 zones (Zone1, Zone2, Zone3, Zone4, Zone5, Zone6, Zone7, Zone8, Zone9, Zone10) | Local authority |
| Ward | 136 wards (1,2,3,4 up to 136) | Local authority |
| Land use | Recreation, Waterbodies, Forest, Public-semipublic, Vacant land, Transportation | Land use plan |
| UGS Classes | Parks and Garden (1), Playground (2), Lake (3), Hills (4), River (5), Vacant land (6), Institutional Open space (7), Road network (8) | Derived from land use plan |
| Ownership | NMC, Governing Body, Forest Department | Land use plan and local authority |
| Vegetation | No, Scrub (low)-Peripheral, Sparse (low-medium)-Manicured, Coarse (medium-high) | Author (field observations) |
| Scale | Housing area, Neighborhood, Community, District, Sub city | URDPFI guidelines |
| Access | Limited, Restricted, No, Open, Paid | Author (field observations) |
| Name | Given | Local authority |
| Maintenance | Maintained, Not maintained | Author (field observations) |
| Area | Area in hectares | ArcGIS (calculate geometry tool) |
The attributes for administrative boundaries was added referring to added spatial data about zone and ward boundaries in GIS. The land use, UGS class and ownership was classified following the land use map. The vegetation, access and maintenance data were derived from the notes taken during the field survey conducted from 24 February to 10 April 2018.
Table 5.
Pivot table showing the kappa coefficient of the thematic map using a confusion matrix (the columns represent the reference data (truth points), the rows represent the raster map values (predicted) and the diagonal represents the correct matches and the remaining as mismatches).
Table 5.
Pivot table showing the kappa coefficient of the thematic map using a confusion matrix (the columns represent the reference data (truth points), the rows represent the raster map values (predicted) and the diagonal represents the correct matches and the remaining as mismatches).
| Reference Data or Ground Truth Classes | |||||||
|---|---|---|---|---|---|---|---|
| Classification | Parks and Garden | Playground | Lake | Forest | River | Row Total | User’s acc. |
| Parks and garden | 77 | 0 | 0 | 0 | 0 | 77 | 100% |
| Playground | 0 | 74 | 0 | 0 | 0 | 74 | 100% |
| Lake | 3 | 0 | 8 | 0 | 0 | 11 | 73% |
| Forest | 2 | 1 | 1 | 8 | 0 | 12 | 67% |
| River | 2 | 0 | 0 | 0 | 16 | 18 | 89% |
| Column total | 84 | 75 | 9 | 8 | 16 | 192 | |
| Producer acc. | 92% | 99% | 89% | 100% | 100% | ||
| Overall acc. | 95% | ||||||
| Points sampled (n) | 192 | ||||||
| Kappa coefficient | 93% | ||||||
Table 6.
Categories of parks as per URDPFI guidelines (the individual categories are shown in following section with area details and number of counts under each category).
Table 6.
Categories of parks as per URDPFI guidelines (the individual categories are shown in following section with area details and number of counts under each category).
| Sn. | Category | Count (Parks and Garden) | Area in ha (Parks and Garden) | Count (Playground) | Area in ha (Playground) |
|---|---|---|---|---|---|
| 1 | Sub-city | 1 | 50.00 | - | - |
| 2 | District | 2 | 31.00 | 2 | 22.00 |
| 3 | Community | 45 | 89.00 | 39 | 44.00 |
| 4 | Neighborhood | 46 | 33.00 | 76 | 53.00 |
| 5 | Housing area | 85 | 30.00 | 117 | 41.00 |
© 2019 by the authors. Licensee MDPI, Basel, Switzerland. This article is an open access article distributed under the terms and conditions of the Creative Commons Attribution (CC BY) license (http://creativecommons.org/licenses/by/4.0/).
Share and Cite
MDPI and ACS Style
Lahoti, S.; Kefi, M.; Lahoti, A.; Saito, O. Mapping Methodology of Public Urban Green Spaces Using GIS: An Example of Nagpur City, India. Sustainability 2019, 11, 2166. https://0-doi-org.brum.beds.ac.uk/10.3390/su11072166
AMA Style
Lahoti S, Kefi M, Lahoti A, Saito O. Mapping Methodology of Public Urban Green Spaces Using GIS: An Example of Nagpur City, India. Sustainability. 2019; 11(7):2166. https://0-doi-org.brum.beds.ac.uk/10.3390/su11072166
Chicago/Turabian StyleLahoti, Shruti, Mohamed Kefi, Ashish Lahoti, and Osamu Saito. 2019. "Mapping Methodology of Public Urban Green Spaces Using GIS: An Example of Nagpur City, India" Sustainability 11, no. 7: 2166. https://0-doi-org.brum.beds.ac.uk/10.3390/su11072166
Note that from the first issue of 2016, this journal uses article numbers instead of page numbers. See further details here.