MAS-Based Evacuation Simulation of an Urban Community during an Urban Rainstorm Disaster in China

1
School of Safety Science and Emergency Management, Wuhan University of Technology, Wuhan 430070, China
2
School of Management, Wuhan University of Technology, Wuhan 430070, China
*
Author to whom correspondence should be addressed.
Sustainability 2020, 12(2), 546; https://0-doi-org.brum.beds.ac.uk/10.3390/su12020546
Submission received: 9 December 2019
/
Revised: 3 January 2020
/
Accepted: 7 January 2020
/
Published: 10 January 2020
(This article belongs to the Special Issue Urban Disaster Risk Reduction)
Abstract
:The frequent occurrence of urban waterlogging constantly affects cities’ stability, bringing about a lot of economic losses and casualties. Coupled with the deficient rescue activities, waterlogging often exacerbates the impact of urban rainstorm disasters. By setting up a diverse distribution of shelters and various types of pedestrians, the evacuation route choice of pedestrians in an urban rainstorm disaster is simulated and analyzed through multi-agent system simulation. Then, clustering analysis is applied to discover population characteristics in different survival scenarios. The simulations for sustainable rescue after pedestrians reach the shelters are also carried out. It was found that the pedestrians’ herd mentality and the distribution of shelters have a significant impact on the success rate of post-disaster evacuation. The results could help pedestrians to make decisions in the evacuation. The wide scope of the shelters’ allocation facilitates the effect of disaster relief.
1. Introduction
An urban rainstorm disaster is generally caused by heavy rainfall or continuous precipitation beyond the urban drainage capacity [1]. China has a large population with a high crowd density in public areas and living communities [2]. Many metropolises (such as Beijing, Wuhan, Guangzhou and so forth) in China have suffered severe urban waterlogging (which is the seeper phenomenon often caused by urban rainstorm and frequently happens in many big cities, especially in the developing countries). Road waterlogging has a great influence on residents’ daily lives and traffic safety, and can even lead to casualties [3]. Evaluation of evacuation difficulties caused by rainstorm waterlogging disasters is of great significance to evacuation safety and emergency shelter needs [4]. Deficient rescue activities may cause a great loss of human resources and property during the emergency [5]. The 7/21 accident—rainstorm disasters occurred in Beijing, China on 21 July, 2012, causing 79 deaths and a great, direct economic loss of 11.64 billion RMB [6].Wuhan suffered from a rainstorm waterlogging in 6 July 2016, which caused over 8.7 billion RMB direct economic losses and affected about 1.13 million people’s living situation [7].
In order to protect human living environments from rainstorm disasters, rainstorm evolution models were constructed. The existing simulations of urban rainstorm evolution mainly focus on the application of the models, in which the representational urban rainstorm models are SWMM (Storm Water Management Model) [8], MOUSE (Model for Urban Sewers) [9], and FloodMap [10], etc. These models are mainly composed by hydrodynamic models [11]. The urban surface and drainage constitute a complex system. The principal problem in the application of models is the identification of various parameters with high quality requirements, which underlie these models [12]. Lots of parameter settings often lead to low modeling efficiency [13,14]. Multi Agent System (MAS) modeling for complex systems on rainstorm disaster risk assessment has produced outstanding effects [15].
The need to reduce evacuation time and to improve survival rate are vital factors in the evacuation process of urban waterlogging disasters due to rainstorm. Pedestrians in evacuation under waterlogging disasters are mainly affected by the external environment and the psychological state of the evacuated personnel [16]. Some shelter factors affecting pedestrians’ shelter-seeking behavior are the pedestrians’ own determination, family values, and so on [17,18]. The main elements of the conscious decision to seek shelter are a personal awareness of dangers and a personal understanding of the level of obtained information [19,20]. In order to explore the evacuation behavior of the pedestrians, computer-aid scenario analysis was applied [21]. The crowd evacuation simulation model established by researchers can be divided into the following two categories:
• Macro perspective
In macro perspective, the crowd is often considered a fluid or a dynamic potential field [22,23,24]. The first systematic theory of pedestrian flow was proposed in 1958 [25]. After first mature fluid continuous model was proposed [26], human flow could be regarded as a fluid for simulation. By taking into account pedestrian awareness, the expected speed of the pedestrians and their interaction with the pedestrian fluid dynamics model was established and reproduced the actual pedestrian flow phenomenon [27]. A theoretical framework for the continuous equilibrium distribution model of pedestrian flow was proposed to compare the pedestrians as the fluid particle [28]. In the floor field models, a static and a dynamic one are introduced to pedestrian interactions to translate a long-ranged spatial interaction into an attractive local interaction [29]. There is an extended floor field CA (cellular automata) model to study the evacuation behaviors in the case of panic situations, which updated the basic rules of CA structure. Each pedestrian has its own dynamics, namely diffusion and decay [30]. And pedestrian simulation software was used to analyze the pedestrian movement time under different pedestrian traffic facilities by incorporating the O-D (Origin-Destination) flow matrix and the travel time functions of the nine classified pedestrian facilities [31] (including passageways, stairways in ascending direction, stairways in descending direction, escalators in ascending direction, escalators in descending direction, and walkways leading to the Automatic Fare Control (AFC) gate, platform, junction, or concourse).
• Micro perspective
In micro perspective, simulations have been adopted to model the behaviors of pedestrians in many different situations [32], such as evacuees escaping from a building [33], passengers moving in a rail station [30], and natural disaster management with several types of agent [34,35,36]. In addition, agent models are widely applied to study the behaviors of crowds in the process of evacuation [33,37,38,39,40] and work out how to improve the efficiency of evacuations [41,42].
Environmental factors still dominate the settings of simulation rules during pedestrians’ evacuation processes. Many settings ignored the influences of pedestrians and the type of strategy that can make more pedestrians survive. This paper focuses on the pedestrians’ choices of shelters and routes according to situational factors, such as the surrounding population and environmental risks when the urban rainstorm disaster occurs. In the simulation process, the attitudes of the pedestrians are discrepant, and the effects of the different distribution of shelters are discussed. The behaviors of pedestrians contain the evacuation choices and the interactions among each other. In emergencies, the choices could result in various behaviors and distinct effects. In the meanwhile, the simulations, often without parameter settings, could evolve into a variety of emerging situations and behavioral results, which is subtly different from a conventional behavioral study. The results tell pedestrians when to follow the crowd and when to act alone in an evacuation after an urban rainstorm has occurred. Some suggestions for the most effective shelter distribution are given to disaster relief departments in the simulations of a sustainable rescue after pedestrians have entered the shelters.
2. Research Method
2.1. Simulation Methods
The emergency evacuation during an urban rainstorm involves the interaction and decision-making of a large number of pedestrians. It is a complex, adaptive system [43]. The key issue to obtain the pedestrians’ evacuation route in urban waterlogging is how to set the experimental process. It is unfeasible to simulate in real life because one experiment can not mobilize the number of people required to fill actual shelters. And participants will not act in the ways observed in real life without some strong motivations provided by the experimenter [44]. Computer simulations are therefore used to design simulations in order to reduce damage to buildings and participants, and to predict the impact of disaster situations.
The simulation technology based on a multi-agent is an effective method for studying the complex, adaptive system [45]. Agents are provided with perception capacities for their environment, means of action, and rules of decision. These allow them to select some of their current behaviors according to internal and external variables that are accessible to them [46]. MAS is often employed to investigate the distinctive behaviors of evacuees, including theoretical decision-making modes in complex situations [15].
2.2. MAS Modeling
Agent-based modeling and simulation require an available platform. There are many toolkits that can perform MAS simulation. The Swarm developed by the Santa Fe Institute, provides object-oriented libraries of reusable components for modeling and analyzing, displaying, and controlling experiments [47]. And the NetLogo designed by the Center for Connected Learning and Computer- Based Modeling, is a multi-agent programming language and modeling environment [48]. NetLogo overcomes the problem of the poor usability of the simulation framework, but it has no built-in calculation model. The Recursive Porous Agent Simulation Toolkit (Repast) is a free, open-source toolkit developed by Sallach, Collier, North, Howe, Vos, and others [49]. Repast inherited excellent compatibility and expansibility from JAVA. Repast focuses on modeling social behavior [50] and allows for more complex dynamic scheduling [51]. Repast Simphony (Repast S) extends the Repast portfolio by offering a new approach to simulation development and execution [52]. With Repast S, the technology of a geographic information system (GIS) can be applied to implement simulation to realize the modeling and simulation of intricate geospatial systems.
A small, virtual city model noted as RepastCity was developed to implement the simulation [53]. Therefore, repast S was selected for simulation.
A challenge for multi-agent simulation is combining real and simulated data. We can conduct artificial and real systems in parallel and apply adaptive control methods for the experiments [54]. Generally, features and subjects in simulation are abstracted as agents, respectively, like pedestrians, houses, roads, and water, in urban rainstorm evacuation. The characteristics and rules of these objects are as follows.
(1) Pedestrian
It is assumed that every pedestrian agent includes the attributes of speed, energy, information, and type. The characteristic features can be summarized as follows:
a. Herd mentality dominated
In general, when the crowd density is low, each agent will act according to the individual’s expectation through the perceived information and its current state. But with the population density rising, each agent will feel stressed, getting a little nervous, or even disoriented [22].
Once there is a clear trend in public information on evacuation, the pedestrians will follow the crowd [55]. Agents will have a tendency to explore the environment with other individuals because they are not in a shelter or near risks [46,56,57].
b. The minority prefer a lower crowd density
Still, there is a small number of pedestrians who won’t follow the herd. This type of pedestrian (the rebellious type of agent) may consider a variety of factors during the emergency evacuation process, and then choose the direction of escape. They often choose a route with fewer pedestrians for evacuation.
c. Route selection, combining dynamic and static methods
Starting points and shelter points are not unique because pedestrians do not start in concentrated locations initially. It is assumed agents know their initial positions but not that of the waterlogging points. Therefore, route planning adopts a combination of global (static) and local (dynamic).
Pedestrians at risk often choose one shelter as the destination according to the distance, replenishment capacity of the shelter, and the conditions of various safeguards [58].The probabilities of destination site selection for pedestrian agents are decided by distance and replenishment capacity, which are shown in Equation (1).
where represents the probability of the agents start from i and the destination is shelter j; is the replenishment capacity of shelter j; and represents the distance between the nodes i and j.
When an agent selects a shelter, the Dijkstra algorithm [59] is applied to obtain the shortest route to the shelter. Agents will go along with the initial route at first. Then, each agent has a certain probability, making a dynamic route selection every time it passes the intersection by the occurrence of risks and the density of crowds [60]. The judgment of an agent’s route is performed when the agent arrives at the intersection node and compares the data of the crowd density and the number of risks (waterlogging points). For different types of agents, the scoring model is employed, as shown in Equation (2) and (3).
For the following type agents:
They choose a route with a large number of people and a relatively small amount of waterlogging points.
For the rebellious type agents:
This type of agent is inclined to choose the route with a smaller number of people.
Where M is the co-occurrence amount of pedestrians on the route; r is the number of waterlogging points; a and b are the weighting coefficient for these factors, respectively. The evacuation route is made according to the direction of the intersection node, which has the highest value of S [61].
d. Different initial speed
Since the evacuation behaviors are strongly related to the circumstance, age, energy, and gender of the pedestrians [62], including the emotional fluctuations of men and women, the speed of the response of the young and the aged, and the personal tolerance of pedestrians. However, in order to broaden the scope of emergency behavior simulation in a disaster, the impact of the proportion of gender and age on the emergency behavior has not been set up clearly. Considering that the differences of pedestrians can be reflected in the initial energy levels, the different initial speed is set to be related to the initial energy.
Then, this simulation set the speed () as Equation (4):
where E is the initial energy of an agent, k is the weighting coefficient, the value of σ is set as a random value with a normal distribution.
e. Energy related to various factors
The residual energy of the pedestrian agents is related to various factors, as time consumption, the crowd density of each agent, and the energy consumed by wading through the waterlogging points. So, the energy is expressed in Equation (5):
where is an agent’s initial energy, is the walking time, α is fixed consumption per unit time, is the crowd density around each agent, and is the corresponding weighting coefficient. is the energy consumed by crossing the waterlogging points.
f. Crowd density affects information and speed
In the beginning, the density of the population is relatively low and each pedestrian will travel at the desired speed. When the crowd density increases, the speed of the movement of each agent in the crowd will decrease with the rising mental stress and the limited road space [63,64]. The speed of each pedestrian can be calculated using Equation (6):
where is used for representing the initial speed of each agent (as Equation (4) shows), and A is a coefficient, is the crowd density around each agent. From the above formula, we can see that even in the case of very high density, the speed will not be reduced to 0. When the density is 1 (only one person walks), the speed is the initial speed. This is consistent with the real data recorded, and also shows the rationality of the speed calculation method. Information would increase, as shown in Equation (7):
where I indicates the amount of information for each agent in each round, β is a coefficient, ρ is the crowd density around each agent.
g. Information is embodied in the loss of energy when wading through the waterlogging point.
The crowd constantly obtains information from peers and surrounding environments, such as crowd movement trends, the degree of risk, and the crowd density of the neighborhood. It has been demonstrated that evacuation time can be reduced by 10%–30% when evacuated pedestrians receive evacuation guidance [65]. Since agents obtain information from peers, they may learn some way to avoid risk and increase the information embodied in the loss of energy when wading the waterlogging point. Therefore, they cross the waterlogging points consuming less energy when they have more information.
where Er represents the energy consumed by each agent wading the waterlogging point in each round. I indicates the amount of information for each agent in each round, and is a coefficient.
The key variables about the pedestrian agents are summarized as Table 1:
(2) Waterlogging
Waterlogging agents have attributes of generation, time, and site. In view of the complexity of the urban rainstorm simulation, waterlogging points are the result of multiple factors, such as elevation, density of the rainstorm, and slopes [66]. Evaluation methods with GIS techniques can be combined to provide supporting information about the rainstorm, especially the geographical distribution of risk [67]. This paper mainly focuses on the pedestrians’ behavior in the rainstorm disaster, thus, the risks are refined to choices and possible dangerous locations, like waterlogging points in the simulation. As the simulation map comes from a small community (like a university campus), the geographical features of the community will change along with frequent reconstruction, such as road widening and building renovation. So, the geographical hydrological analysis is a type of risk distribution for reference.
(3) House
The property of the house agents is mainly the location, which is represented by the House class. The houses are two-dimensional graphics on the map. Each house has a central point representing its location. The starting point and destination of the personnel are the central points of the house [53].
(4) Road
The property of the road agent is mainly the location and road signs. Each road is represented by two points, which are represented by the Junction class. The main function of road signs and endpoints is to build an urban transport network, through which the shortest route connecting the two points can be easily found.
2.3. Interaction Rules
(1) Pedestrians’ risk aversion behavior rules
The functions, like the closet facilities, service area, shortest route, resource allocation in the GIS, have provided many technical supports for emergency management. [68]. But in real disaster scenarios of crowd behavior, these existing network analysis functions are often difficult to fully implement in the application of geographic topology into emergency management due to information asymmetry, crowd psychological diversification, and various behavioral patterns. An agent will choose the most suitable shelter before moving (Equation (1)). When an agent starts moving, it first selects the shortest route, which is implemented by the Dijkstra algorithm.
After the agent finds the nearest route, it will go along with the route. The agent operates with a certain probability that makes a route selection as it meets an intersection. Then, the route selecting probability considers the crowd density and the number of waterlogging points (as shown in Equation (2) and (3)).
Pedestrians consume their energy, according to the moving distance, as they are moving, and they also consume energy in spaces with a high crowd density. They receive additional energy loss when wading the waterlogging point. The pseudo code is as follows:
| E = E-at; |
| if (crowd density>1){ |
| E = E-k*crowd_density; |
| } |
| if (wading the waterlogging point){ |
| E = E-E(risk); |
| } |
When crowd density is high, pedestrian agents will reduce their speed but increase their information volume. This information will help them to reduce the energy consumed wading through waterlogging points. The pseudo code is as follows:
| if (crowd density>1){ |
| calculate speed in crowds; |
| calculate information volume; |
| calculate the energy consumed at waterlogging points; |
| } |
(2) Waterlogging point generation rules
In the hydrological analysis, waterlogging points diffuse according to spatial connection. Thus, a diffusion coefficient should be set for waterlogging point generation. The initial generation of waterlogging points comes from direct observations, topographic relief, and refined experience. The probability of generating a waterlogging point is negatively correlated to the distance from existing ones. The diffusion coefficient is variable since it could be rectified by a paralleling check, which means parameters could be reset and optimized along with real situations [69].
(3) Sustainable rescue simulation rules
The basic assumption of the simulations of survival in shelters is that there is a certain fixed replenishment within each shelter. After the crowd arrives at shelters, it first consumes the fixed replenishment of the shelter. When the energy of the shelter is fully consumed, agents consume their own residual energy. The pseudo code is as follows:
where is the replenishment capacity of the shelter j, as shown in Equation (1), Ek is the energy of each agent when it reaches the shelter.
| while (survivor >0){ |
| Ei = wj+Ek-E; |
| once when Ei<0 |
| calculate the number of dead pedestrians |
| } |
2.4. Simulation Scenarios
This simulation needs to explore the impact of pedestrian categories on survival, so that different pedestrian types can be set during the simulation. In each simulation, three shelters are set to be dense, dispersed, and scattered.
According to the bi-level location-allocation model for rainstorm evacuation planning with shelter capacity constraints [70]. Three buildings with a large capacity in densely residential areas have been set up as disaster shelters [71,72].
Scenario simulation requires the discretization of parameters. Assumptions for scenario settings are also required. In emergencies, pedestrians are inclined to follow the crowd [57]. So, in general, rebellious pedestrians are less than the following type. In the parameter discretization, the interval is set as 10%, so the ratios are 6:4, 5:5, 4:6, 3:7, 2:8, and 1:9. In each experiment, the survival proportion of each crowd is evolved. The shelters are distributed in three states: dense, dispersed, and scattered. The discretization strategy may lead to different scenarios, including massive overlapping scenarios. We use a conventional strategy of parameter discretization, which can cover the basic possible scenarios.
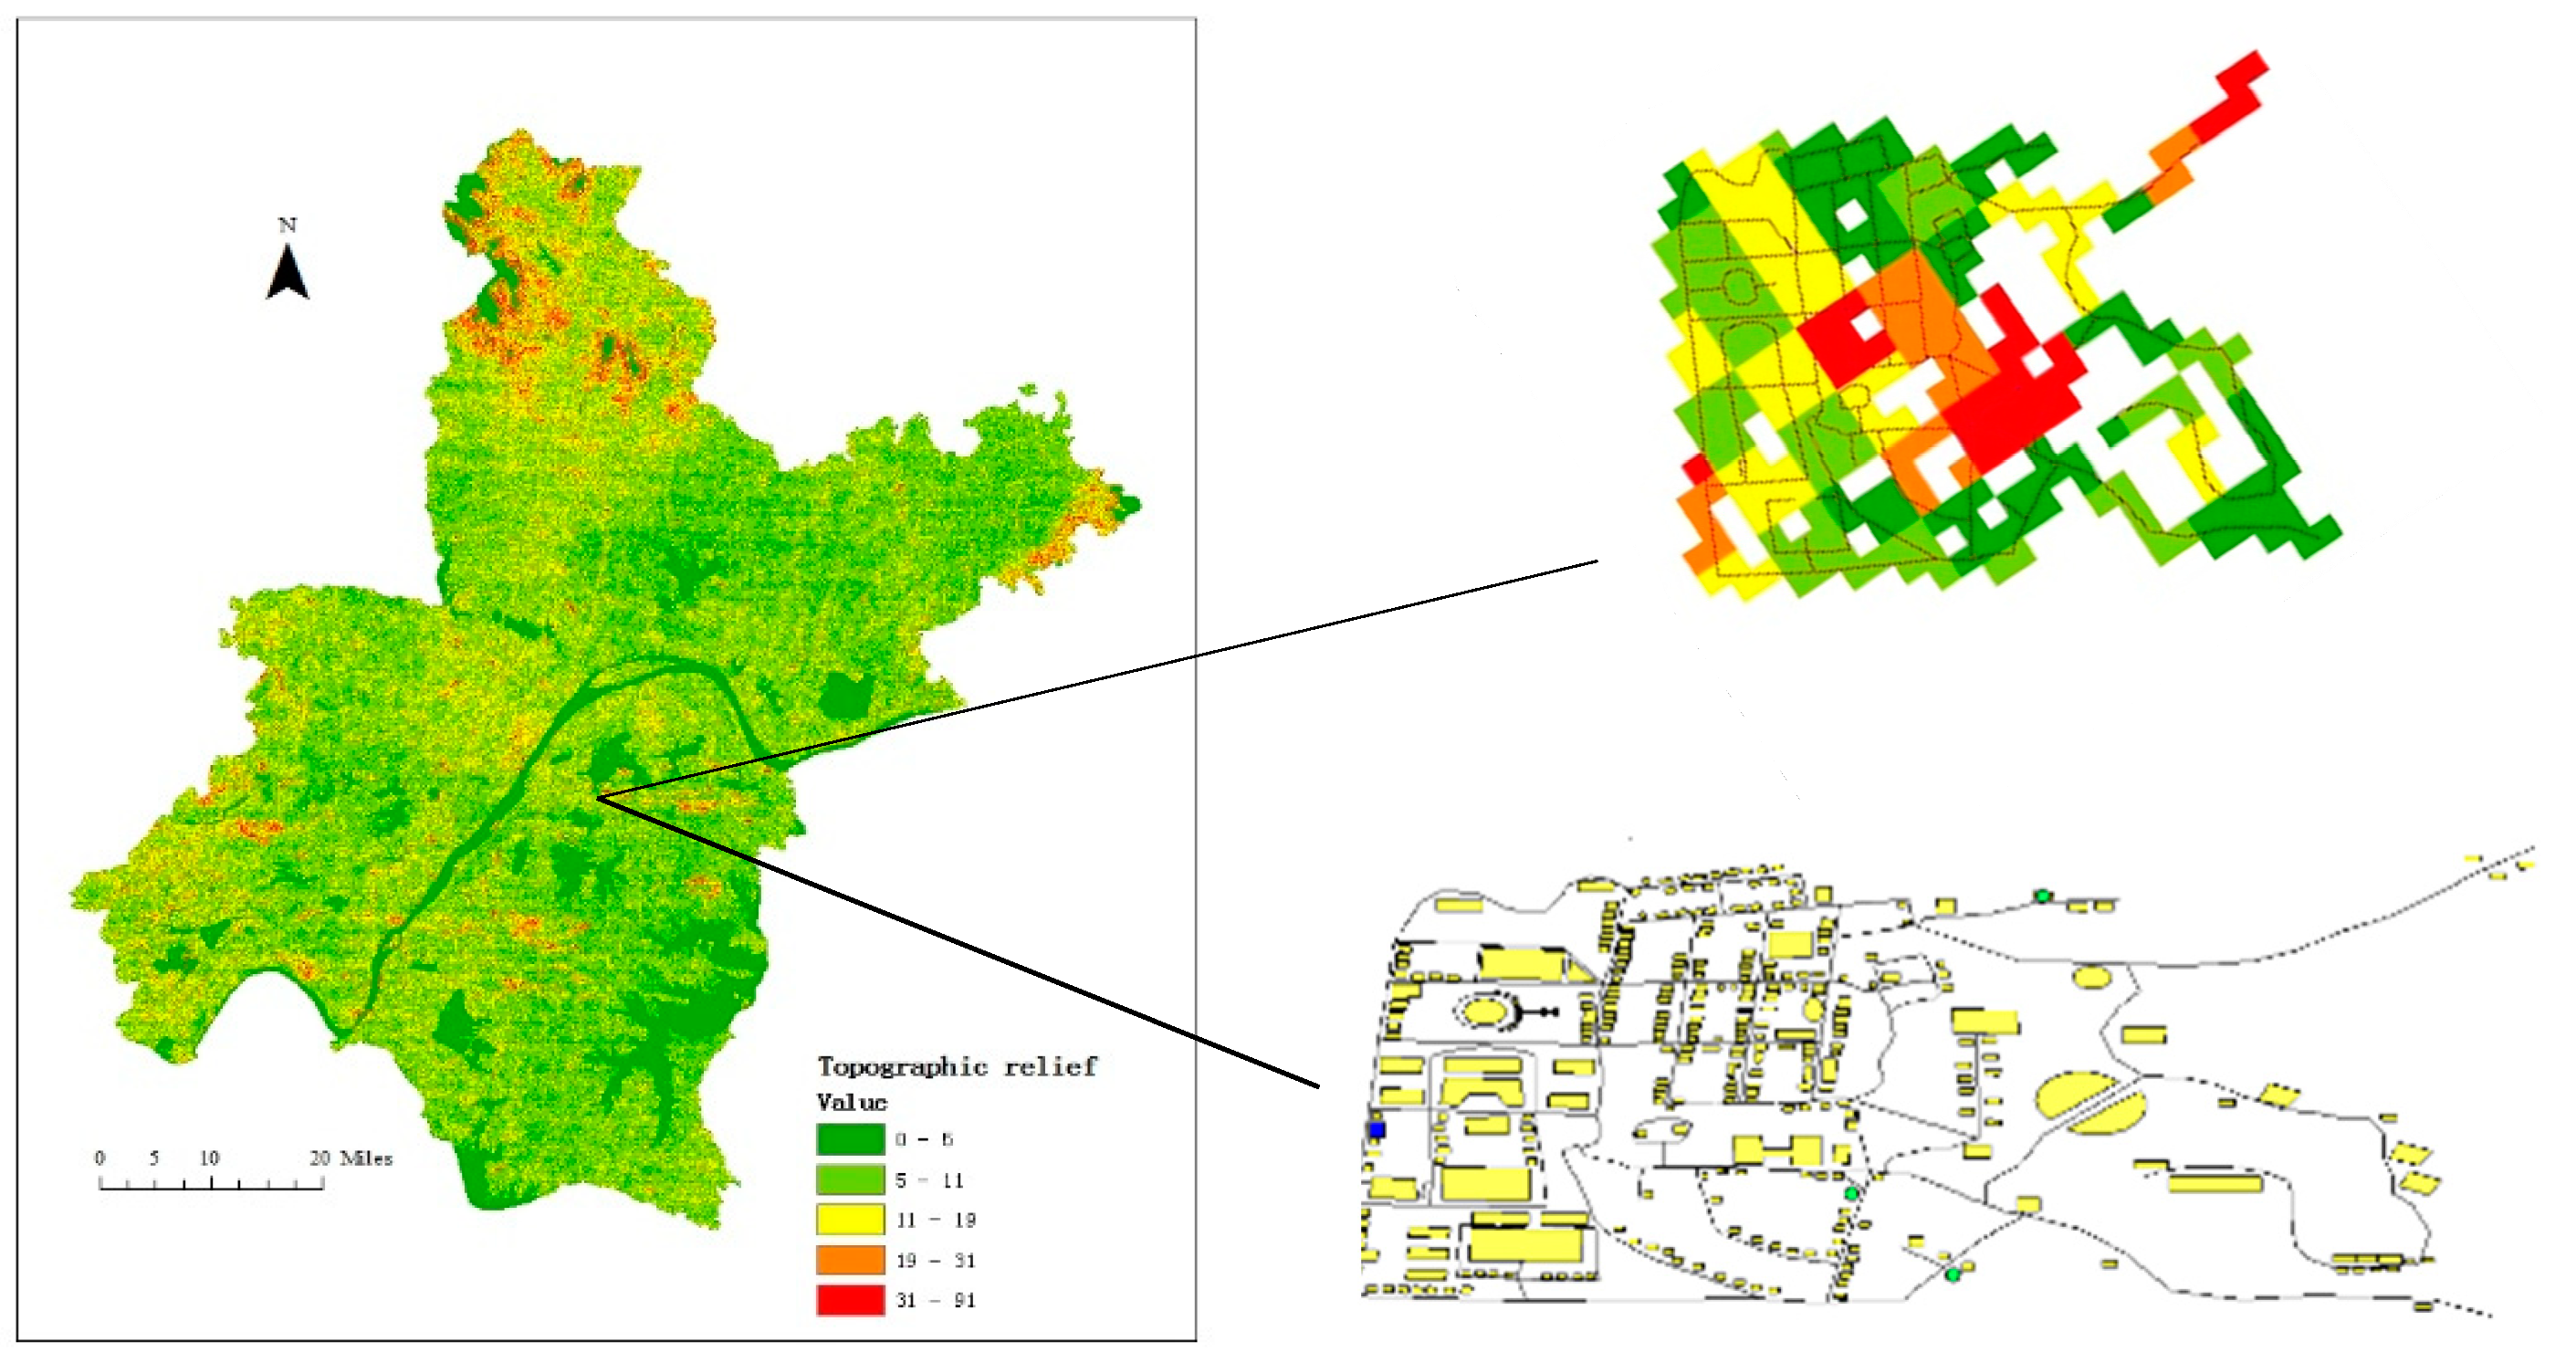
In the rainstorm evolution, waterlogging will gradually increase the range, depth and velocity. Therefore, it is more reasonable to find the location of waterlogging points according to the terrain features. This paper extracts 30 Meters DEM (Digital Elevation Model) of Wuhan through the geospatial data cloud (http://www.gscloud.cn/). The neighborhood analysis in ArcGIS (A complete mapping and analytics platform for developers, https://developers.arcgis.com/) is applied to obtain topographic relief (as shown in Figure 1).
Wuhan (29°58′~31°22′ N and 113°41′~115°05′ E) is the biggest city in central China, covering an area of 8569 km2. It has a population of over 11 million. In the pasts few years, the average annual rainfall in Wuhan was approximately 1200 mm.
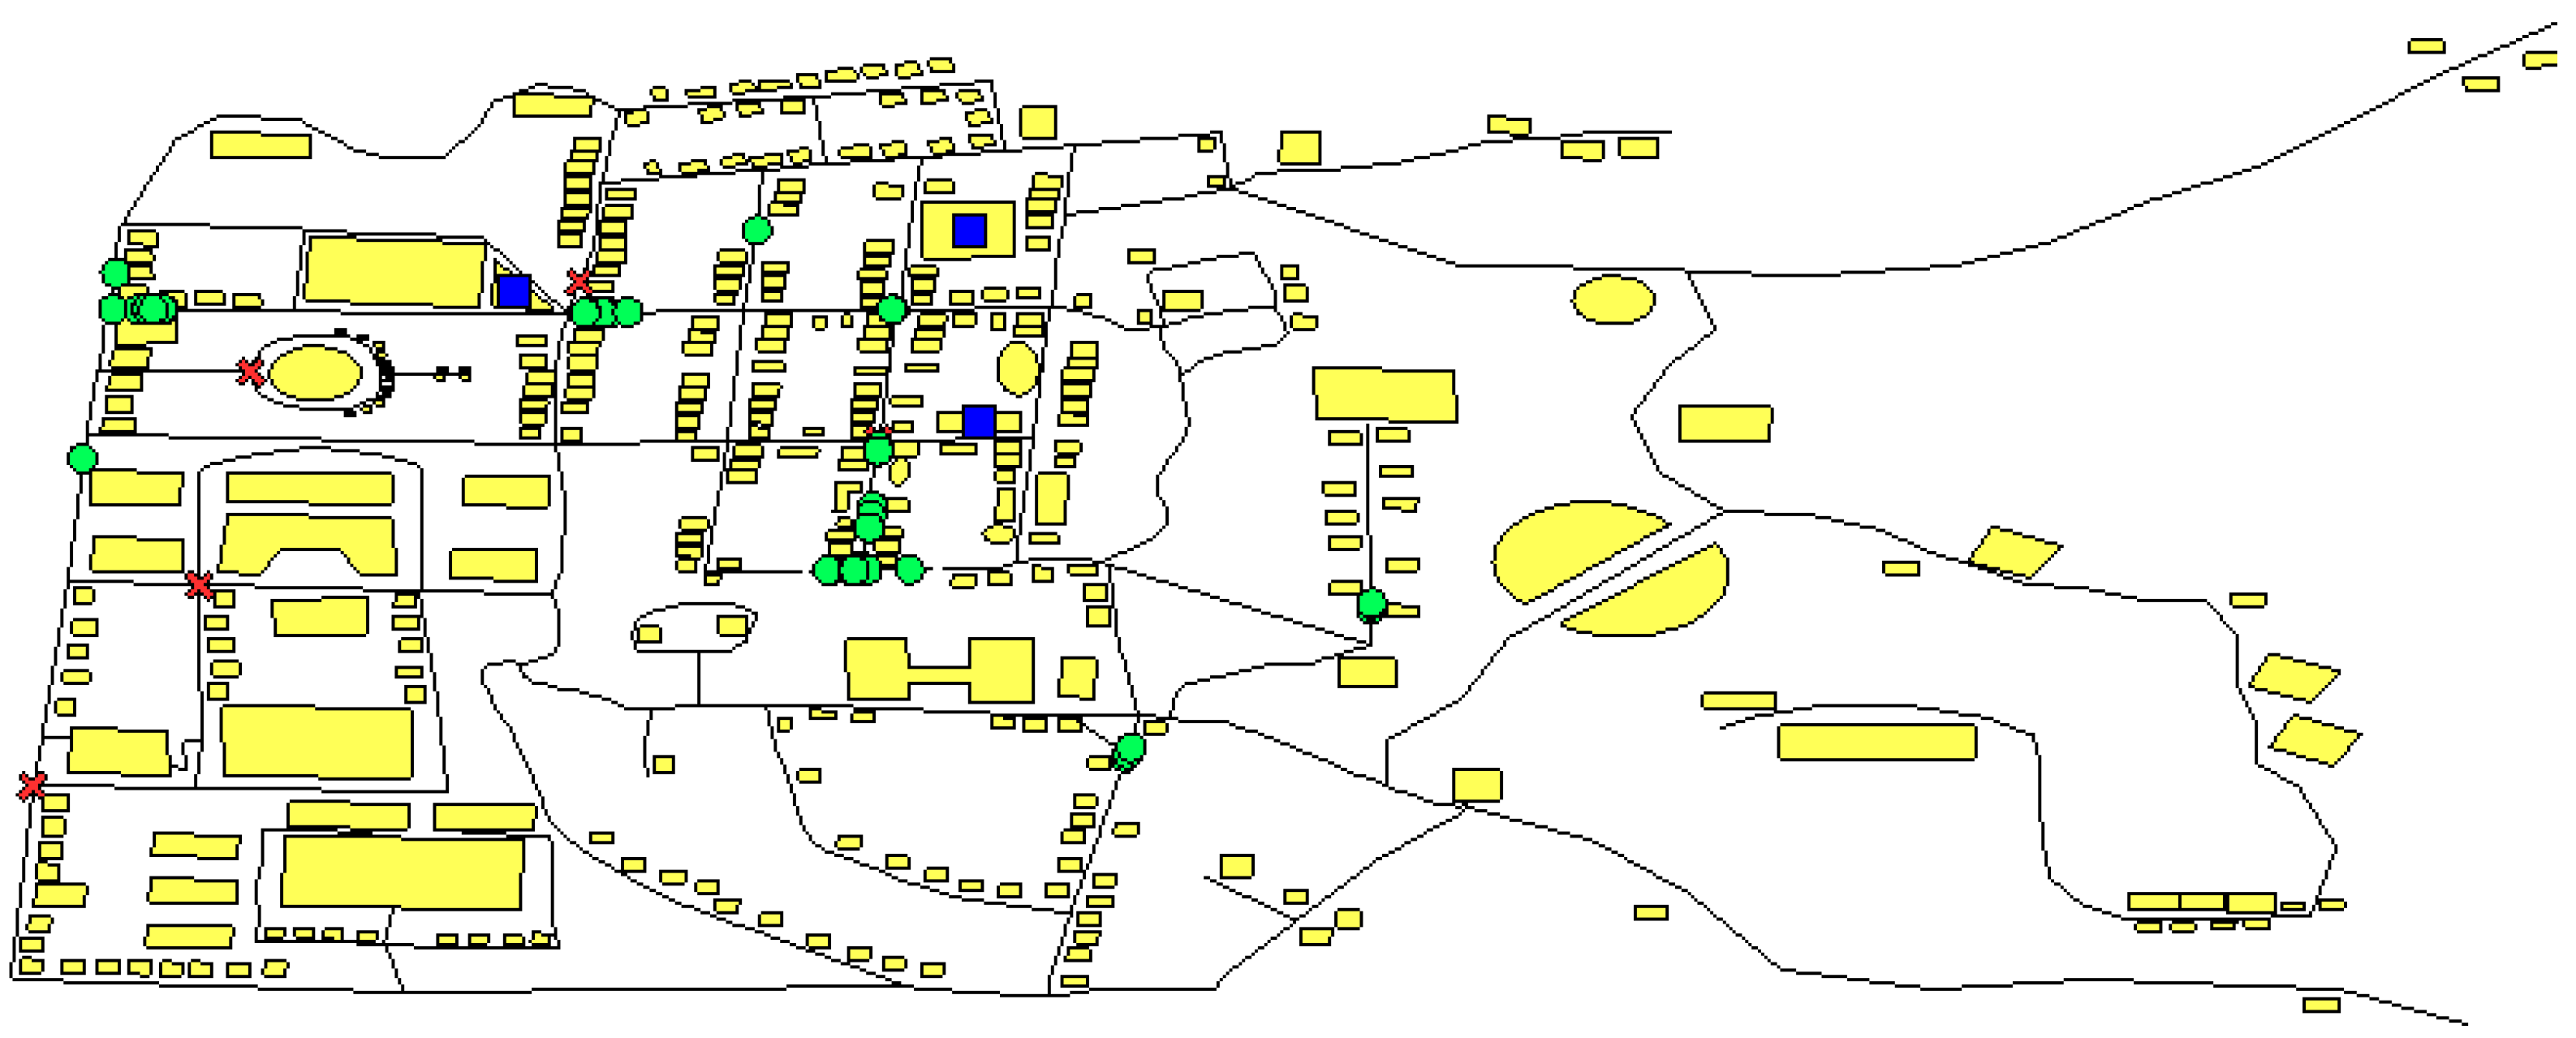
The left part and upper-right part are the topographic relief of Wuhan and the campus, which can be references to the locations of waterlogging points. The clear study area in the format of the geographic network is shown in Figure 2.
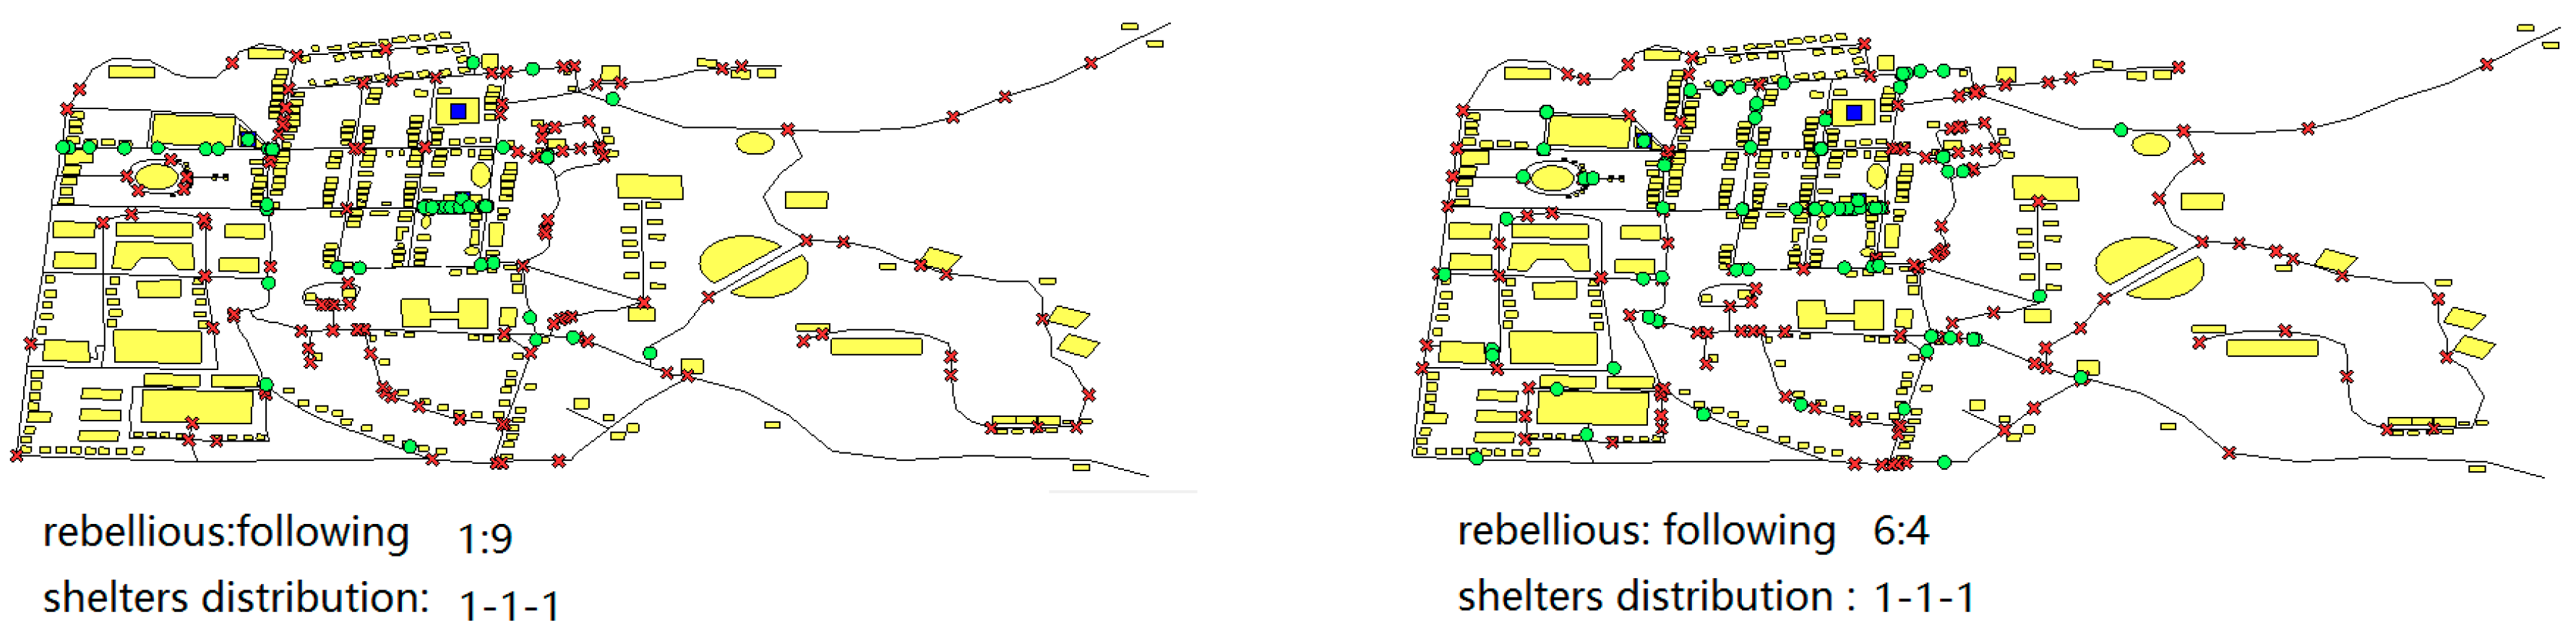
As Figure 2 shows, the yellow polygons in the figure are houses, from which pedestrians can leave, and some houses can also be selected as shelters. The lines represent the roads, the red crosses are the waterlogging points, the green dots are the pedestrians, and the blue squares are set as shelters.
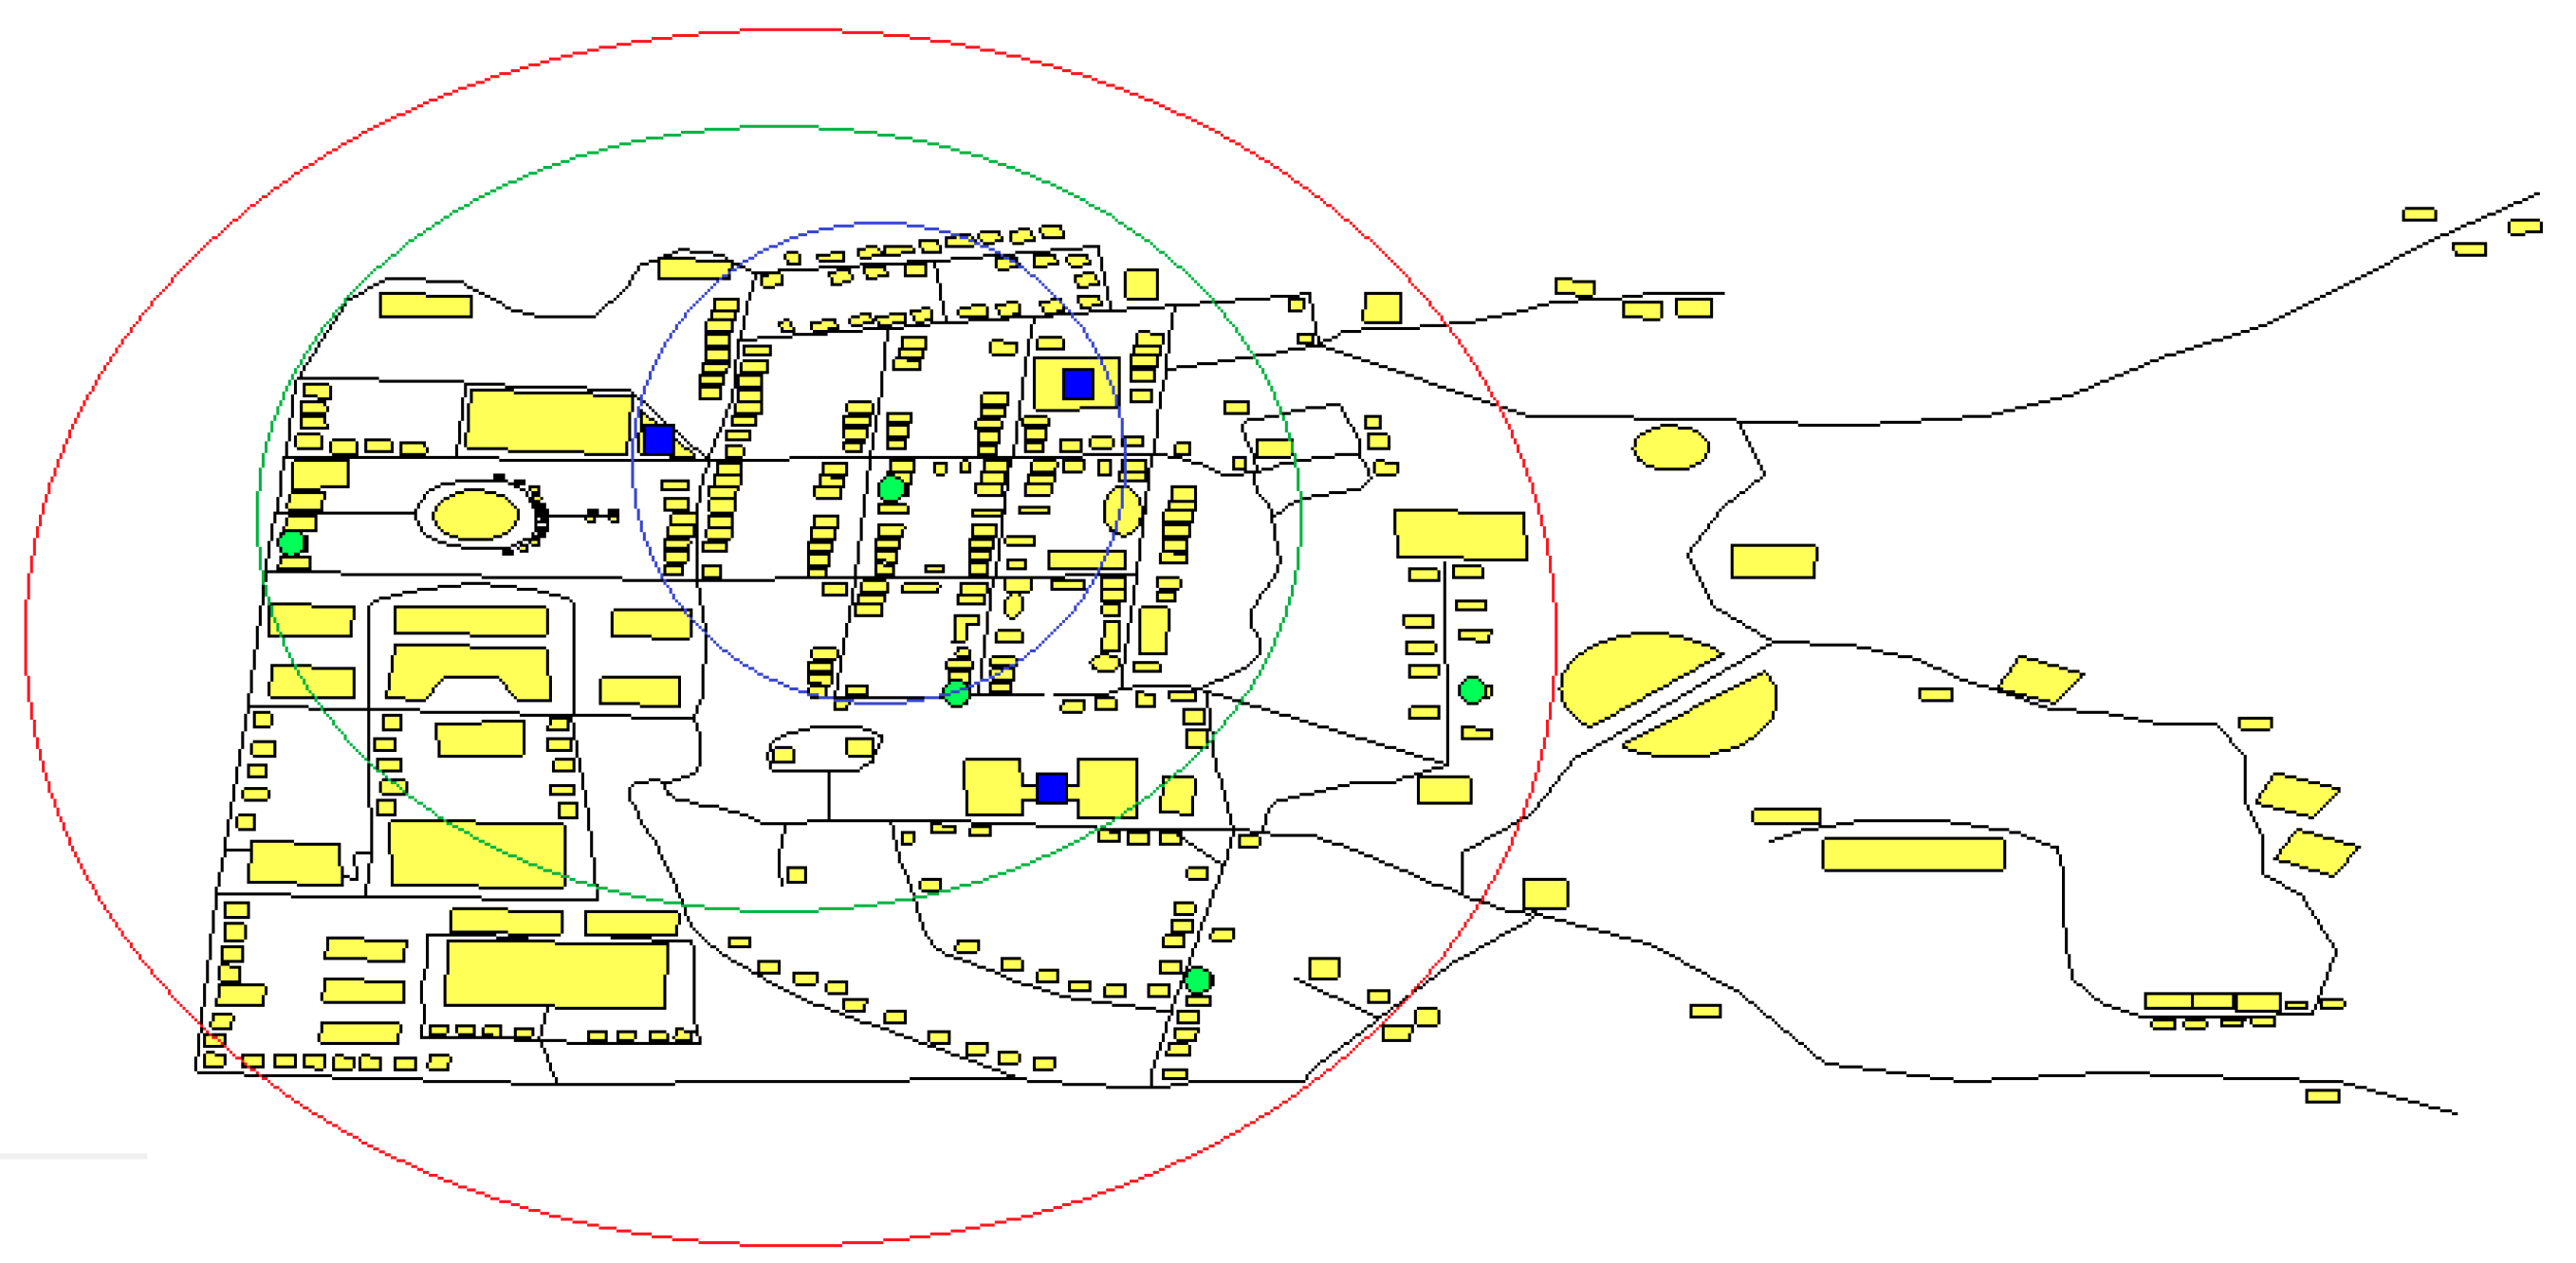
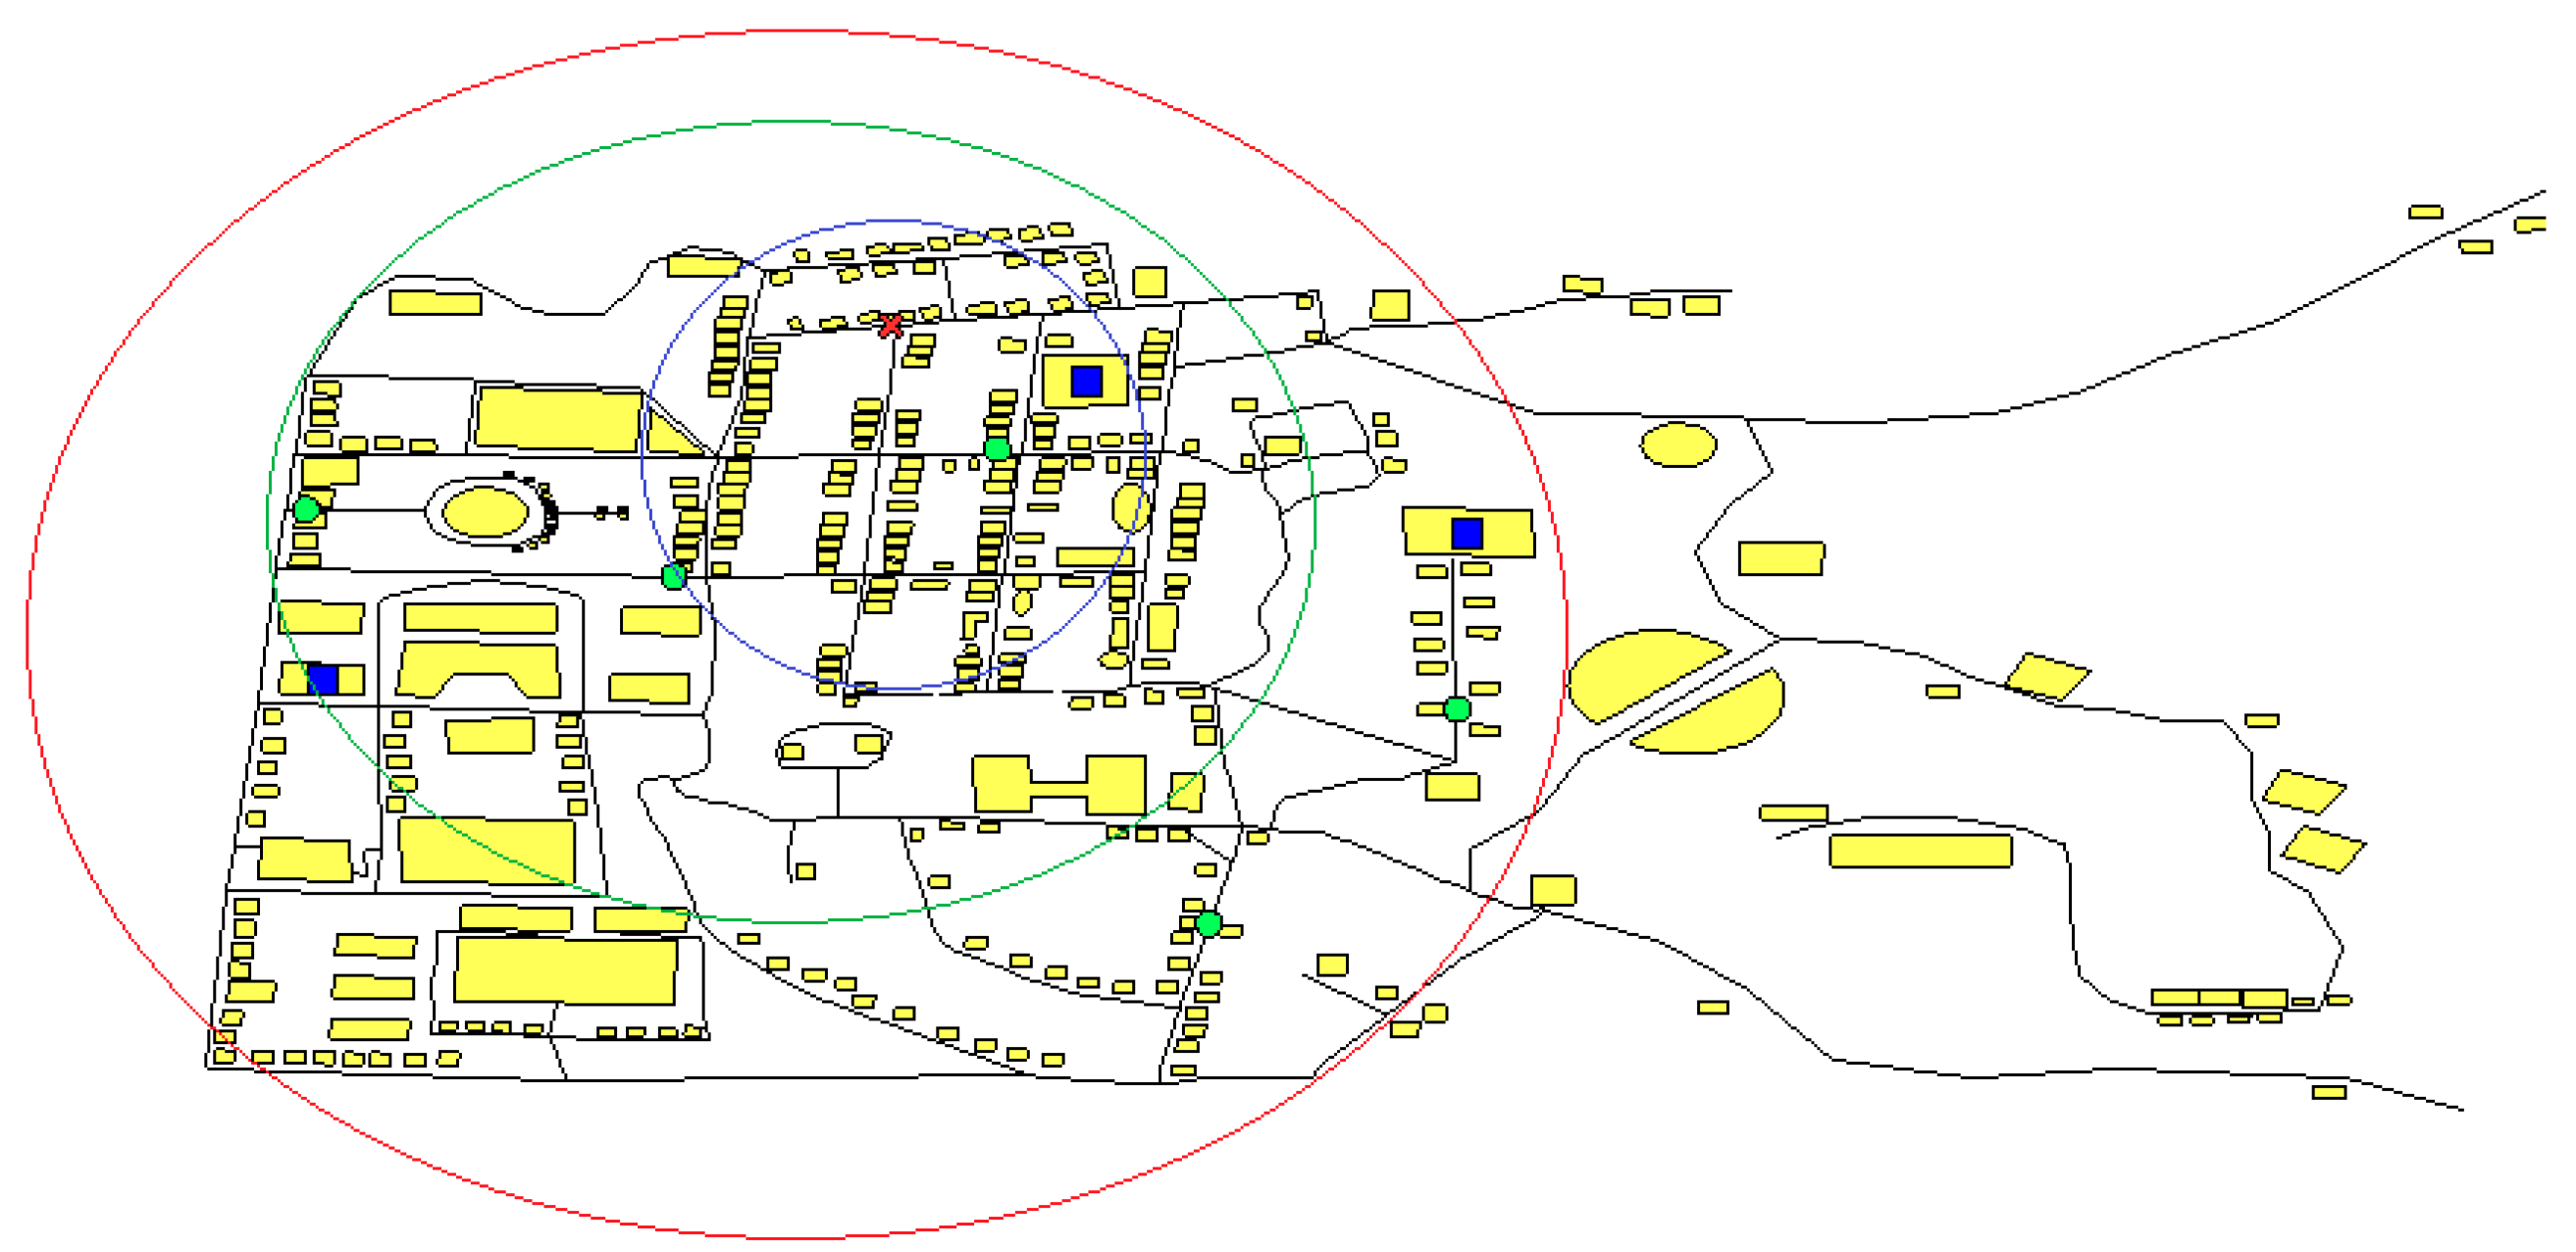
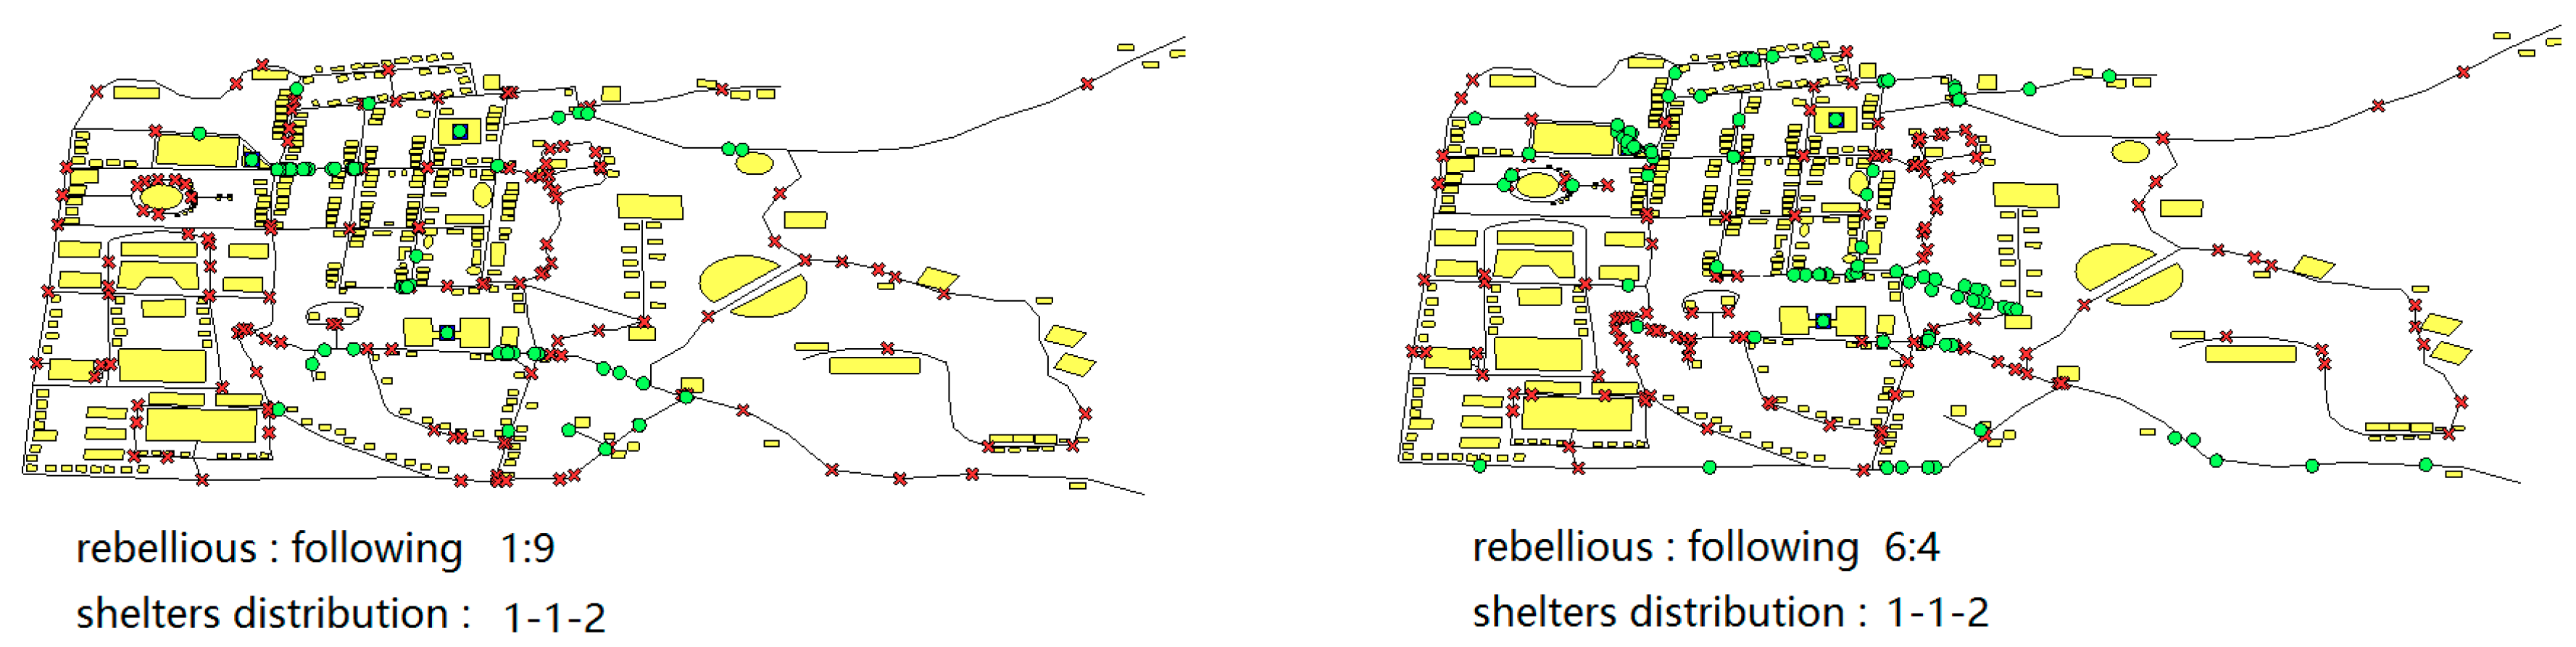
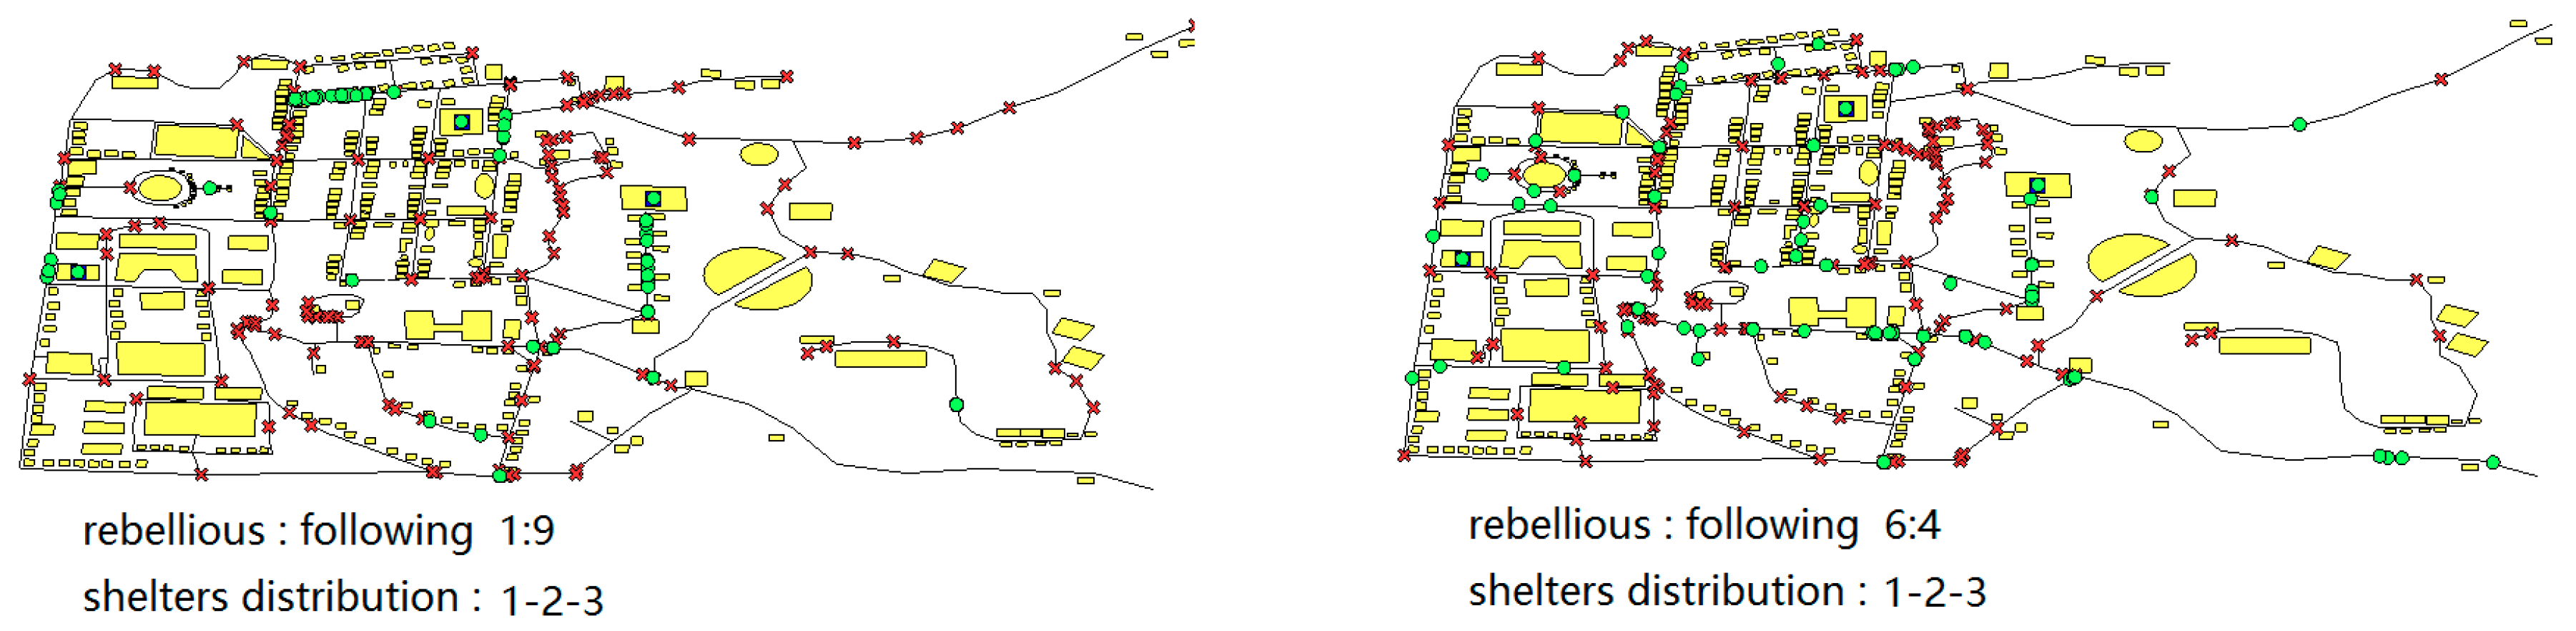
The experiments divide the shelters in different locations into three levels: level 1 is in the most densely populated area with the lowest replenishment capacity; level 2 is locations that depart from each other slightly where replenishment capacity is the medium; level 3 is the most decentralized layout in which the replenishment ability is the highest. In this experiment, the designed replenishment capacity can be noted as 1-1-1, 1-1-2, 1-2-3 corresponding to Figure 3, Figure 4 and Figure 5, respectively. The blue circle is the first-level shelter, the green circle is the second-level shelter, and the red circle is the third-level shelter.
In disaster emergencies, relief materials and rescue teams are often in short supply. To simulate scenarios with different emergency resource distribution, three levels of locations are set to illustrate the dispersion degree of shelters. The three shelters are the corresponding minimum required to simulate the actual situation of a disaster relief resources shortage, which could streamline the simulation process without much scope for the loss of possible scenarios.
3. Result and Discussion
3.1. Crowds Survival Analysis
When the distribution of shelters is different and the pedestrian categories are diverse, the simulations will have different characteristics. Simulations tested six types of pedestrian category ratios (rebellious type: following type), three different types of shelter distributions, and a total of 18 different situations. Only two extreme pedestrian category ratios (1:9 and 6:4) are shown here in Figure 6, Figure 7 and Figure 8.
It can be clearly seen in Figure 6, Figure 7 and Figure 8 that in the case of a larger proportion of the rebellious type, even if the destination is the same, it will show a more dispersed distribution. This phenomenon is most obvious when the shelters are scattered as Figure 8 shows. In the case of scattered shelters, it is very likely that many pedestrians will follow the crowds on the feasible route, and a group of pedestrians of both types may survive simultaneously. But sometimes crowds don’t find the feasible route consistently. However, agents are likely to fall into a local dilemma, in which finding a way to leave is relatively difficult, if all of them follow others. In the meanwhile, they waste energy at the same places. In this case, it is necessary for the rebellious agents to leave the current site to explore new routes, which are likely to bring agents a higher chance of survival.
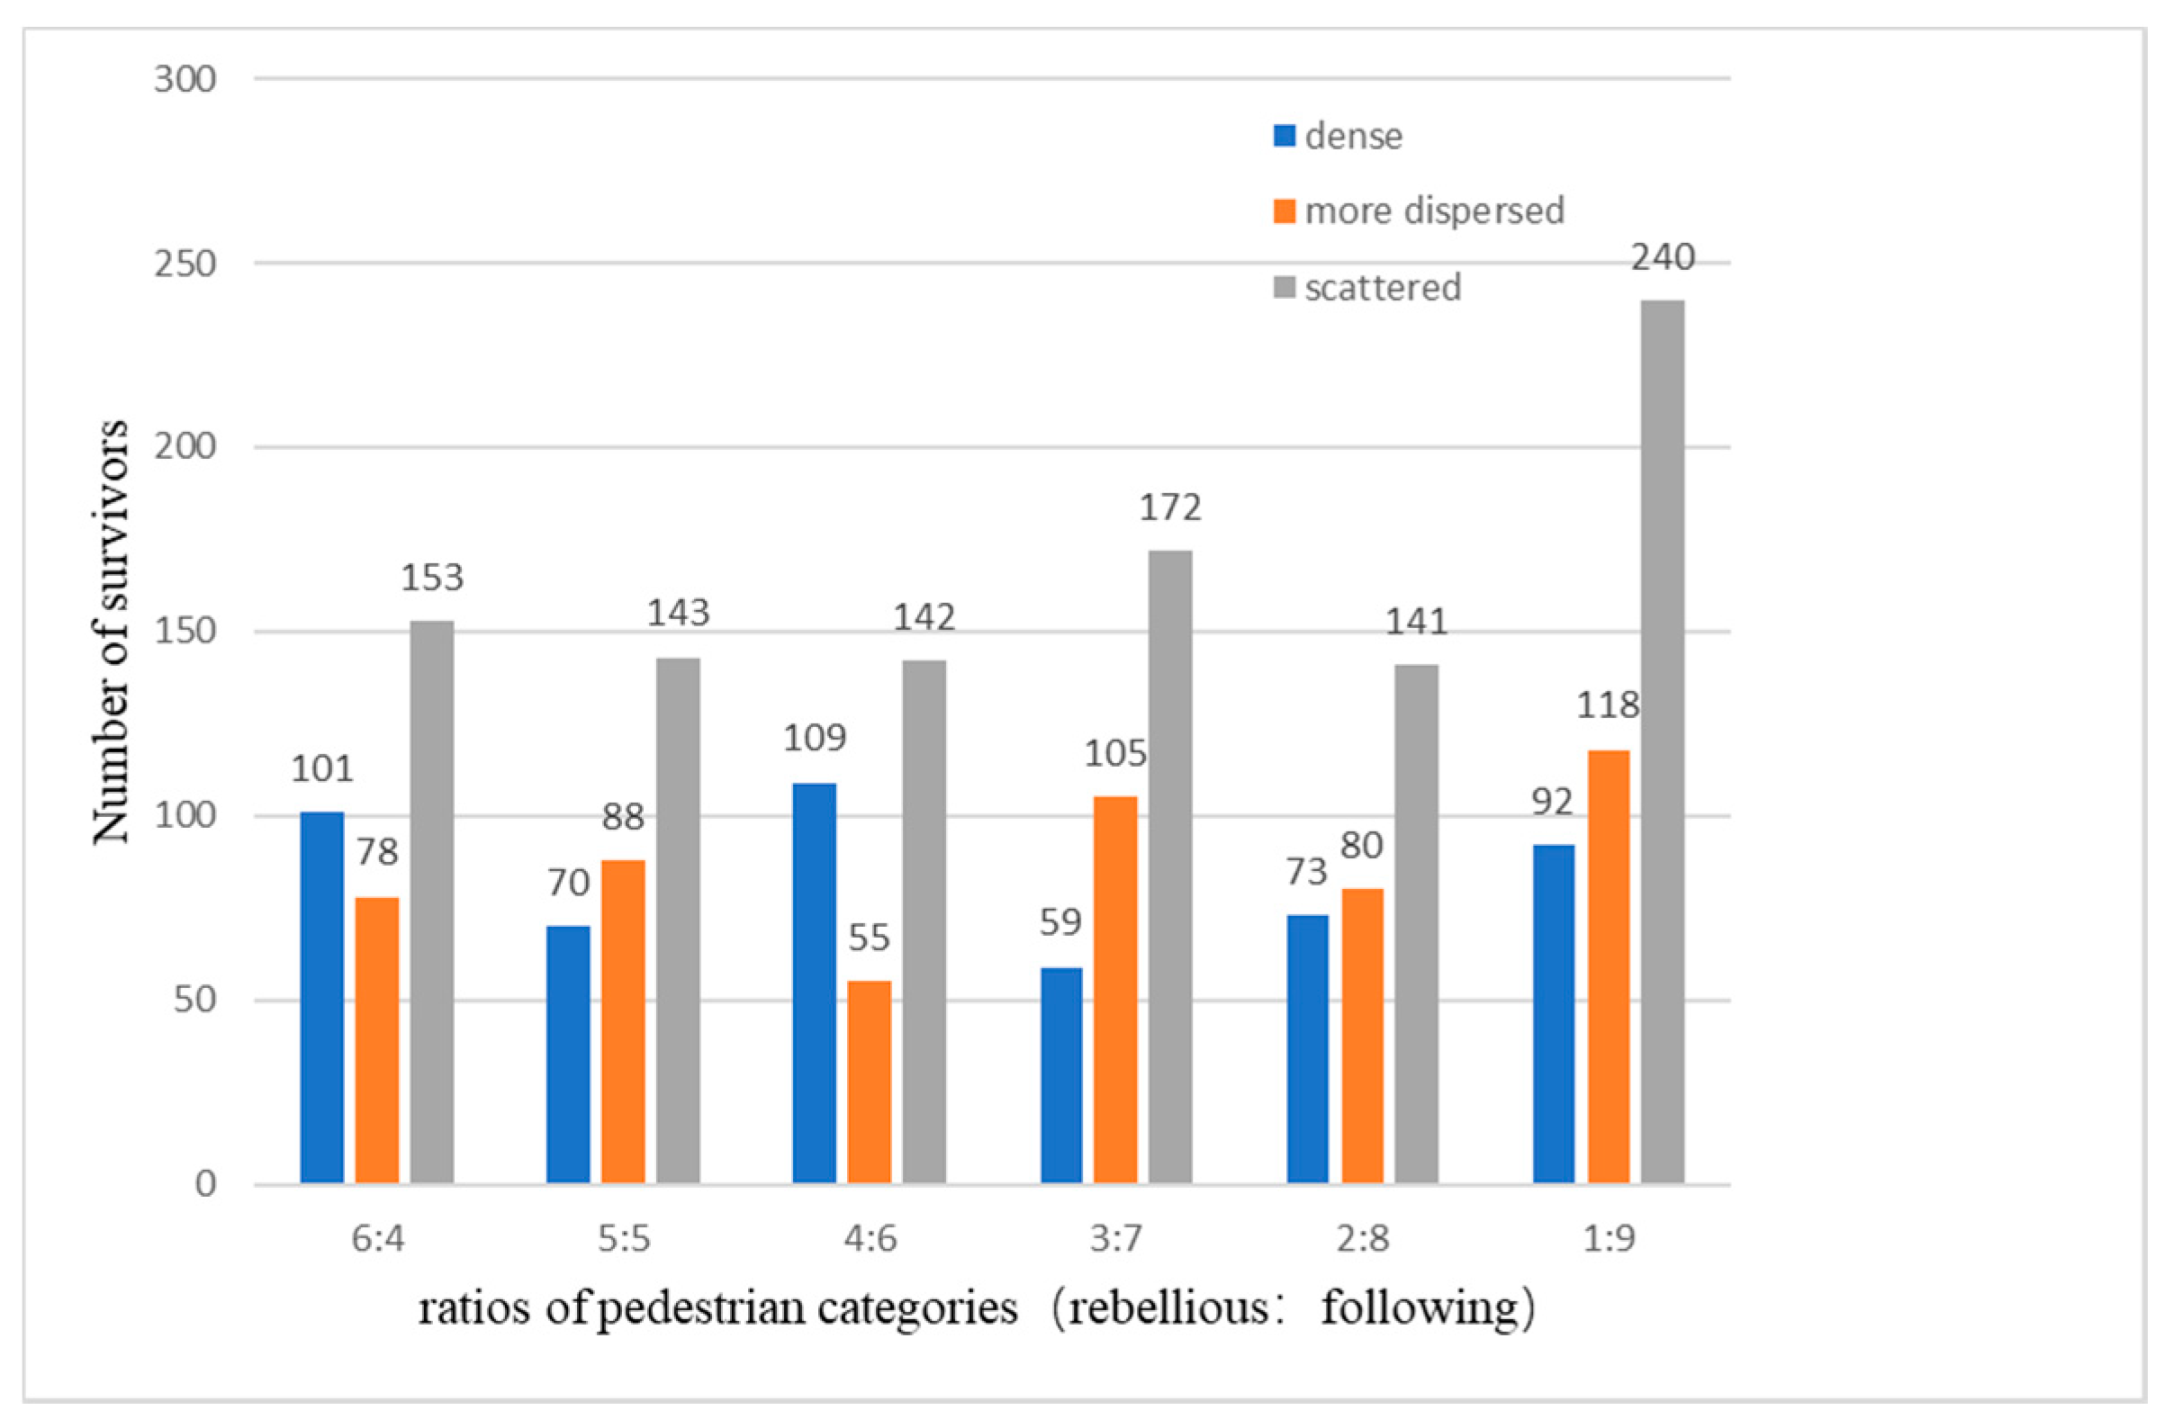
Figure 9 shows the influence on the number of survivors by different shelters’ distributions in diverse ratios of pedestrian categories. As Figure 8 shows, the scattered shelters will significantly increase the number of survivors when the ratio of pedestrian categories is fixed. The number of survivors in scattered shelters close to the sum of that in the other two distributions. The reason for this is that the scattered shelters will help the residents living in different areas to escape. Consequently, pedestrians from different areas don’t expend extra energy looking for a feasible route.
Table 2 shows the survival rates of the rebellious agents and the following agents under different conditions. It can be seen from Table 2 that the survival rates of the two types of pedestrians do not show much difference when the shelters distributed are 1-1-1 and 1-1-2 with different ratios of pedestrian categories. However, the survival rate of the following agents is significantly better than that of the rebellious agents when the distribution of the shelters is scattered (as 1-2-3). This feature is more prominent when the following agent accounts for a higher proportion of the pedestrians (as ratio is 1:9). This phenomenon results from the fact that, in the case of scattered shelters distribution, it is not easy to find the feasible route independently due to a lack of information on the rebellious agent. But once one of the following agents has found the shelter, it can help a big group of agents to survive.
3.2. Crowds Cluster Analysis
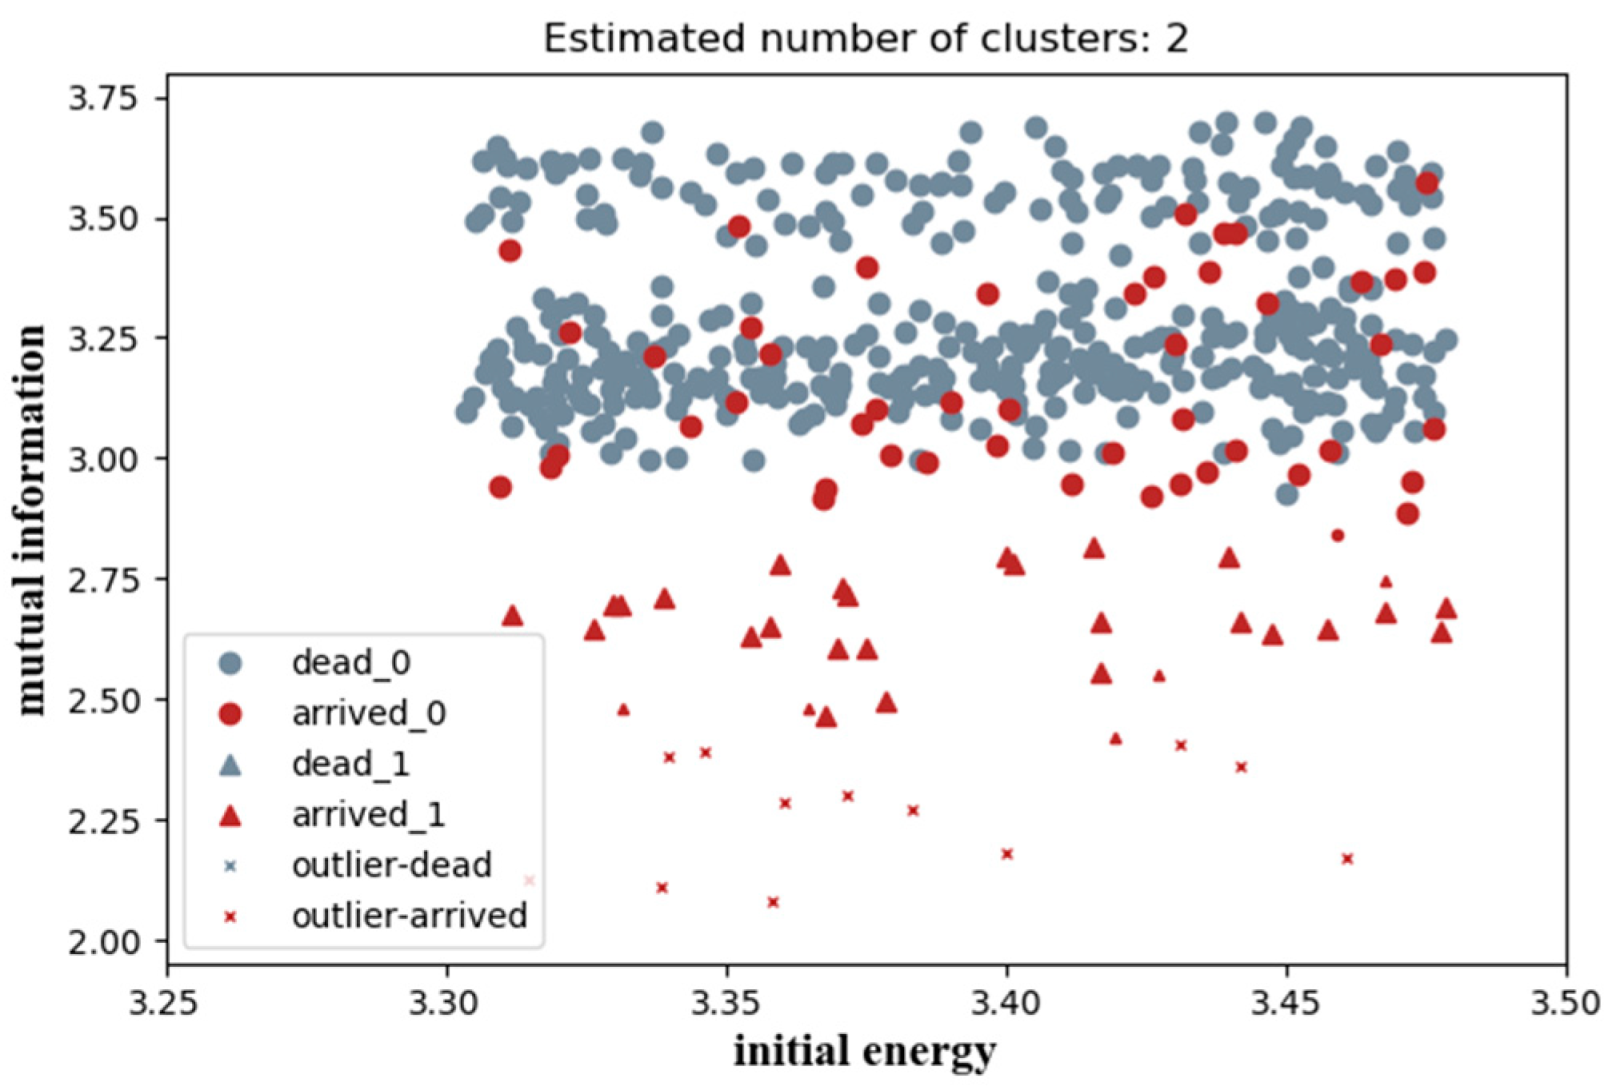
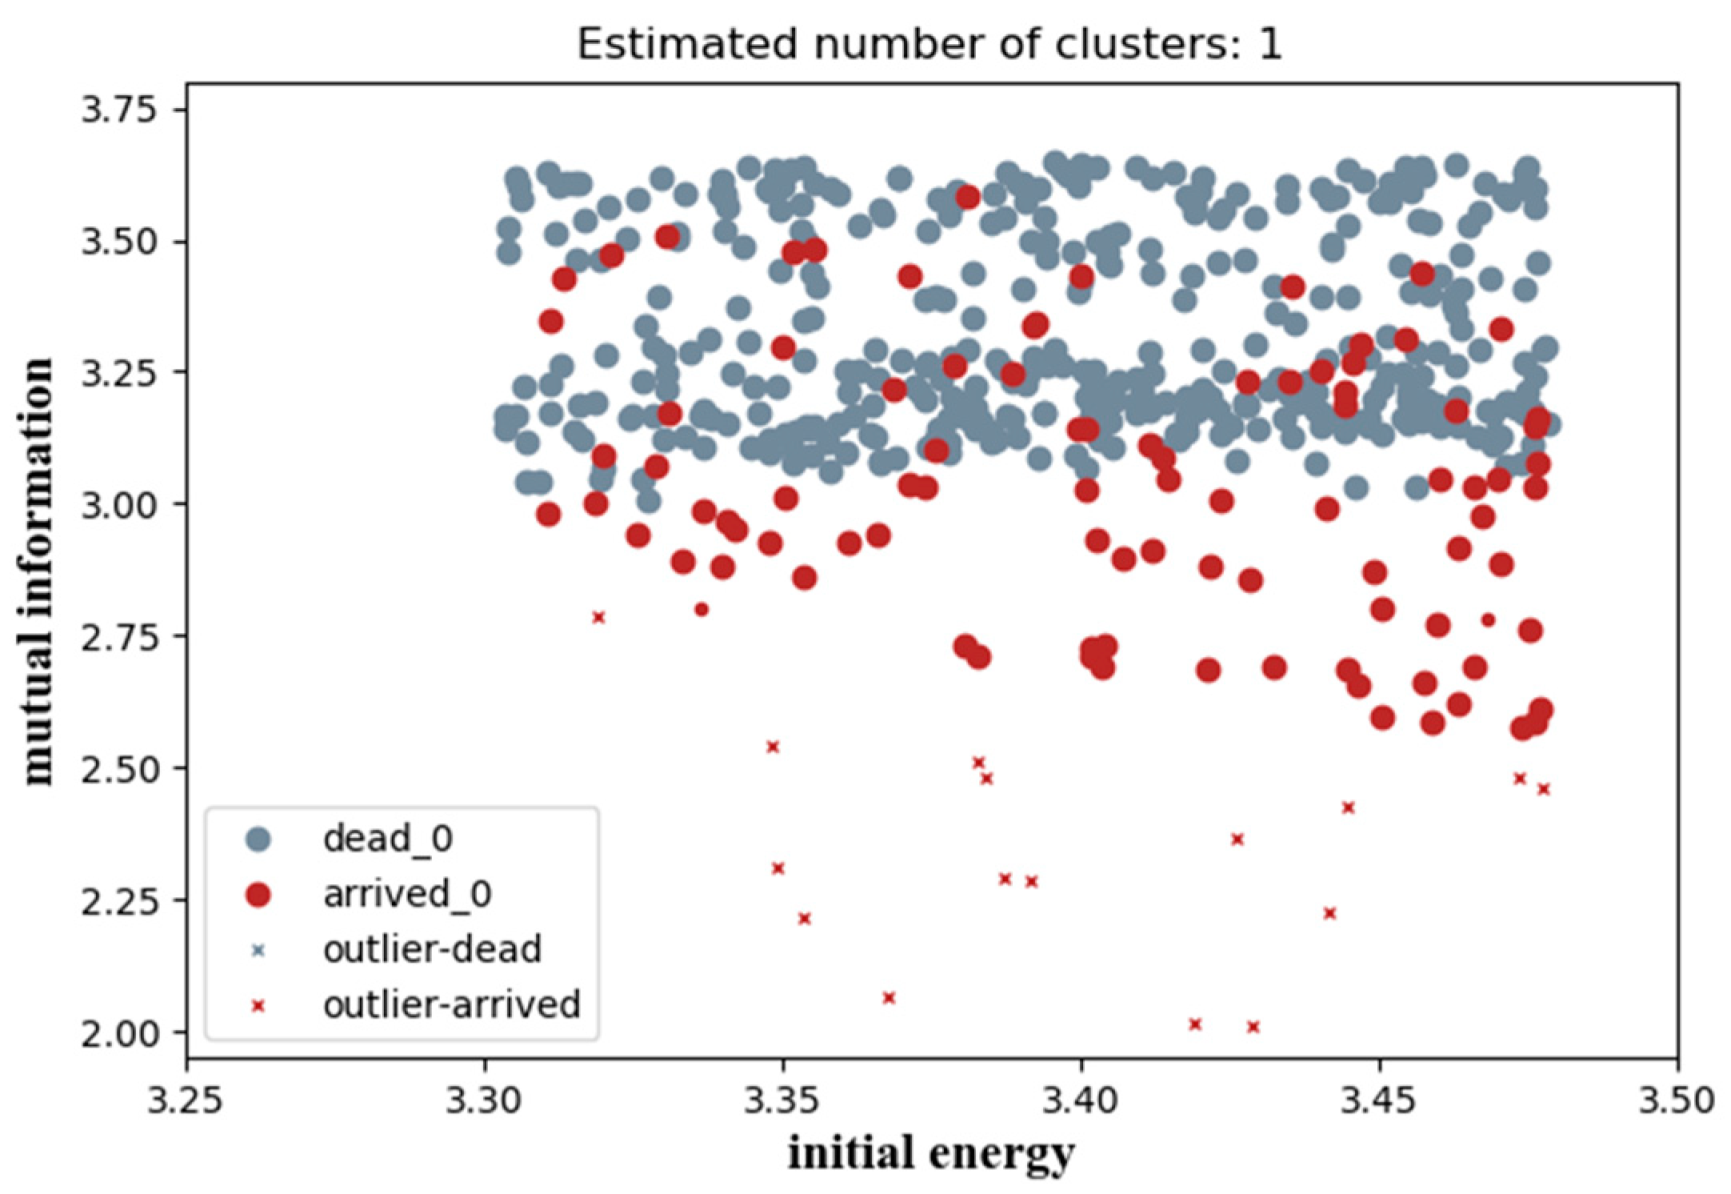
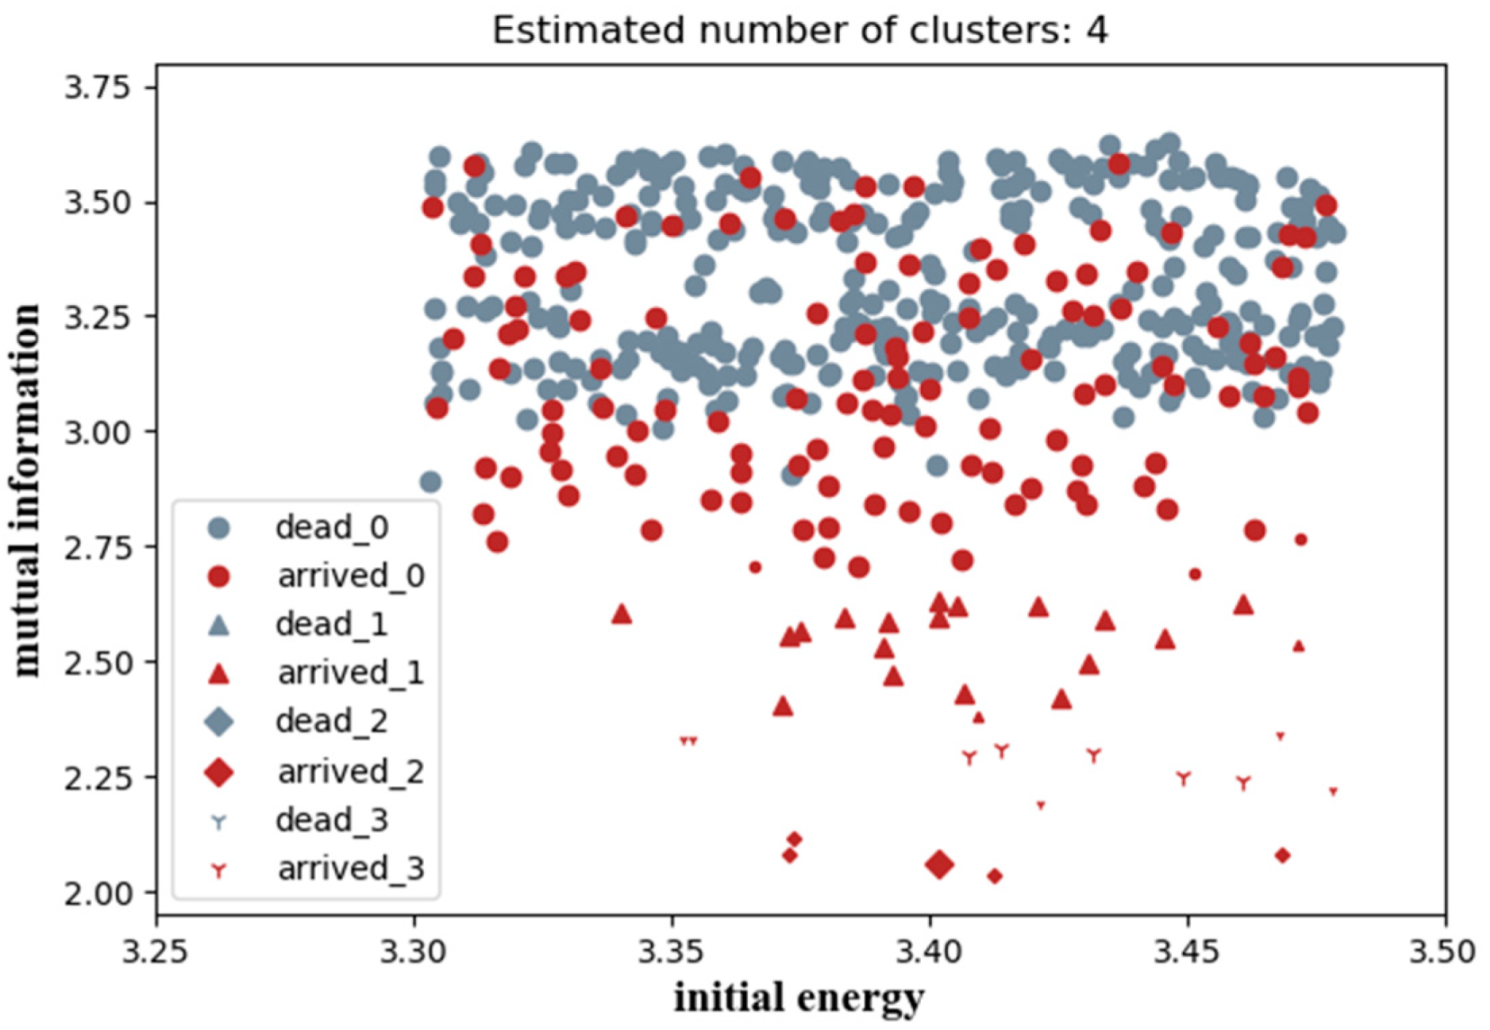
In order to explore the impact of initial energy and mutual information on the eventual survival of the pedestrians during the evacuation process, the DBSCAN (Density-Based Spatial Clustering of Applications with Noise) algorithm [73] is used for cluster analysis. For the experimental effect more suitable for clustering, the previous round of experiments was also extended and improved. The minpt should be set as a relatively low value in order to include all points belonging to the same cluster, and Eps must be set to ensure density reachability [73]. Parameters in the test are set as eps = 0.07 (Eps-neighborhood of a point) and minpt = 5 (the minimum number of points around a point). The initial energy of the pedestrians is set to a random value between 2000 and 3000, and the data were logarithmically normalized before clustering. The clustering results are shown in Figure 10, Figure 11 and Figure 12, where red indicates the surviving pedestrians, gray indicates the final dead pedestrians, different shapes indicate different cluster categories, and “X” indicates an abnormal point in the clustering process. The value of the coordinate axes in the figure is the logarithm normalized of the original data.
Comparing the clustering results in the above three cases, the following preliminary analysis can be obtained:
(1) When the ratio of pedestrians who are rebellious or following is not significant, pedestrians’ decision-making sets are likely to be random. The probability of survival is equal to the probability of death, and the information interaction between pedestrians is not obvious.
(2) When the rebellious pedestrians account for a large number of the overall population, although the interaction information is less, the energy retention level is higher. And a single type of low-information survival situation appears, such as a geographical advantage (near the rescue point) and a prior route selection advantage (appropriate route planning).
(3) When there are fewer pedestrians of the rebellious type, the survival situation is more detailed. The proportion of pedestrians with low information survival increases and the number of clusters increases, but the initial energy requirement is higher. Reflecting high energy in the case of less information interaction, the probability of effective information exchange and energy consumption has increased. For example, the population is divided into different groups to participate in route finding.
(4) The pedestrians who eventually die will accumulate more information. Those who have not arrived at shelters will continue to search. In this process, they will encounter pedestrians who are also searching for routes and accumulate more information. However, the information exchange efficiency is not high, and there is not much effective information at this period. It does not substantially help to find shelters, and it eventually exhausts energy.
The extreme situation is that when one person walks, there is no information exchange, and walking in the given direction only affects the selected route by the accumulated waterlogging points; when too many pedestrians walk, the information enters the redundant invalid exchange after the initial effective exchange. In most cases, the information exchange status of the crowd is always between the effective exchange and the invalid exchange. When the crowd density is high, the probability of information exchange increases, but the probability of invalid exchange increases simultaneously. When the crowd density is low, the probability of information exchange is reduced, but limited information exchange can achieve a higher value.
Rebellious decision making can open up the crowd to a certain extent, appropriately reduce the crowd density, improve the effectiveness of information exchange, and reduce energy consumption. But if there is too much deviation from the mainstream crowds, the probability of information exchange is reduced. In general, the probability of information exchange, the effectiveness of information exchange, and the information that can be replaced by unit energy are complex processes.
3.3. Analysis of Sustainable Rescue after Entering Shelters
When the shelters are set in different areas, it may be different in energy replenishment due to traffic, site, etc., like wj in Equation (1). Under normal circumstances, the crowded traffic or the limited venue will lead to insufficient replenishment. On the contrary, the shelters’ replenishment capacity is positively related to its remoteness. When agents reach the shelter in the internal area, there may be much residual energy, but less replenishment is acceptable. And pedestrian agents who go to the farther shelter will consume a large quantity of energy in the process, but considerable replenishment is available after agents reach the shelter. The following analyses the sustainability of the pedestrian agents after reaching the shelters. Since there are no problems with route selection within the house, the two categories of pedestrians are discussed together. Whether they survive is only determined by their residual energy.
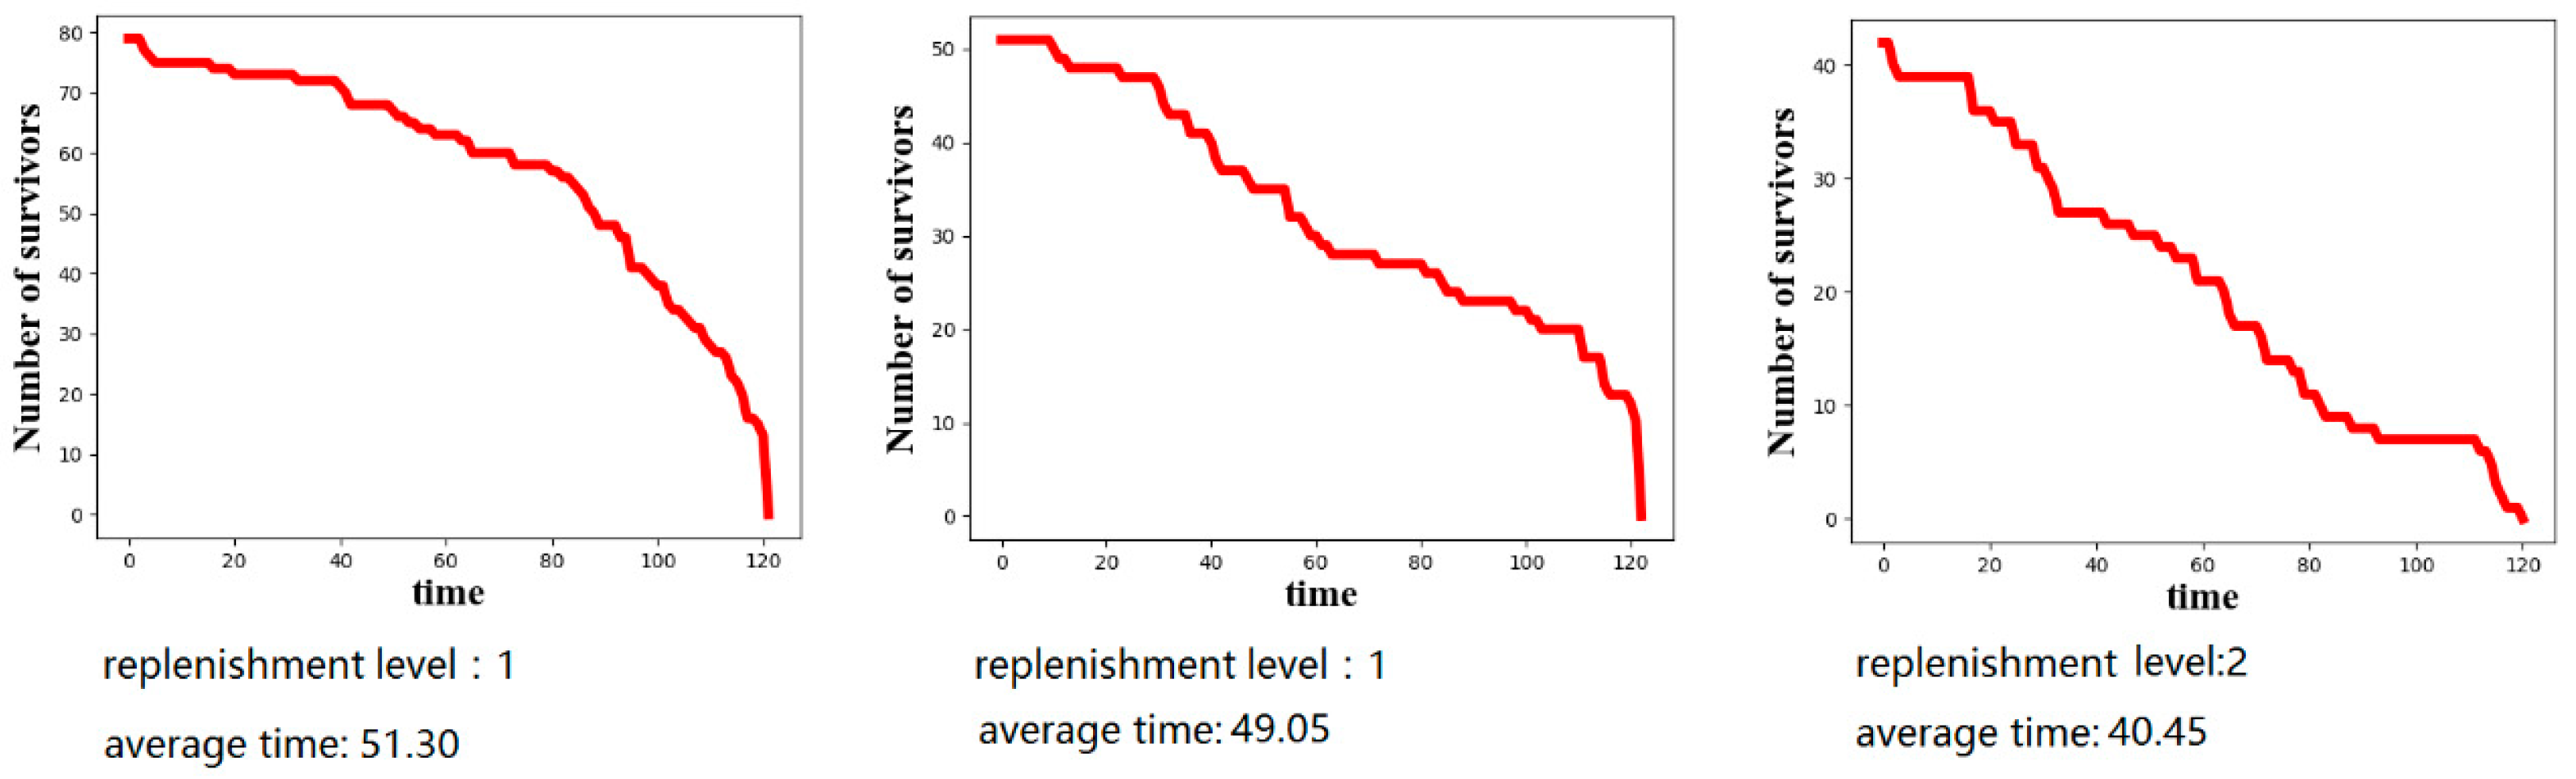
The situations of the crowds after entering each shelter were discussed separately. The fixed energy consumption per person per round was 20 in the test. The average survival time of the population in each shelter was calculated by the Equation (9):
where N is the number of survivors currently, time represents the current time after agents entering the shelters.
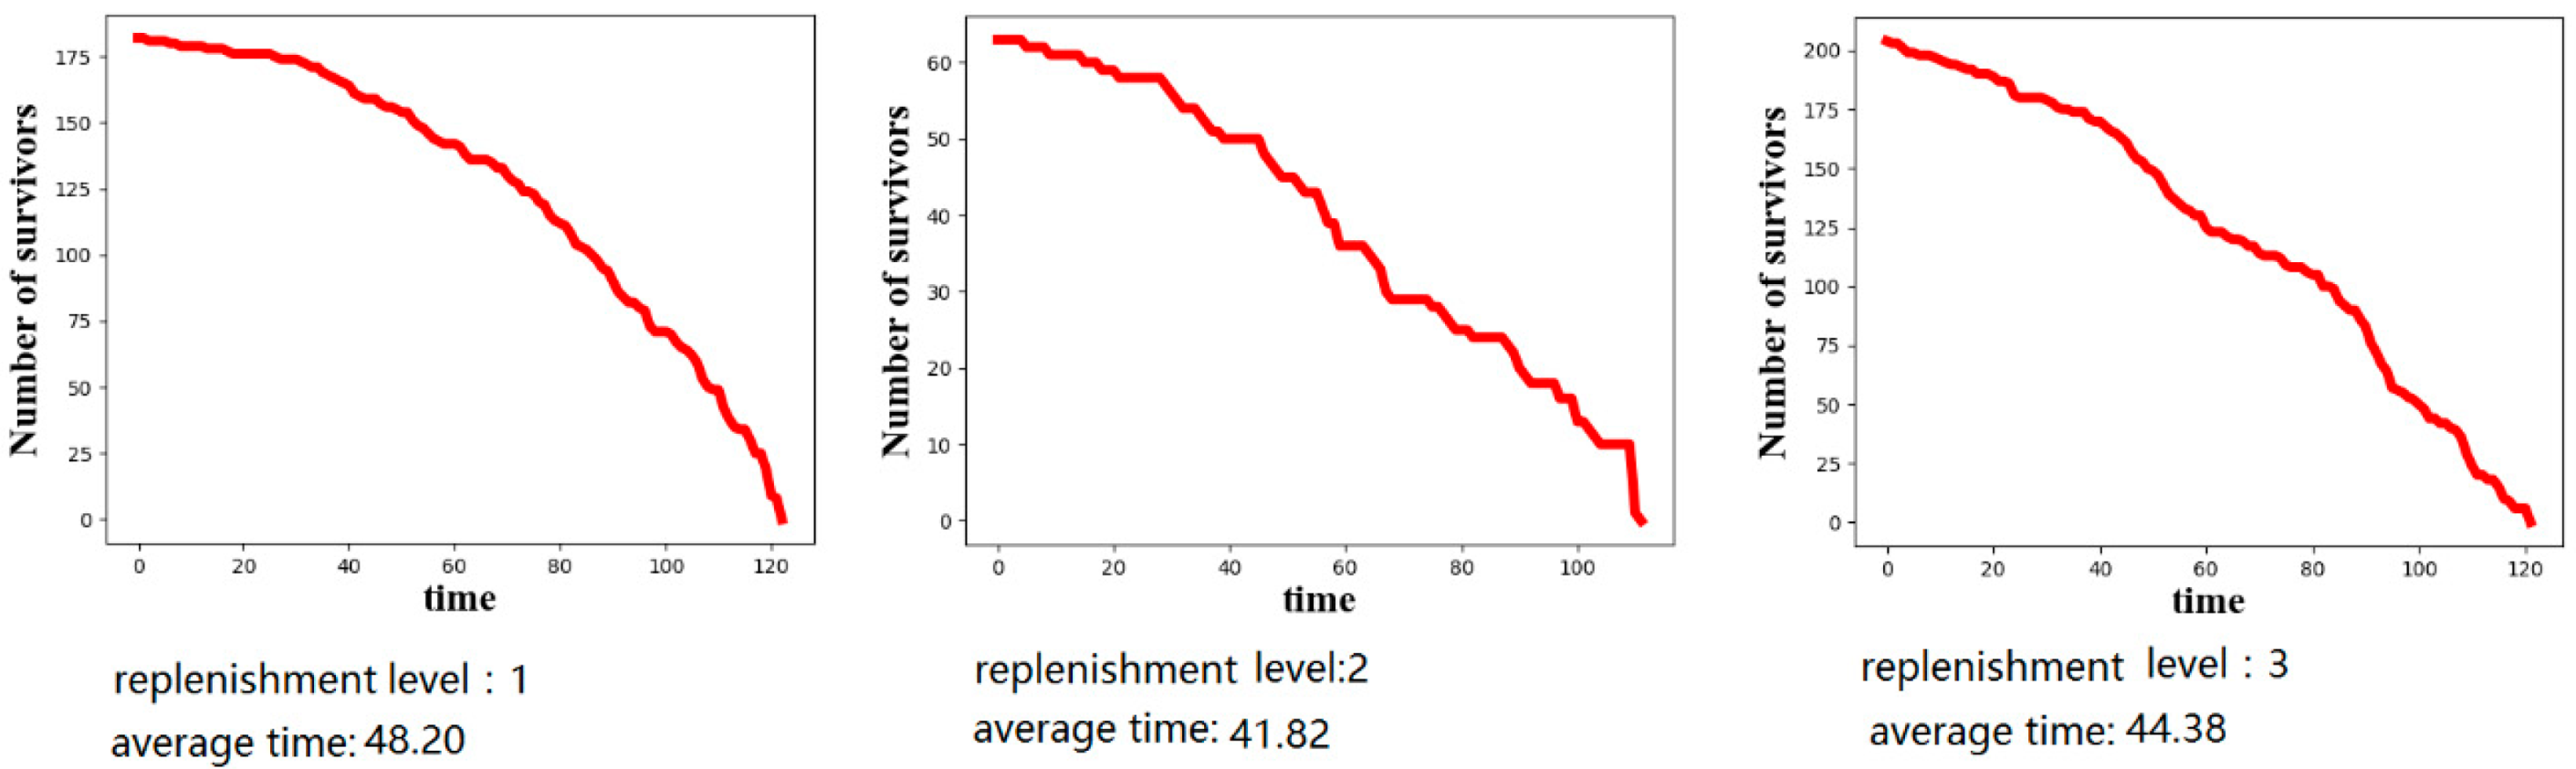
Figure 13, Figure 14 and Figure 15 show the changes in the number of survivors without additional assistance after the population reaches each shelter.
In the case that the distribution is 1-1-1, the shelters are located in internal areas, and the replenishment capacity that can be provided is poor, but the minute difference of replenishment means that the number of pedestrians going to the three shelters is much the same. However, because the routes to these shelters are relatively close, the amount of residual energy for the arrived crowds is large. Therefore, in the early stage, the survival rate can be maintained in the case of an insufficient supply of shelters. After that, there is a sharp downward turn, in which the number of survivors is rapidly reduced since the energy has been consumed earlier. These two features are most evident in the map of the first shelter.
In the case that the distribution is 1-1-2, the diverse curve of the number of survivors in each shelter has a more obvious characteristic of the leftward depression below the previous case, indicating that the number of deaths in the early period is more than the first case. The calculated average survival time also indicates that the average survival time within each shelter is also shorter when the shelters are dispersed. The main reason for this situation is that, in such distribution, the replenishment of the second-level shelters is not enough to allow some pedestrians who are farther away to choose this shelter, and it does not effectively alleviate the disaster relief pressure of the first-level shelter. Therefore, some of the pedestrians arriving in each shelter may have almost no energy, and the replenishment of shelters can not fully meet the needs of the crowd. So, this group of pedestrians may die in the early stage. Later, similar to the first situation, pedestrians who survived to the late stage are basically consuming their own energy, and in this part, the value of pedestrians’ residual energy is similar, so there are many pedestrians who die in the same round.
In the case of scattered shelters, the population survival curve in each shelter did not sink farther to the left but became smoother and closer to the linear function. The reason is similar to that shown in Figure 9. In the case of scattered shelters, the number of survivors is very large, even in multiples of the above two cases. But under the condition that the experiment does not design the continuous replenishment of resources, the third-level shelter does not provide several times the replenishment of resources that the first and second levels provide. As a result, it also leads to insufficient resource allocation. Although it can maintain the energy replenishment for a short period, the population consumes its own energy most of the time. Therefore, in the event of a real disaster, disaster relief departments must pay attention to the continuous replenishment of relief supplies, especially the shelters located far away from the crowd. Maintaining sufficient replenishment can greatly improve rescue efficiency.
4. Conclusions and Recommendations
4.1. Conclusions
It is of great significance to study how to effectively evacuate and protect human life and property during urban rainstorms. Exploring pedestrian evacuation disciplines and effective rescues is an important part of it. In this paper, the MAS method is employed to simulate the pedestrian evacuation and the survival scenario in shelters after an urban rainstorm disaster. The main conclusions of this study are as follows:
(1) The number of survivors is the largest when the shelters are scattered no matter what ratios of pedestrians. It can be proved that the number of survivors is positively related to the degree of the shelters’ dispersion and the coverage of residential areas.
(2) The third-level shelters have gathered the most pedestrians in the scattered situation, and continuous replenishment is vital. However, the disaster relief effect of the second-level shelter is not very satisfactory.
(3) In the case of scattered shelters, the following agents will have obvious advantages. In the evacuation under the urban rainstorm disaster, the impact of death and injury due to crowding is much less than the help of information exchange between pedestrians. But in the case of a dense distribution of shelters, only following the crowd may fall into a local dilemma.
(4) Excess information from others may bring a burden and decrease the effectiveness, which can not provide great help for an agent’s successful evacuation.
4.2. Recommendations
(1) For the disaster relief department
It is necessary to pay attention to the scope of the crowds’ activity under the emergency when the disaster relief department sets up a shelter. The ideal distribution of shelters should achieve full coverage and less crossover.
In order to satisfy the rescue and replenishment of pedestrians, it is necessary to continue to arrange sustainable supplies. Otherwise, even if the third-level shelters have sufficient materials, it will only be a drop in the face of a large number of pedestrians.
The disaster relief department should focus on first-level or third-level shelters, and the second-level shelters would be less established when setting up the shelters. In addition, the rescuers can guide the pedestrians with a good health status to transfer to the second or third-level shelters when the first-level shelters gather a large number of pedestrians.
(2) For evacuated pedestrians
It will be more advantageous to follow the crowd when the shelter is far away during the evacuation process. The emergence of some rebellious agents to explore a new survival route is a good choice in the local dilemma.
If the current shelter has gathered a large number of pedestrians but the replenishment is scarce, pedestrians who are in a healthy state should transfer to other shelters.
Because the information exchange efficiency in the local dilemma is very low, it is greatly important, for urban rainstorm disaster evacuation, to grasp the initial time period with the highest information interaction efficiency, so as to be rescued as soon as possible.
4.3. Future Work
In this paper, the multi-agent modeling technology is used to build a city-hedging model based on the Repast Simphony simulation modeling platform. However, there are still some areas in need of further research.
Map elevation data and meteorological data are not considered in this simulation, the simulation of raining and the generation of waterlogging points are not very accurate. This leads to the depth and range of the accumulated water, and the damage with the pedestrians are not perfect.
In order to facilitate the simulation, some of the complexity of the pedestrians’ behavior and energy loss is not considered, like the game relationship of crowd information interaction in this simulation. And this model only sets a destination for pedestrians. In the experiment, there have been many cases where pedestrians have passed other shelters but did not enter, because they are not their own target shelters. In the next step of the study, it is necessary to further improve the mathematical model of the changes in the characteristics of pedestrians, and rules of changing destinations.
The experiments within the shelters did not simulate the continuous replenishment of external supplies. This leads to the population in each shelter spending most of their time consuming their own energy, which makes the distinction unclear between the characteristics of each shelter and is not conducive to excavating more regularities. This is where the design of the model is not considered complete. The follow-up study should supplement the external material replenishment model for each shelter.
Author Contributions
All the authors contributed to the research design, manuscript development, editing, and completion of the manuscript. Conceptualization, Q.Y. and X.L.; methodology, Y.S. and X.L.; software, Y.S.; validation, Q.Y., X.L. and J.W.; formal analysis, Y.S. and X.L.; investigation, J.W.; resources, Y.S. and X.L.; data curation, Y.S. and X.L.; writing—original draft preparation, Q.Y.; writing—review and editing, X.L.; visualization, Y.S.; supervision, X.L. All authors have read and agreed to the published version of the manuscript.
Funding
This research was supported in part by National Natural Science Foundation of China (Grant No. 71603197) and “the Fundamental Research Funds for the Central Universities” (WUT: 195203001).
Acknowledgments
The authors would like to thank Wei Zhou, Tianyu Wan for their helpful suggestions and technology support. Special thanks to the anonymous reviewers and the editors whose suggestions and comments have significantly improved the article.
Conflicts of Interest
The authors declare that they have no known competing financial interests or personal relationships that could have appeared to influence the work reported in this paper.
References
- Zhao, X.; Yang, K.; Peng, S.; Xu, Q.; Meng, C. The study of urban rainstorm waterlogging scenario simulation based on GIS and SWMM model—Take the example of Kunming Dongfeng East Road catchment area. In Proceedings of the International Conference on Geoinformatics, Kaifeng, China, 20–22 June 2013; pp. 1–5. [Google Scholar]
- Han, B.; Wang, R.; Tao, Y.; Gao, H. Urban population agglomeration in view of complex ecological niche: A case study on Chinese prefecture cities. Ecol. Indic. 2014, 47, 128–136. [Google Scholar] [CrossRef]
- Su, B.; Huang, H.; Li, Y. Integrated simulation method for waterlogging and traffic congestion under urban rainstorms. Nat. Hazards 2016, 81, 23–40. [Google Scholar] [CrossRef]
- Chen, P.; Zhang, J.; Zhang, L.; Sun, Y. Evaluation of resident evacuations in urban rainstorm waterlogging disasters based on scenario simulation: Daoli district (Harbin, China) as an example. Int. J. Environ. Res. Public Health 2014, 11, 9964–9980. [Google Scholar] [CrossRef] [PubMed] [Green Version]
- Chen, P.; Zhang, J.; Sun, Y.; Liu, X. Wargame simulation theory and evaluation method for emergency evacuation of residents from urban waterlogging disaster area. Int. J. Environ. Res. Public Health 2016, 13, 1260. [Google Scholar] [CrossRef] [PubMed]
- Su, Y.; Zhao, F.; Tan, L. Whether a large disaster could change public concern and risk perception: A case study of the 7/21 extraordinary rainstorm disaster in Beijing in 2012. Nat. Hazards 2015, 78, 555–567. [Google Scholar] [CrossRef]
- Pan, Y.; Shao, Z.; Cheng, T.; Wang, Z.; Zhang, Z. Influence Analysis of Waterlogging Based on Deep Learning Model in Wuhan. In Proceedings of the International Archives of the Photogrammetry, Remote Sensing and Spatial Information Sciences, Wuhan, China, 18–22 September 2017; Volume XLII-2/W7. [Google Scholar]
- Zhang, W.; Wang, X.; Liu, Y.; Zhang, T. Simulation of Rainstorm Waterlogging Based on SWMM and Visualization Module Research. In Proceedings of the 2016 International Conference on Smart City and Systems Engineering (ICSCSE), Hunan, China, 25–26 November 2016. [Google Scholar]
- Huang, J.; Wang, S.; Deng, S.; Yang, X.; Zhou, Q. Numerical study on the impact of Gongji Road Rain Pump on the waterlogging in Huinan, Pudong District. J. Geosci. Environ. Prot. 2014, 2, 52–58. [Google Scholar] [CrossRef]
- Yu, D.P.; Coulthard, T.J. Evaluating the importance of catchment hydrological parameters for urban surface water flood modelling using a simple hydro-inundation model. J. Hydrol. 2015, 524, 385–400. [Google Scholar] [CrossRef] [Green Version]
- Jamieson, S.; Lhomme, J.; Gouldby, B. A highly efficient 2d flood modelling with sub-element topography. Water Manag. 2012, 165, 581–595. [Google Scholar]
- Yu, H.; Huang, G.; Wu, C. Application of the stormwater management model to a piedmont city: A case study of Jinan city, China. Water Sci. Technol. 2014, 70, 858. [Google Scholar] [CrossRef]
- Zhu, D.; Zhou, N.; Jiang, S. Research overview of runoff model for urban rainwater. J. Water Resour. Water Eng. 2011, 22, 132–137. (In Chinese) [Google Scholar]
- Bisht, D.; Chatterjee, C.; Kalakoti, S.; Upadhyay, P.; Sahoo, M.; Panda, A. Modeling urban floods and drainage using SWMM and MIKE urban: A case study. Nat. Hazards 2016, 84, 749–776. [Google Scholar] [CrossRef]
- Dawson, R.J.; Peppe, R.; Wang, M. An agent-based model for risk based flood incident management. Nat. Hazards 2011, 59, 167–189. [Google Scholar] [CrossRef]
- Whitehead, J.C.; Edwards, B.; van Willigen, M.; Maiolo, J.R.; Wilson, K.; Smith, K.T. Heading for higher ground: Factors affecting real and hypothetical hurricane evacuation behavior. Environ. Hazards 2001, 2, 133–142. [Google Scholar] [CrossRef]
- Drabek, T.E. Human System Responses to Disaster, Post-Impact Emergency Actions Human System Responses to Disaster; Springer: Berlin/Heidelberg, Germany, 1988; pp. 132–199. [Google Scholar]
- Senkbeil, J.C.; Rockman, M.S.; Mason, J.B. Shelter seeking plans of tuscaloosa residents for a future tornado event. Weather Clim. Soc. 2012, 4, 159–171. [Google Scholar] [CrossRef] [Green Version]
- Whyte, A. Survey of Households Evacuated during the Mississauga Chlorine Gas Emergency, Emergency Planning Project. Toronto, Canada, 10–16 November 1979; Institute for Environmental Studies, University of Toronto: Toronto, ON, Canada, 1980. [Google Scholar]
- Komatsu, N.; Sasabe, M.; Kawahara, J.; Kasahara, S. Automatic evacuation guiding scheme based on implicit interactions between evacuees and their mobile nodes. GeoInformatica 2018, 22, 127–141. [Google Scholar] [CrossRef]
- Murakami, Y.; Ishida, T.; Kawasoe, T.; Hishiyama, R. Scenario Description for Multi-Agent Simulation. Proc. Int. Conf. Auton. Agents 2003, 2, 369–376. [Google Scholar]
- Treuille, A.; Cooper, S.; Popović, Z. Continuum crowds. ACM Trans. Graphics 2006, 25, 1160–1168. [Google Scholar] [CrossRef]
- Hoogendoorn, S.P.; Daamen, W.; Duives, D.C.; Van Wageningen-Kessels, F.L.M. Optimal crowd evacuation. In Proceedings of the 93rd Annual Meeting Transportation Research Board, Washington, DC, USA, 12–16 January 2014; pp. 1–19. [Google Scholar]
- Guo, R.Y.; Huang, H.J.; Wong, S.C. Collection, spillback, and dissipation in pedestrian evacuation: A network-based method. Transp. Res. Part B Methodol. 2011, 45, 490–506. [Google Scholar] [CrossRef] [Green Version]
- Roger, L.H. A continuum theory for the flow of pedestrians. Transp. Res. Part B 2002, 36, 507–535. [Google Scholar]
- Henderson, L.F. The statistics of crowd fluids. Nature 1971, 229, 381–383. [Google Scholar] [CrossRef]
- Helbing, D. A fluid dynamic model for the movementof pedestrians. Complex. Syst. 1992, 6, 391–415. [Google Scholar]
- Roger, L.H. The flow of large crowds of pedestrians. Math. Comput. Simul. 2000, 53, 367–370. [Google Scholar]
- Burstedde, C.; Klauck, K.; Schadschneider, A.; Zittartz, J. Simulation of pedestrian dynamics using a two-dimensional cellular automaton. Physica A 2001, 295, 507–525. [Google Scholar] [CrossRef] [Green Version]
- Kirchner, A.; Namazi, A.; Nishinari, K.; Schadschneider, A. Extended floor field CA model for evacuation dynamics. IEICE Trans. Inf. Syst. D 2003, 87, 726–732. [Google Scholar]
- Lee, J.Y.S.; Lam, W.H.K.; Wong, S.C. Pedestrian simulation model for Hong Kong underground stations. In Proceedings of the IEEE Conference on Intelligent Transportation Systems, Oakland, CA, USA, 25–29 August 2001; pp. 554–558. [Google Scholar]
- Masuda, H.; Kikuchi, S.; Arai, T. Performance Analysis of Retail Store Layout Using Agent-Based Simulation. J. Jpn. Ind. Manag. Assoc. 2009, 60, 128–144. [Google Scholar]
- Pelechano, N.; Badler, N.I. Modeling crowd and trained leader behavior during building evacuation. IEEE Comput. Graph. Appl. 2006, 26, 80–86. [Google Scholar] [CrossRef] [Green Version]
- Cuena, J.; Ossowski, S. 11 Distributed Models for Decision Support. In Multiagent Systems: A Modern Approach to Distributed Artificial Intelligence; MIT Press: Cambridge, MA, USA, 1999; pp. 459–504. [Google Scholar]
- Chen, X.; Meaker, J.W.; Zhan, F.B. Agent-based modeling and analysis of hurricane evacuation procedures for the Florida Keys. Nat. Hazards 2006, 38, 321–338. [Google Scholar] [CrossRef]
- Aldewereld, H.; Tranier, J.; Dignum, F.; Dignum, V. Collaborative Agents—Research and Development; Agent-Based Crisis Management; Springer: Berlin/Heidelberg, Germany, 2011; pp. 31–43. [Google Scholar]
- Cheng, Y.; Zheng, X. Emergence of cooperation during an emergency evacuation. Appl. Math. Comput. 2018, 320, 485–494. [Google Scholar] [CrossRef]
- Bode, N.W.F.; KemlohWagoum, A.U.; Codling, E.A. Information use by humans during dynamic route choice in virtual crowd evacuations. R. Soc. Open Sci. 2015, 2. [Google Scholar] [CrossRef] [Green Version]
- Wong, S.K.; Wang, Y.S.; Tang, P.K.; Tsai, T.Y. Optimized evacuation route based on crowd simulation. Comput. Vis. Media 2017, 3, 243–261. [Google Scholar] [CrossRef] [Green Version]
- Pan, X.; Han, C.S.; Dauber, K.; Law, K.H. A multi-agent based framework for the simulation of human and social behaviors during emergency evacuations. AI Soc. 2007, 22, 113–132. [Google Scholar] [CrossRef]
- Bode, N.W.F.; Codling, E.A. Human exit route choice in virtual crowd evacuations. Anim. Behav. 2013, 86, 347–358. [Google Scholar] [CrossRef]
- Shen, Y.; Liu, S.; Fang, Z.; Hu, M. Modeling and simulation of stranded passengers’ transferring decision-making on the basis of herd behaviors. Kybernetes 2012, 41, 963–976. [Google Scholar] [CrossRef]
- Wang, J.; Chen, M.; Yan, W.; Zhi, Y.; Wang, Z. A utility threshold model of herding–panic behavior in evacuation under emergencies based on complex network theory. Simulation 2017, 93, 123–133. [Google Scholar] [CrossRef] [Green Version]
- Muir, H.C. Research into the factors influencing survival in aircraft accidents. Aeronaut. J. 1996, 100, 177–182. [Google Scholar]
- Siebers, P.-O.; Aickelin, U. Introduction to Multi-Agent Simulation. In Encyclopedia of Decision Making and Decision Support Technologies; IGI Global: Hershey, PA, USA, 2008; Volume 2, pp. 554–564. [Google Scholar]
- Jérémy, P.; Mouaddib, A.I.; Gatepaille, S. Detection of Primitive Collective Behaviours in a Crowd Panic Simulation Based on Multi-Agent Approach. Int. J. Swarm Intell. Res. 2012, 3, 50–65. [Google Scholar]
- Minar, N.; Burkhart, R.; Langton, C.; Askenazi, M. The Swarm Simulation System: A Toolkit for Building Multi-Agent Simulations; Santa Fe Institute: Santa Fe, NM, USA, 1996. [Google Scholar]
- Tisue, S.; Wilensky, U. NetLogo: Design and implementation of a multi-agent modeling environment. In Proceedings of the Agent 2004 Conference on Social Dynamics: Interaction, Reflexivity and Emergence, Chicago, IL, USA, 7–9 October 2004; pp. 7–9. [Google Scholar]
- Collier, N.; Howe, T.R.; North, M.J. Onward and upward: The transition to Repast 2.0. In Proceedings of the First Annual North American Association for Computational Social and Organizational Science Conference, Pittsburgh, PA, USA, 1 January 2003; Volume 122, pp. 136–140. [Google Scholar]
- North, M.J.; Collier, N.T.; Vos, J.R. Experiences creating three implementations of the repast agent modeling toolkit. ACM Trans. Model. Comput. Simul. 2006, 16, 1–25. [Google Scholar] [CrossRef]
- Collier, N. RePast: An Extensible Framework for Agent Simulation. Univ. Chic. Soc. Sci. Res. 2003, 36, 371–375. [Google Scholar]
- North, M.J.; Howe, T.R.; Collier, N.T.; Vos, J.R. The Repast Simphony Runtime System. In Proceedings of the Agent 2005 Conference on Generative Social Processes, Models, and Mechanisms, Chicago, IL, USA, 13–15 October 2005; pp. 151–158. [Google Scholar]
- Malleson, N.; Heppenstall, A.; See, L. Crime reduction through simulation: An agent-based model of burglary. Comput. Environ. Urban Syst. 2010, 34, 236–250. [Google Scholar] [CrossRef]
- Wang, F.Y.; Carley, K.M.; Zeng, D.; Mao, W.J. Social computing: From social informatics to social intelligence. IEEE Intell. Syst. 2007, 22, 79–83. [Google Scholar] [CrossRef]
- Tong, W.; Cheng, L. Simulation of Pedestrian Flow based on Multi-agent. Procedia Soc. Behav. Sci. 2013, 96, 17–24. [Google Scholar] [CrossRef] [Green Version]
- Quarantelli, E. The behavior of panic participants. Sociol. Soc. Res. 1957, 41, 187–194. [Google Scholar]
- Keating, J.P. The myth of panic. Fire 1982, 147, 57–61. [Google Scholar]
- Wu, J.; Weng, W.; Ni, S. Urban emergency evacuation plans based on GIS and multi-agent systems. J. Tsing Huauni Univ. (Sci. Technol. ) 2010, 50, 1168–1172. (In Chinese) [Google Scholar]
- Dijkstra, E.W. A note on two problems in connexion with graphs. Numerischemathematik 1959, 1, 269–271. [Google Scholar] [CrossRef] [Green Version]
- Cuong, T.T. CrowdRoute: A crowd-sourced routing algorithm in public transit networks. GEOCROWD 2013. In Proceedings of the 2nd ACM SIGSPATIAL International Workshop on Crowdsourced and Volunteered Geographic Information, Orlando, FL, USA, 5 November 2013; pp. 9–14. [Google Scholar]
- Uno, K.; Kashiyama, K. Development of Simulation System for the Disaster Evacuation Based on Multi-Agent Model Using GIS. Tsinghua Sci. Technol. 2008, 13 (Suppl. 1), 348–353. [Google Scholar] [CrossRef]
- Fu, Y.; Liang, J.; Liu, Q.; Hu, X. Crowd Simulation for Evacuation Behaviors Based on Multi-agent System and Cellular Automaton. In Proceedings of the 2014 International Conference on Virtual Reality and Visualization (ICVRV), Shenyang, China, 30–31 August 2014. [Google Scholar]
- Helbing, D.; Farkas, I.; Vicsek, T. Simulating Dynamical Features of Escape Panic. Nature 2000, 407, 487–490. [Google Scholar] [CrossRef] [Green Version]
- Kasai, Y.; Sasabe, M.; Kasahara, S. Congestion-aware route selection in automatic evacuation guiding based on cooperation between evacuees and their mobile nodes. Eurasip J. Wirel. Commun. Netw. 2017, 2017, 164. [Google Scholar] [CrossRef] [Green Version]
- Iizuka, Y.; Iizuka, K. Disaster evacuation assistance system based on multi-agent cooperation. In Proceedings of the Annual Hawaii International Conference on System Sciences, Kauai, HI, USA, 5–8 January 2015; pp. 173–181. [Google Scholar]
- Chen, Y.; Liu, R.; Barrett, D.; Gao, L.; Zhou, M.; Renzullo, L.; Emelyanova, I. A spatial assessment framework for evaluating flood risk under extreme climates. Sci. Total Environ. 2015, 538, 512–523. [Google Scholar] [CrossRef]
- Liu, R.; Chen, Y.; Wu, J.; Gao, L.; Barrett, D.; Xu, T.; Li, X.; Li, L.; Huang, C.; Yu, J. Integrating Entropy-Based Naïve Bayes and GIS for Spatial Evaluation of Flood Hazard. Risk Anal. 2017, 37, 756–773. [Google Scholar] [CrossRef]
- Chang, M.; Tseng, Y.; Chen, J. A scenario planning approach for the floodemergency logistics preparation problem under uncertainty. Transp. Res. Part E Logist. Transp. Rev. 2007, 43, 737–754. [Google Scholar] [CrossRef]
- Wang, F.Y.; Wang, X.; Li, L.; Li, L. Steps toward Parallel Intelligence. IEEE/CAA J. Autom. Sin. 2016, 3, 345–348. [Google Scholar]
- Kongsomsaksakul, S.; Yang, C.; Chen, A. Shelter location-allocation model for flood evacuation planning. J. East. Asia Soc. Transp. Stud. 2005, 6, 4237–4252. [Google Scholar]
- Chu, J.Y.; Chen, L.L. The Research Progress on Site Selection of Disasters Mitigation Emergency Congregate Shelter. In Advanced Materials Research; Trans Tech Publication: Zurich, Switzerland, 2014. [Google Scholar]
- Chu, J.; Su, Y.; Ma, D. Study on design of emergency lodging plot in disasters mitigation congregate emergency shelter. World Inf. Earthq. Eng. 2014, 30, 80–85. [Google Scholar]
- Ester, M.; Kriegel, H.P.; Sander, J.; Xu, X. A density-based algorithm for discovering clusters in large spatial databases with noise. Kdd 1996, 96, 226–231. [Google Scholar]
Figure 1.
Study area (a campus) in Wuhan, China.

Figure 2.
Simulation map.

Figure 3.
Shelters are dense.

Figure 4.
Shelters are dispersed.

Figure 5.
Shelters are scattered.

Figure 6.
Simulation situation when shelters distribution is 1-1-1.

Figure 7.
Simulation situation when shelters distribution is 1-1-2.

Figure 8.
Simulation situation when shelters distribution is 1-2-3.

Figure 9.
Pedestrian survival in different situations.

Figure 10.
Clustering in the case of more rebellious populations.

Figure 11.
Clustering in the case of the rebellious population equaling following population.

Figure 12.
Clustering in the case of more following populations.

Figure 13.
Survival in shelters in the case that the distribution is 1-1-1.

Figure 14.
Survival in shelters in the case that the distribution is 1-1-2.

Figure 15.
Survival in shelters in the case that the distribution is 1-2-3.


Table 1.
Key variables about the pedestrian agents.
| Variables | Symbols | Description |
|---|---|---|
| Probability | pij | probability of the agents start from i and the destination is shelter j |
| Replenishment capacity | replenishment capacity of the shelter j | |
| Distance | dij | distance between the nodes i and j |
| Number of pedestrians | M | co-occurrence amount of pedestrians in a route |
| Number of waterlogging points | r | number of waterlogging points in a route |
| Score of a route | S | the calculated score of a route by an agent crossing an intersection |
| speed | v0 | initial speed of an agent |
| v | current speed of an agent | |
| energy | E | current energy of an agent |
| E0 | initial energy of an agent | |
| Er | energy consumed by wading the waterlogging | |
| crowd density | crowd density around an agent | |
| information | I | information of an agent |
Table 2.
Pedestrian survival rates under different conditions.
| Ratios | 1-1-1 | 1-1-2 | 1-2-3 | |||
|---|---|---|---|---|---|---|
| Rebellious | Following | Rebellious | Following | Rebellious | Following | |
| 6:4 | 18.89% | 21.74% | 14.01% | 18.13% | 22.44% | 43.15% |
| 5:5 | 14.10% | 13.91% | 14.69% | 20.39% | 21.32% | 36.36% |
| 4:6 | 19.80% | 23.15% | 11.28% | 10.82% | 19.38% | 35.74% |
| 3:7 | 14.04% | 10.64% | 23.08% | 20.06% | 17.04% | 40.82% |
| 2:8 | 13.59% | 14.86% | 14.44% | 16.34% | 13.86% | 31.83% |
| 1:9 | 6.25% | 20.18% | 14.29% | 24.61% | 20% | 50.43% |
© 2020 by the authors. Licensee MDPI, Basel, Switzerland. This article is an open access article distributed under the terms and conditions of the Creative Commons Attribution (CC BY) license (http://creativecommons.org/licenses/by/4.0/).
Share and Cite
MDPI and ACS Style
Yang, Q.; Sun, Y.; Liu, X.; Wang, J. MAS-Based Evacuation Simulation of an Urban Community during an Urban Rainstorm Disaster in China. Sustainability 2020, 12, 546. https://0-doi-org.brum.beds.ac.uk/10.3390/su12020546
AMA Style
Yang Q, Sun Y, Liu X, Wang J. MAS-Based Evacuation Simulation of an Urban Community during an Urban Rainstorm Disaster in China. Sustainability. 2020; 12(2):546. https://0-doi-org.brum.beds.ac.uk/10.3390/su12020546
Chicago/Turabian StyleYang, Qing, Ying Sun, Xingxing Liu, and Jinmei Wang. 2020. "MAS-Based Evacuation Simulation of an Urban Community during an Urban Rainstorm Disaster in China" Sustainability 12, no. 2: 546. https://0-doi-org.brum.beds.ac.uk/10.3390/su12020546
Note that from the first issue of 2016, this journal uses article numbers instead of page numbers. See further details here.