Article

Economic Structure Transformation and Low-Carbon Development in Energy-Rich Cities: The Case of the Contiguous Area of Shanxi and Shaanxi Provinces, and Inner Mongolia Autonomous Region of China

1
Institute of Geographic Sciences and Natural Resources Research, Chinese Academy of Sciences, Beijing 100101, China
2
College of Resources and Environment, University of Chinese Academy of Sciences, Beijing 100049, China
3
Key Laboratory of Carrying Capacity Assessment for Resource and Environment, Ministry of Natural Resources of the People’s Republic of China, Beijing 101149, China
*
Author to whom correspondence should be addressed.
Sustainability 2020, 12(5), 1875; https://0-doi-org.brum.beds.ac.uk/10.3390/su12051875
Submission received: 6 January 2020 / Revised: 15 February 2020 / Accepted: 28 February 2020 / Published: 2 March 2020

Abstract

:
Energy-rich cities tend to rely on resource-based industries for economic growth, which leads to a great challenge for its low-carbon and sustainable economic development. The contiguous area of Shanxi and Shaanxi Provinces, and the Inner Mongolia Autonomous Region (SSIM) is one of the most important national energy bases in China. Its development pattern, dominated by the coal industry, has led to increasingly prominent structural problems along with difficult low-carbon transition. Taking energy-rich cities in the contiguous area of SSIM as examples, this study analyzes the main drivers of CO2 emissions and explores the role of economic structure transformation in carbon emission reduction during 2002–2012 based on structural decomposition analysis (SDA). The results show that CO2 emissions increase significantly with the coal industry expansion in energy-rich cities. Economic growth and structure are the main drivers of CO2 emission increments. An energy structure dominated by coal and improper product allocation structure can also cause CO2 emission increases. Energy consumption intensity is the main factor curbing CO2 emission growth in energy-rich cities. The decline of agriculture and services contributes to carbon emission reduction, while the expansion of mining and primary energy processing industries has far greater effects on CO2 emission growth. Finally, we propose that energy-rich cities must make more efforts to transform energy-driven economic growth patterns, cultivate new pillar industries by developing high-end manufacturing, improve energy efficiency through more investment in key technologies and the market-oriented reform of energy pricing and develop natural gas and renewable energy to accelerate low-carbon transition.

1. Introduction

With the development of industrialization and the expansion of cities, climate change with global warming as the main characteristic has attracted worldwide attention. Increasing anthropogenic greenhouse gas emissions are the main cause of global warming. According to the Intergovernmental Panel on Climate Change (IPCC) Fifth Assessment Report, CO2 emissions account for more than 70% of anthropogenic greenhouse gas emissions. Fossil fuel combustion is the main source of CO2 emissions. With the depletion of fossil fuels and the threat of climate change, developing the low-carbon economy has become a global trend. Cities are the key areas in which to implement carbon emission reduction, as their CO2 emissions from energy consumption account for more than 70% of global CO2 emissions [1]. Energy-rich cities often rely on resource-based industries for development and follow a high carbonization pattern [2], thus facing huge pressures on low-carbon transition.
As the largest energy consumer and CO2 emitter in the world, China is facing great international pressure on carbon emission reduction. With the economy entering a new stage, the demand for low-carbon development is more urgent in China. The State Council of China issued the 13th Five-Year Plan for Controlling Greenhouse Gas Emissions in 2016. It is clearly proposed that CO2 emissions per unit of GDP by 2020 should be 18% lower than in 2015. Some heavy chemical industries should strive to reach the peak of their CO2 emissions around 2020. Cities produce more than 80% of the total CO2 emissions in China and play an increasingly significant role in implementing national carbon reduction targets [3]. With all cities strictly implementing constraint targets of CO2 emission intensity, the national emission intensity target by 2020 has been achieved. However, many cities in China still rely highly on energy-intensive industries for economic growth, and the carbon lock-in effect has become an important obstacle to reaching CO2 emission peak. The contiguous area of SSIM is one of the most important national energy bases in China. With the large-scale exploitation of coal resources, the coal industry has developed rapidly in Xinzhou, Lvliang, Ordos and Yulin in this contiguous area. In 2017, the output value of the coal industry accounted for more than 40% of total industrial output value in these cities. The development pattern, dominated by the coal industry, causes increasingly prominent structural problems along with difficult low-carbon transition. In recent years, governments have formulated a series of action plans to accelerate structural transformation in the contiguous area of SSIM. Therefore, it is necessary to clarify the main drivers of CO2 emissions and the role of economic structure transformation in carbon emission reduction in the contiguous area of SSIM, so as to find feasible low-carbon transition paths.
Previous studies have analyzed the driving factors of CO2 emissions at different levels. On a global scale, Wang and Ang (2018), Jiang and Guan (2017) and Wang et al. (2017) analyzed changes in CO2 emissions or CO2 emission intensity [4,5,6]. Wang et al. (2017), Andreoni and Galmarini (2016), Solaymani (2019), Rodríguez and Pena-Boquete (2017), Kopidou and Diakoulaki (2017) focused on Brazil, Russia, India and China (BRIC), G7 countries, European Union members, top CO2 emitter countries and emerging countries in East Asia [7,8,9,10,11]. There are also studies on single countries, such as China, the United States, Spain and South Korea [12,13,14,15,16]. Carbon emission reduction in China has attracted more and more attention in recent years. Yuan et al. (2015) found that consumption structure played a significant role in residential CO2 emission growth in the eastern, central and western regions of China [17]. Wu et al. (2018) revealed that CO2 emission growth in machinery manufacturing became slower due to final demand structure and production structure improvement in the south coastal economic zone of China [18]. Wang and Yang (2015) concluded that the effect of the economic structure on CO2 emissions had no clear trend in the Beijing–Tianjin–Hebei economic band [19]. On a city scale, Shen et al. (2018) and Zhao et al. (2010) found that economic structure contributed to carbon emission reduction in the cities of Beijing and Shanghai in China [20,21]. Zhu et al. (2017) proposed that regulating economic structure was one of the most effective strategies for reducing CO2 emissions in cities in the Yangtze River Delta region of China [22]. However, there are few studies on energy-rich cities.
The most widely used methods to analyze drivers of CO2 emissions are econometric methods and decomposition analysis methods. In terms of econometric methods, STIRPAT models are widely used to analyze the effects of population, affluence and technology on CO2 emissions [23,24]. Li et al. (2018) and Zhou et al. (2013) constructed a panel regression method to estimate impacts of these three factors and institutional factors on CO2 emissions [25,26]. Qin et al. (2019) employed a geographically weighted regression method to investigate the effects of population, economy and transportation on CO2 emissions [27]. Lin and Xu (2018) and Xu and Lin (2016) quantified the effects of energy efficiency and structure on CO2 emissions by using the vector auto-regression model [28,29]. However, these models have great uncertainty in selecting indicators and model forms. Decomposition analysis is a popular alternative method. Index decomposition analysis (IDA) [30,31,32,33,34,35] and structural decomposition analysis (SDA) [36,37,38,39,40,41] are mainly employed. IDA can only measure the direct production effect, while SDA can capture the direct and indirect production effects by taking inter-industrial interactions into consideration [6].
Taking energy-rich cities in the contiguous area of SSIM as examples, this study analyzes the main drivers of CO2 emissions and the role of economic structure transformation during 2002–2012 based on the SDA method. Different from previous studies, this study makes new contributions in three aspects. First, there are few studies on carbon emission reduction in energy-rich cities, and this study fills this gap by focusing on Xinzhou, Lvliang, Ordos and Yulin in the contiguous area of SSIM. Second, in light of the limited availability of input–output tables for cities in China, which is significant for structural decomposition analysis, this study compiles CO2 emission input–output tables for the contiguous area of SSIM. Third, although CO2 emission inventories for some cities in China have been provided in several studies [1,3,42,43] and China High Resolution Emission Database (CHRED) has been constructed [44], CO2 emission data at the city level are of lower quality and availability compared with the national and provincial data. Moreover, there is no CO2 emission data covering detailed industries for the contiguous area of SSIM. This study estimates CO2 emissions by 12 energy types and 17 industries for the contiguous area of SSIM. This study helps to better understand the drivers of CO2 emissions in energy-rich cities and provide references for policymaking for low-carbon transition.
The remainder of this paper is organized as follows: the methodology and data are presented in Section 2, the empirical results are discussed in Section 3 and the main conclusions and policy implications are provided in Section 4.

2. Methods and Data

2.1. CO2 Emission Accounts

This study accounts for the CO2 emissions of Xinzhou, Lvliang, Ordos and Yulin in the contiguous area of SSIM based on the IPCC emission factor approach. The formula is as follows:
T C = m , i E m , i × δ m × C V × C E F m × C O F m
where T C is CO2 emissions from energy consumption; E m , i is the consumption of energy type m by industry i ; δ m is the conversion factor of energy type m from physical unit to coal equivalent; C V is the net calorific value; C E F m represents CO2 emission factor of energy type m ; C O F m represents oxidization ratio of energy type m .
Following Shan et al. (2017, 2018), Jing et al. (2018), Tong et al. (2018) [1,3,42,45], this study estimates energy consumption of agriculture, construction and tertiary industries in Xinzhou, Lvliang, Ordos and Yulin by scaling down the corresponding provincial energy balance tables. It is assumed that these cities have the same energy intensity of agriculture, construction and tertiary industry as their provinces. Industrial energy consumption in these cities mainly comes from energy consumption and the transformation tables of industrial enterprises.

2.2. Structural Decomposition Analysis

Several studies including Fan et al. (2019) and Wei et al. (2017) conducted SDA from final demand-side based on the Leontief input–output model [37,40]. Liang et al. (2016), Li et al. (2018) and Zhang (2010) adopted SDA from primary supply-side based on the Ghosh input–output model [14,38,46]. This study decomposes CO2 emissions in Xinzhou, Lvliang, Ordos and Yulin from the supply-side, and the SDA combined with the Ghosh input–output model is used.
CO2 emission input–output tables for Xinzhou, Lvliang, Ordos and Yulin are compiled in this study. There are mainly two steps: compiling the city-level input–output table and placing CO2 emissions by industries at the bottom of city-level input–output table. Input–output surveys are generally time- and labor-consuming. Therefore, non-survey methods have attracted widespread attention [47,48,49,50]. Following Miller and Blair (2009), Chen et al. (2016), Lenzen et al. (2014) and Flegg et al. (2016) [49,51,52,53], this study uses the augmentation of Flegg’s location quotient method (AFLQ) to compile input–output tables for Xinzhou, Lvliang, Ordos and Yulin (see Appendix A for more details).
Based on these cities’ input–output tables, the Ghosh input–output model is constructed as follows:
e Z + V = X
where e is the 1 × n dentity matrix; Z is the n × n intermediate input matrix; V and X represent the primary input matrix and the total input matrix, respectively.
The direct output coefficient matrix A is defined by Formula (3). Then, the total input matrix can also be calculated by Formula (4).
A = X ^ 1 Z
V ( I A ) 1 = X
where ( I A ) 1 is the Ghosh inverse matrix. Denote the Ghosh inverse matrix as G . Its element g i j represents the total output of industry j enabled by the unitary input of industry i .
Then, CO2 emissions of Xinzhou, Lvliang, Ordos and Yulin can be estimated as follows:
T C = V G f
where f is the CO2 emission intensity matrix and represents CO2 emissions per unit of output. Its element f i can be decomposed into:
f i = T C i X i = m T C m , i X i = m E i X i × E m , i E i × T C m , i E m , i
where T C m , i represents CO2 emissions from energy m consumption in industry i ; T C i is the total CO2 emissions in industry i ; X i is the total output of industry i ; E m , i represents energy m consumption in industry i ; E i is the total energy consumption in industry i . Therefore, Formula (5) can also be expressed as:
T C = V G f = V G × ( E F × E S × C E ) = P O P × P G D P × I S × G × E F × E S × C E
where P O P is the population; P G D P is the per capita GDP; I S is the 1 × n economic structure matrix; E F is the n × n energy consumption intensity matrix, and represents energy consumption per unit of output; E S is the n × m energy consumption structure matrix; C E represents CO2 emissions per unit of energy consumption.
Changes in CO2 emissions from year t 0 to year t 1 can be calculated as follows:
Δ T C = T C 1 T C 0 = P O P 1 × P G D P 1 × I S 1 × G 1 × E F 1 × E S 1 × C E 1 P O P 0 × P G D P 0 × I S 0 × G 0 × E F 0 × E S 0 × C E 0 = C Δ P O P + C Δ P G D P + C Δ I S + C Δ G + C Δ E F + C Δ E S + C Δ C E
C Δ P O P , C Δ P G D P , C Δ I S , C Δ G , C Δ E F , C Δ E S and C Δ C E represent the contributions of population, economic growth, economic structure, production output structure, energy consumption intensity, energy consumption structure and CO2 emissions per unit of energy consumption to CO2 emission changes, respectively.
Superscripts one and zero represent years t 1 and t 0 , respectively. CO2 emissions per unit of energy consumption are constant during the study period. Therefore, the value of C Δ C E is zero. CO2 emission changes can be attributed to scale effect ( C Δ P G D P and C Δ P O P ), structural effect ( C Δ I S , C Δ G and C Δ E S ) and intensity effect ( C Δ E F ).
Following Chen et al. (2019), Jiang and Guan (2017), Xu et al. (2017) and Yuan et al. (2015) [5,17,36,54], this study uses the pole decomposition method to estimate the contributions of factors to CO2 emissions. The formula is as follows:
C Δ P G D P = 1 2 × ( P O P 1 × Δ P G D P × I S 0 × G 0 × E F 0 × E S 0 × C E 0 + P O P 0 × Δ P G D P × I S 1 × G 1 × E F 1 × E S 1 × C E 1 )
C Δ P O P = 1 2 × ( Δ P O P × P G D P 0 × I S 0 × G 0 × E F 0 × E S 0 × C E 0 + Δ P O P × P G D P 1 × I S 1 × G 1 × E F 1 × E S 1 × C E 1 )
C Δ I S = 1 2 × ( P O P 1 × P G D P 1 × Δ I S × G 0 × E F 0 × E S 0 × C E 0 + P O P 0 × P G D P 0 × Δ I S × G 1 × E F 1 × E S 1 × C E 1 )
C Δ G = 1 2 × ( P O P 1 × P G D P 1 × I S 1 × Δ G × E F 0 × E S 0 × C E 0 + P O P 0 × P G D P 0 × I S 0 × Δ G × E F 1 × E S 1 × C E 1 )
C Δ E S = 1 2 × ( P O P 1 × P G D P 1 × I S 1 × G 1 × E F 1 × Δ E S × C E 0 + P O P 0 × P G D P 0 × I S 0 × G 0 × E F 0 × Δ E S × C E 1 )
C Δ E F = 1 2 × ( P O P 1 × P G D P 1 × I S 1 × G 1 × Δ E F × E S 0 × C E 0 + P O P 0 × P G D P 0 × I S 0 × G 0 × Δ E F × E S 1 × C E 1 )

2.3. Data Sources

Input–output tables are compiled every five years in China, and the latest tables are from 2012. Based on the input–output tables of Shanxi and Shaanxi Provinces, and Inner Mongolia Autonomous Region in 2002 and 2012, this study compiles CO2 emission input–output tables for Xinzhou, Lvliang, Ordos and Yulin. The total output, added value and population data of these cities can be collected from the Xinzhou Statistical Yearbooks (2008, 2013), Lvliang Statistical Yearbooks (2001–2005, 2012), Ordos Statistical Yearbooks (2003, 2013) and Yulin Statistical Yearbooks (2002, 2012). The added value data for China can be obtained from the China Statistical Yearbooks (2003, 2013). All economic data were converted into constant prices in 2002 using price indices.
Energy consumption data are derived from the above-mentioned statistical yearbooks and China Energy Statistical Yearbooks (2000–2002, 2013). This study accounts for CO2 emissions by 12 energy types and 17 industries for Xinzhou, Lvliang, Ordos and Yulin. The energy types, industrial classification and their codes are presented in Appendix B Table A1 and Table A2. The conversion factors of energy consumption from physical units to the coal equivalent are from China Energy Statistical Yearbooks (2013). CO2 emission factors are from the IPCC Guidelines for National Greenhouse Gas Inventories (2006). The CO2 emission factor of heat is estimated by dividing CO2 emissions from energy consumption in the heat production process by the heat production amount. The CO2 emission factor of electricity is obtained from the Baseline Emission Factors for Regional Power Grids in China. The oxidization ratio of fuel combustion is derived from the Provincial Greenhouse Gas Inventory Compilation Guidelines issued by the National Development and Reform Commission of the People’s Republic of China.

3. Results and Discussion

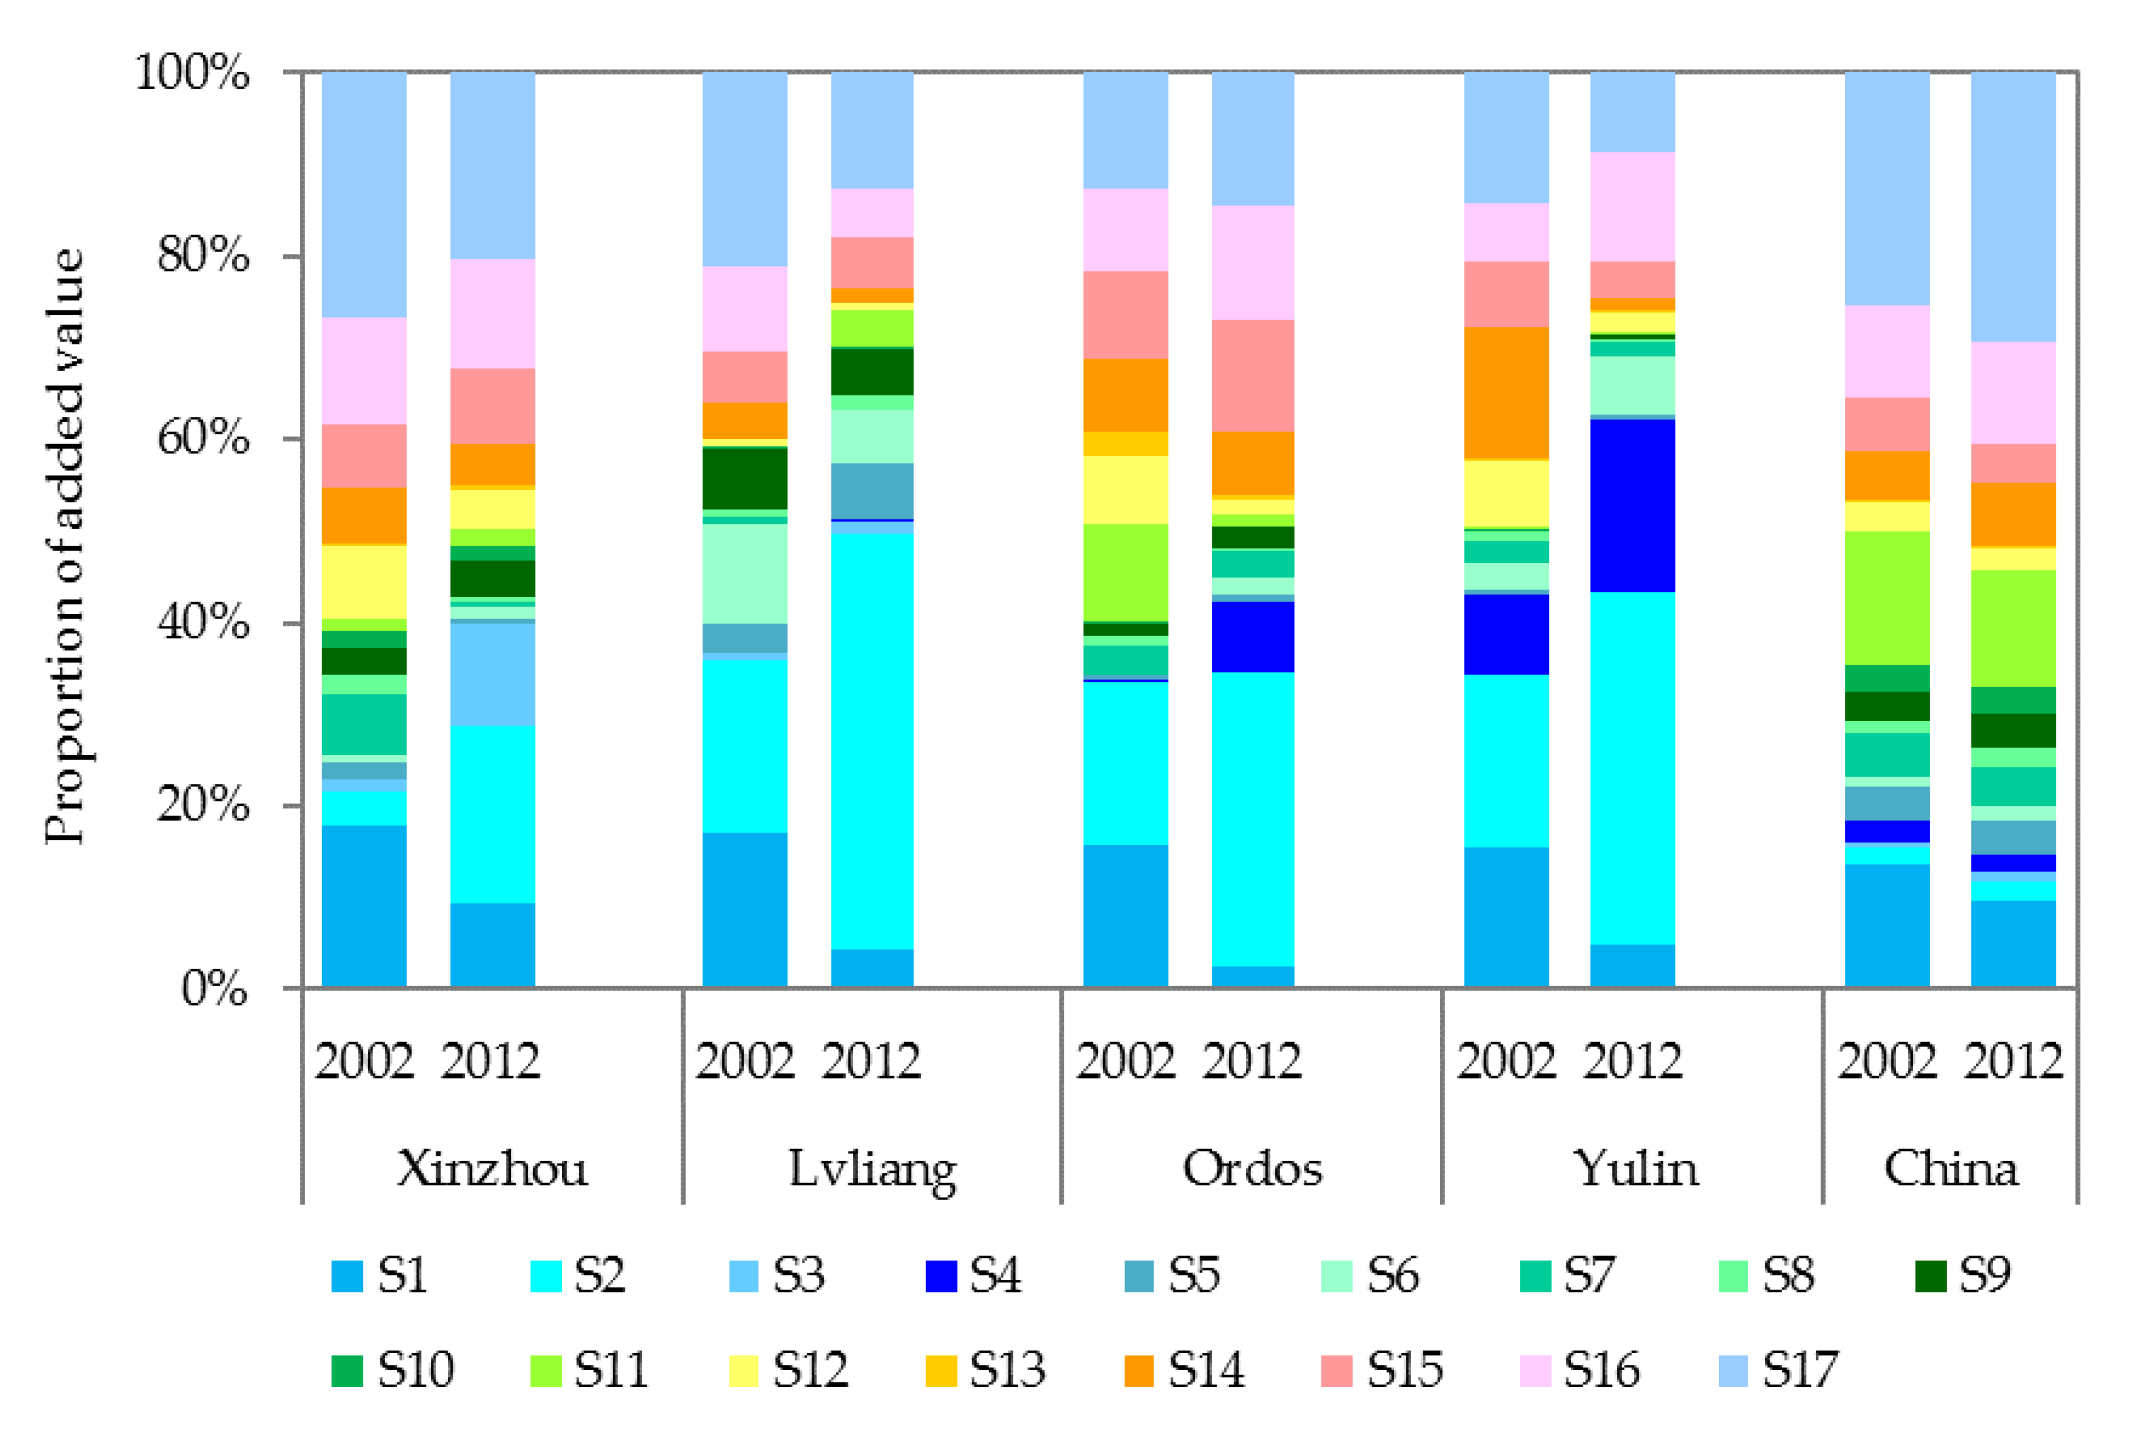
3.1. Economic Structure and CO2 Emissions Characteristics

The proportion of coal mining and washing in economic growth in the contiguous area of SSIM was much higher than the national level. The most prominent change in economic structure in the contiguous area was the expansion of coal mining and washing and the decline of agriculture. As shown in Figure 1, coal mining and washing (S2) in Xinzhou accounted for 19.21% of GDP in 2012, rising by 16% compared with 2002. Metal ore mining and processing (S3) also showed an obvious upward trend. The proportions of coal mining and washing (S2) in Lvliang and Ordos increased by 27% and 14%, respectively, reaching 45.42% and 32.04% in 2012. The proportion of coal mining and washing (S2) in Yulin was 38.47% in 2012, with an increase of 20% during the study period. Mining and processing of nonmetal ores and other ores (S4) also expanded. However, farming, forestry, animal husbandry and fishery (S1) shrank greatly. Manufacturing development in the contiguous area was still weak. The proportions of manufacturing (S5–S11) in GDP in Xinzhou, Lvliang, Ordos and Yulin were 10.24%, 22.76%, 9.56% and 9.55%, respectively, in 2012, lower than the national level (31.10%). Meanwhile, the proportion of other services (S17) in these cities was 10%–20% lower than the national level (29.45%).
CO2 emissions in the contiguous area of SSIM showed a significant growth trend. As shown in Figure 2, CO2 emissions in Ordos were 110.83 Mt in 2012, with an increment of 90.72 Mt. CO2 emissions in Lvliang and Yulin increased by 42.65 and 50.27 Mt, respectively, reaching 68.42 Mt and 66.33 Mt in 2012. CO2 emission increment in Xinzhou was the lowest (12.90 Mt), and its CO2 emissions were 31.31 Mt in 2012.

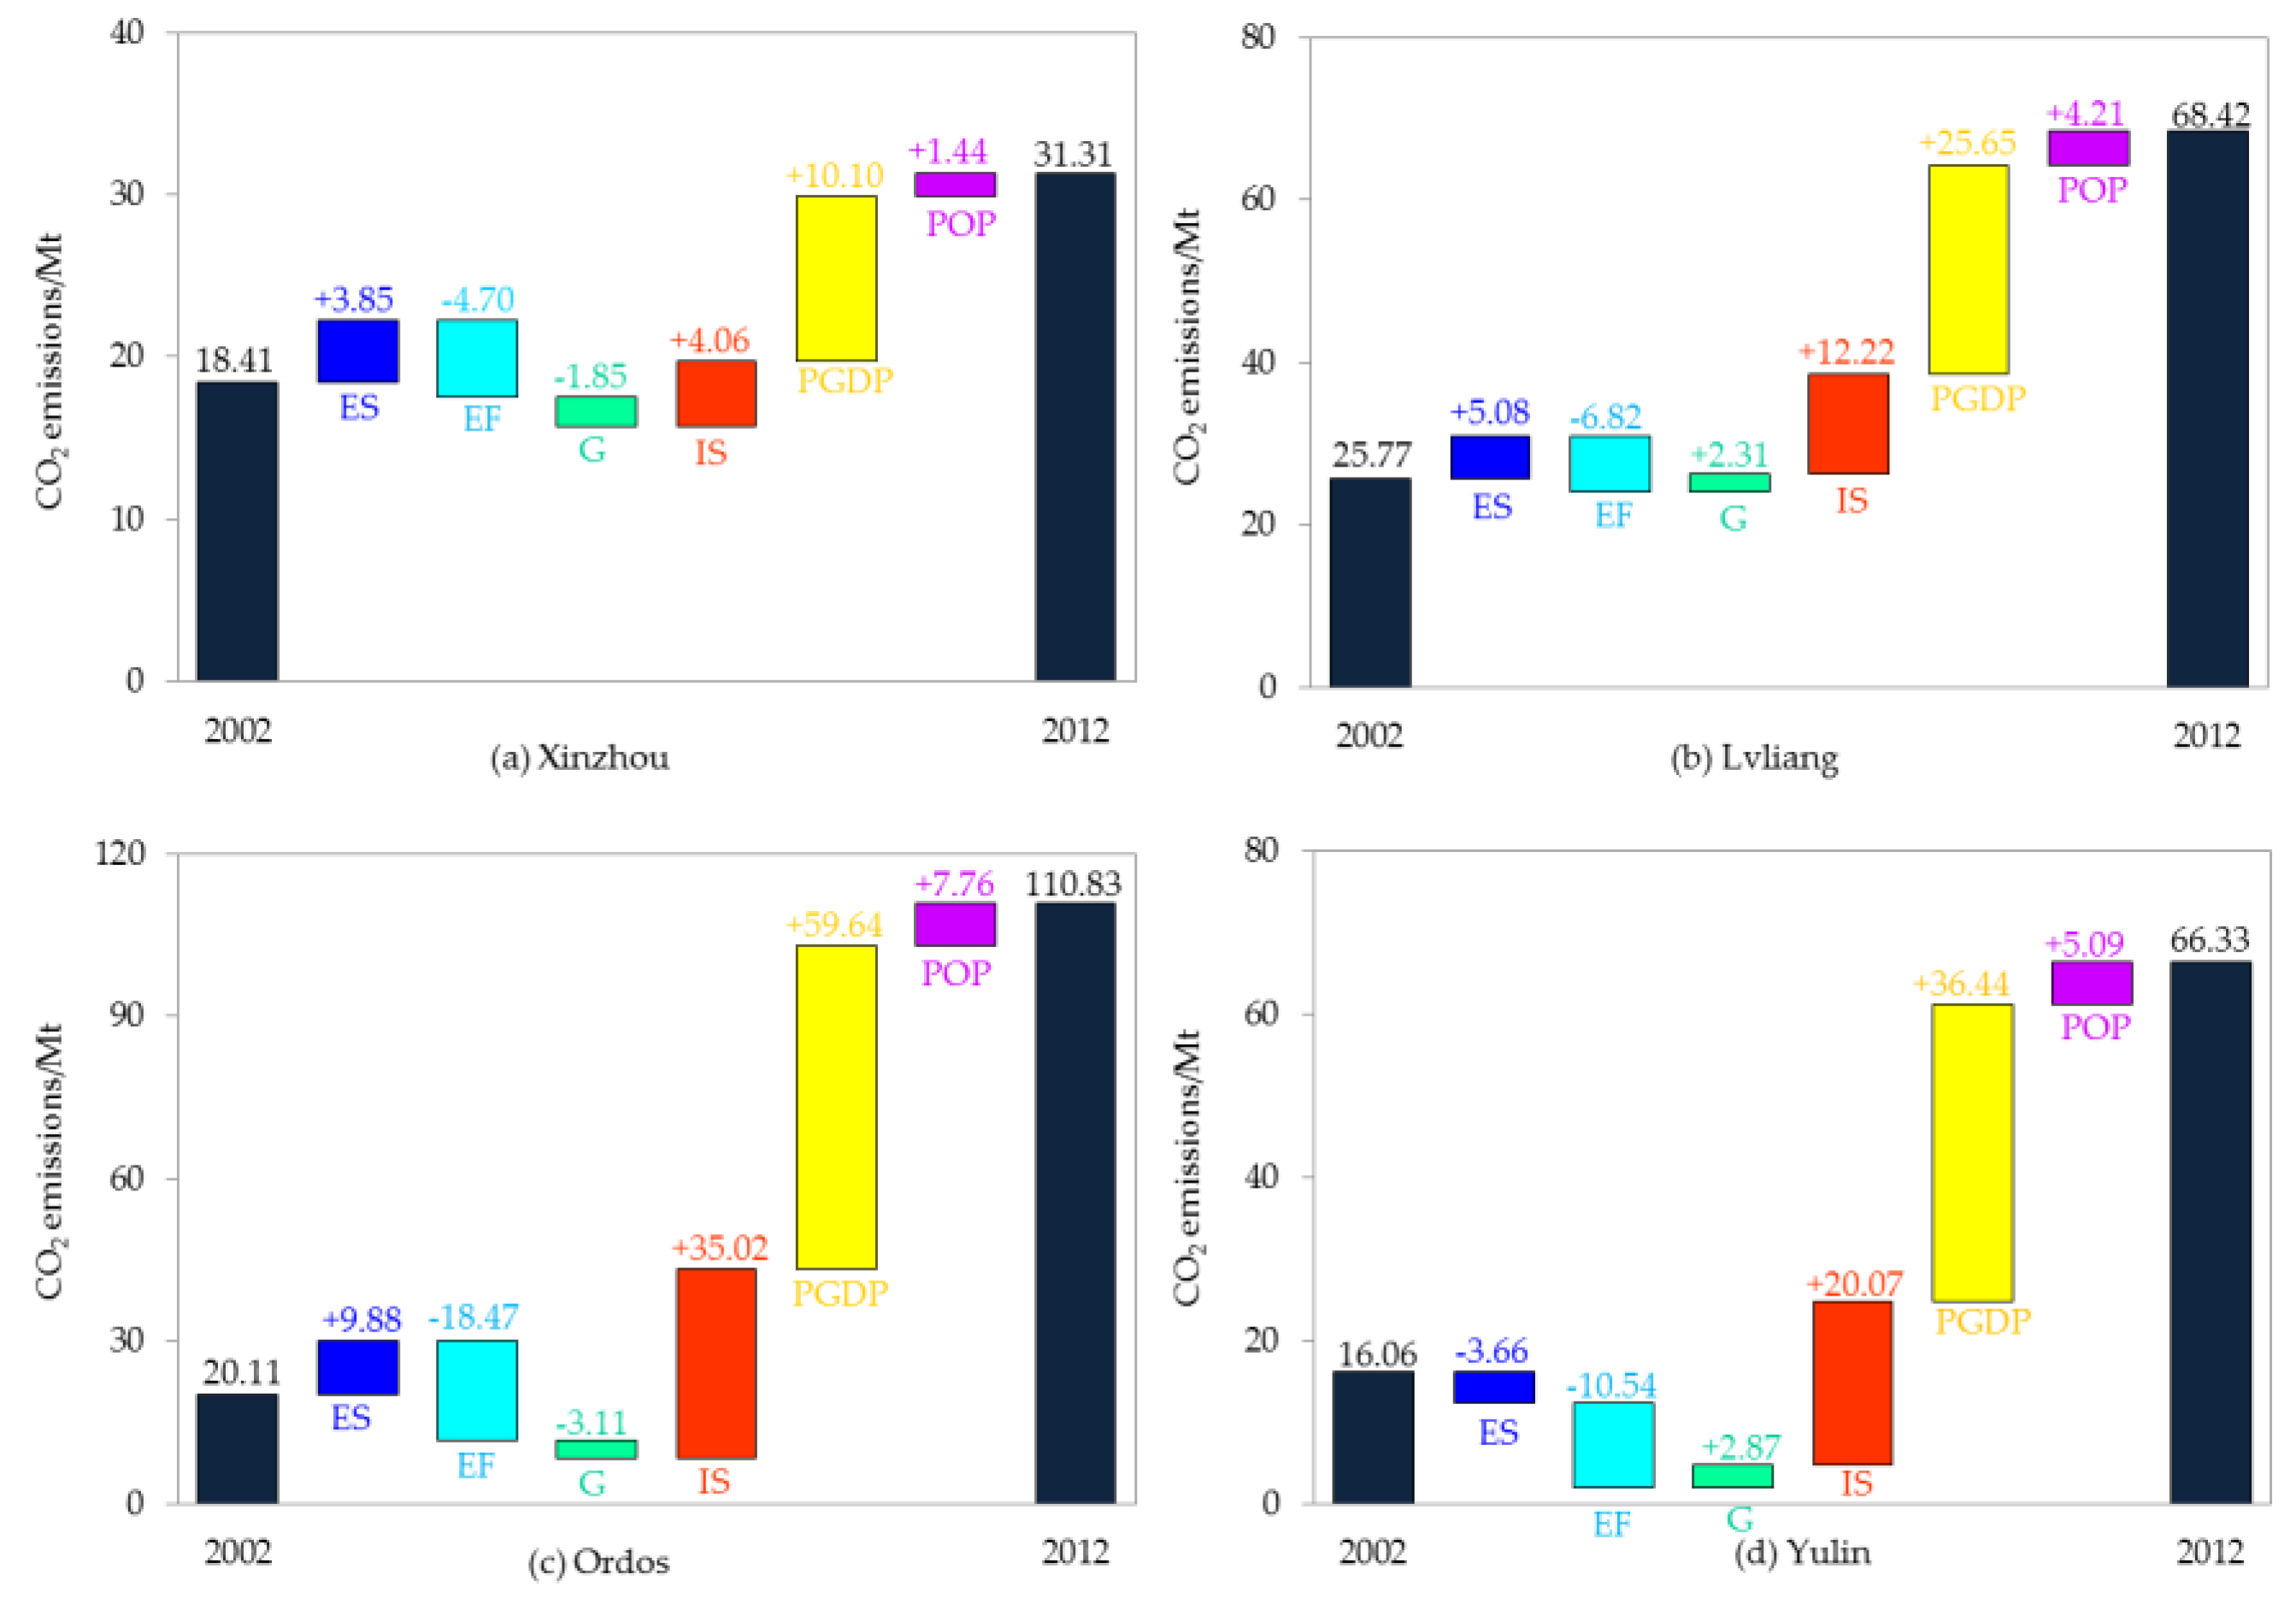
3.2. The Main Drivers Of CO2 Emission Increments

Economic growth is the main driver of CO2 emission increases in energy-rich cities in the contiguous area of SSIM. As shown in Figure 3, per capita GDP caused 59.64 Mt, 36.44 Mt, 25.65 Mt and 10.10 Mt CO2 emission increments in Ordos, Yulin, Lvliang and Xinzhou, respectively, from 2002 to 2012. This is consistent with Wang et al. (2017), Shen et al. (2018) and Xu et al. (2016) [13,20,27]. During the study period, the coal market was in a golden development period in China. The average annual growth rate of the economy was more than 10%, even up to about 20% in the contiguous area of SSIM. This rapid economic growth inevitably leads to a large amount of CO2 emissions.
Economic structure also plays a significant role in driving CO2 emission growth. Changes in economic structure contributed to 35.02, 20.07, 12.22 and 4.06 Mt CO2 emission increments in Ordos, Yulin, Lvliang and Xinzhou, respectively, from 2002 to 2012. This is different from Zhang et al. (2018), Lu et al. (2015) and Chen et al. (2016) [33,55,56], who found economic structure has an inhibition effect on CO2 emission growth. This difference is mainly attributed to the different characteristics of economic structure changes. During the study period, the coal industry in the contiguous area of SSIM expanded significantly and theeconomic structure became more carbon intensive.
Energy structure has a positive effect on CO2 emission growth in most cities in the contiguous area of SSIM. An energy consumption structure dominated by coal led to 9.88, 5.08 and 3.85 Mt CO2 emission increments in Ordos, Lvliang and Xinzhou, respectively, from 2002 to 2012. However, energy structure improvement had the opposite effect on CO2 emissions in Yulin. This is mainly due to the decline in coal consumption proportion and the significant increase in natural gas consumption in Yulin.
Energy consumption intensity is the main factor reducing CO2 emissions in the contiguous area of SSIM. Energy consumption intensity reduced CO2 emissions by 18.47, 10.54, 6.82 and 4.70 Mt in Ordos, Yulin, Lvliang and Xinzhou, respectively, from 2002 to 2012. This is in accordance with Shen et al. (2018), Xu et al. (2017) and Zhu et al. (2017) [20,22,54]. Governments in Xinzhou, Lvliang, Ordos and Yulin have clearly set up constraint targets of energy conservation in different stages since 2005. As a result, energy efficiency has improved significantly.
The production output structure has different effects on CO2 emissions in energy-rich cities. The improvement of the production output structure reduced CO2 emissions in Xinzhou (−1.85) and Ordos (−3.11 Mt). However, the production output structure still positively affected CO2 emissions in Lvliang and Yulin. Therefore, the product supply chain should be taken into consideration in promoting carbon emission reduction. Population has slight promotion effects on CO2 emissions in Xinzhou (1.44), Lvliang (4.21), Ordos (7.76) and Yulin (5.09 Mt). The population in the contiguous area of SSIM grew slowly during the study period. In recent years, population loss has even occurred.
The scale effect contributes most to CO2 emission growth, followed by the structural effect, while the intensity effect offsets the growth to some extent. The scale effect drove CO2 emissions to increase by 11.54, 29.86, 67.40 and 41.53 Mt, respectively, in Xinzhou, Lvliang, Ordos and Yulin, and the structural effect also caused an increase of 6.06, 19.61, 41.79 and 19.28 Mt in these cities, respectively. However, the inhibition effect of energy intensity on CO2 emissions was significantly smaller than the promotion effect of scale and structure.

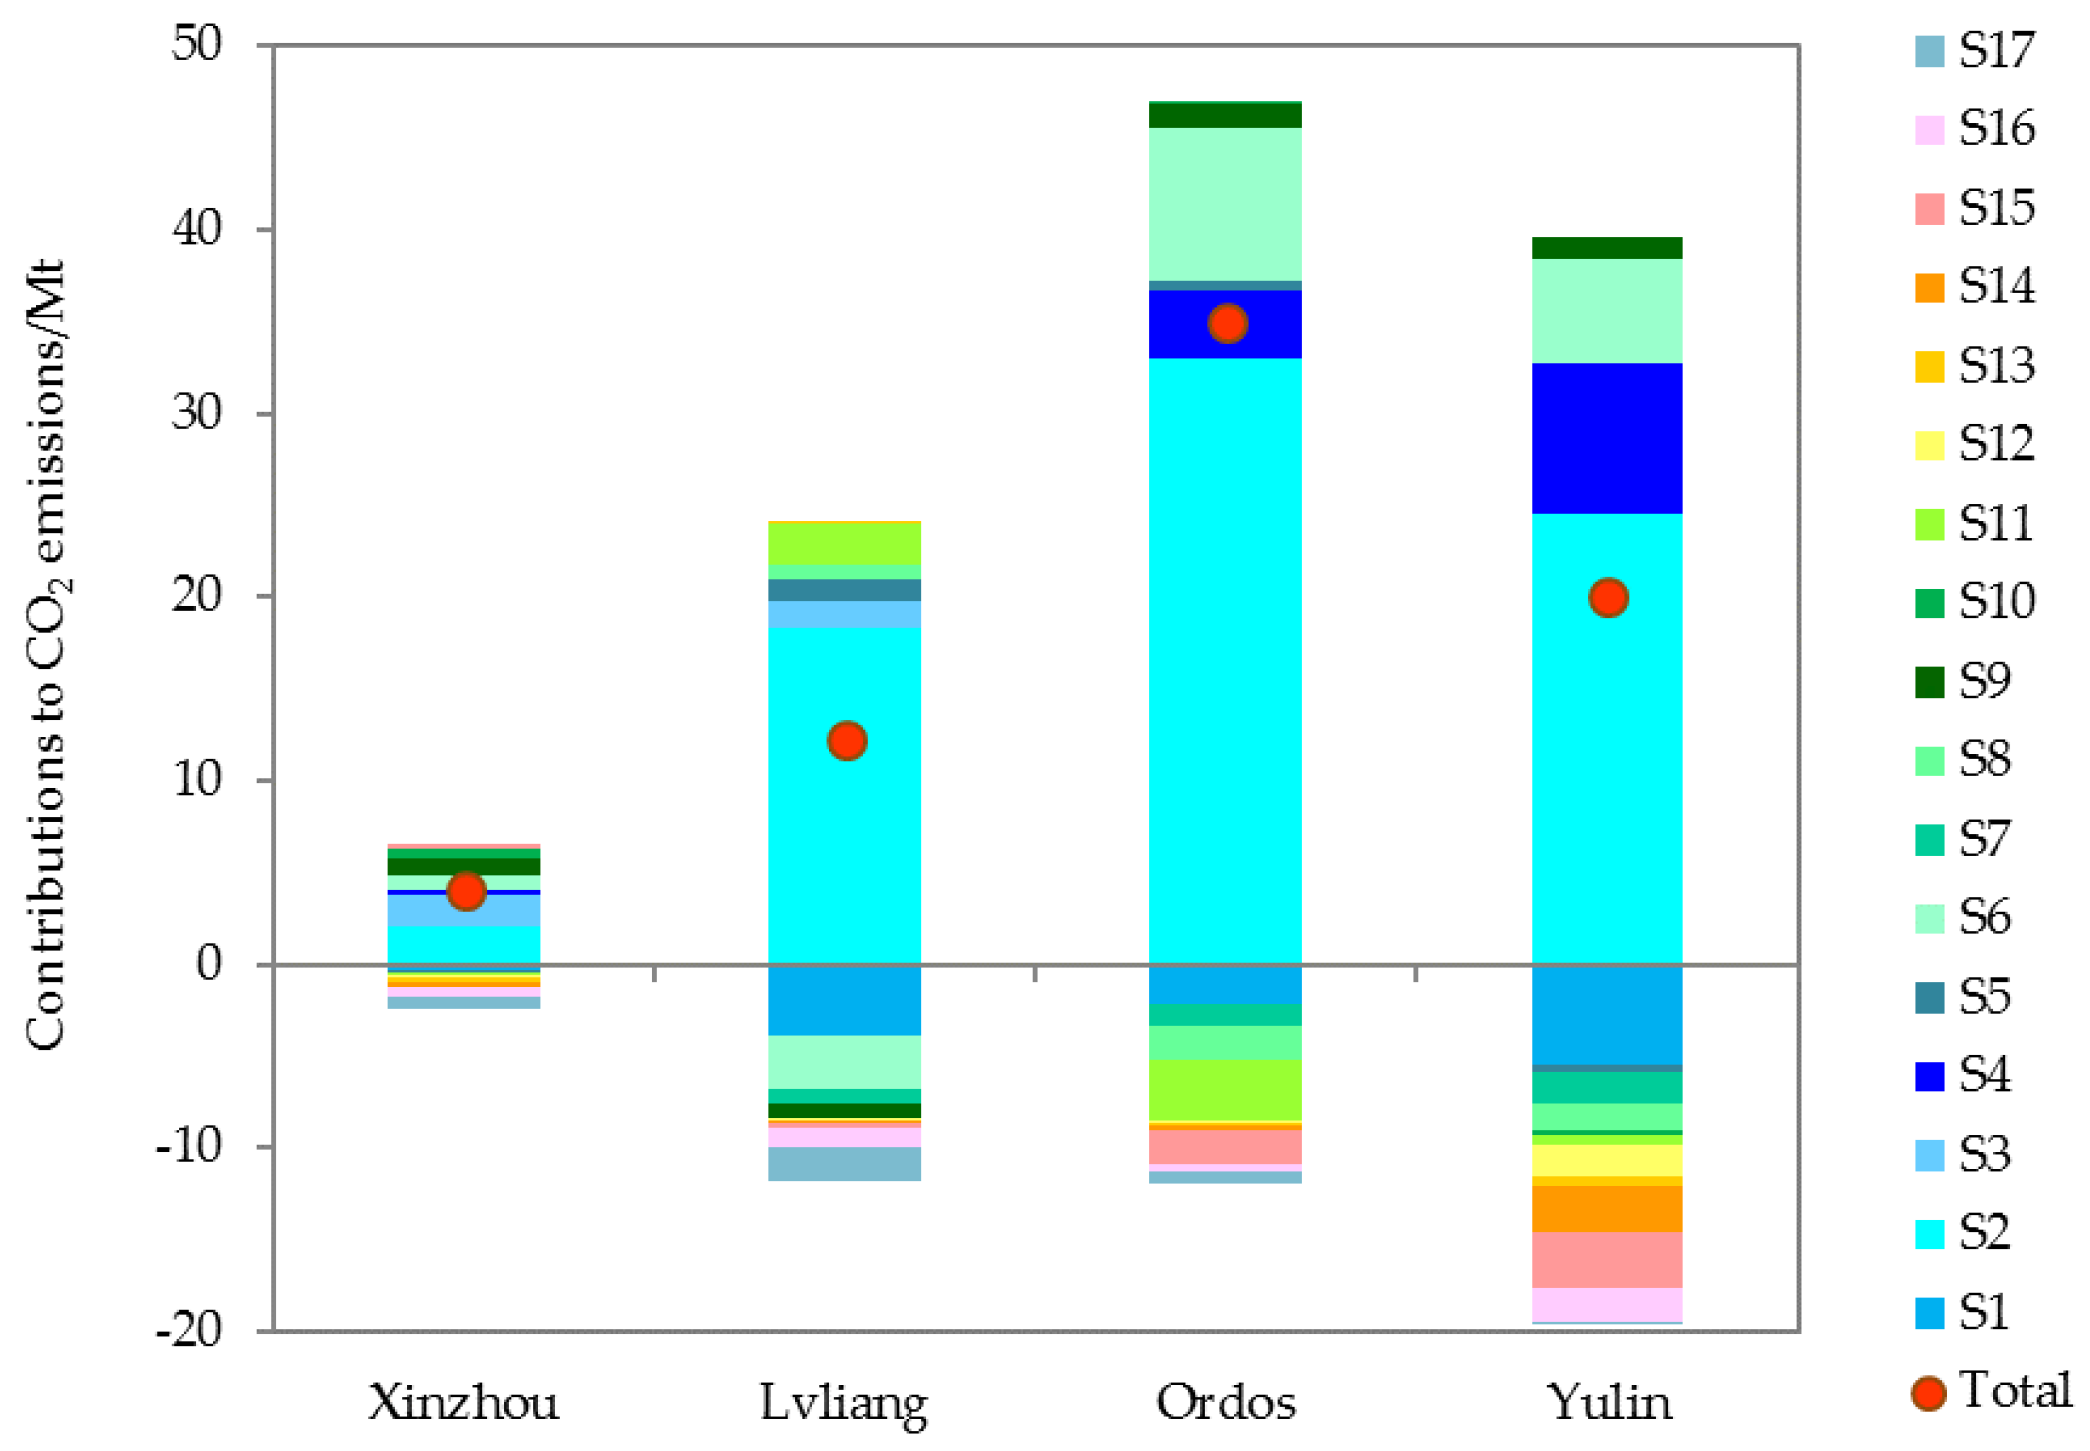
3.3. Contribution of Different Industries to CO2 Emissions

Economic structure plays an important role in the high carbonization of Xinzhou, Lvliang, Ordos and Yulin. This study further analyzes the contribution of changes in the proportion of different industries in economic growth to CO2 emissions. As shown in Figure 4, coal mining and washing (S2) and metal ore mining and processing (S3) were the main industries driving CO2 emission growth in Xinzhou. The remarkable expansion of S2 and S3 caused 2.10 and 1.71 Mt CO2 emission increments, respectively, from 2002 to 2012. On the contrary, farming, forestry, animal husbandry and fishery (S1) and services (S16 and S17) contributed most to carbon emission reduction (−1.54 Mt).
The positive effects of economic structure on CO2 emissions in Lvliang and Ordos are determined by coal mining and washing. Coal mining and washing (S2) led to an increase in CO2 emissions by 18.30 Mt from 2002 to 2012 in Lvliang. Farming, forestry, animal husbandry and fishery (S1), the processing of petroleum, coking, processing of nuclear fuel (S6) and the tertiary industry contributed to reducing CO2 emissions by 9.96 Mt. Coal mining and washing (S2) and the processing of petroleum, coking, processing of nuclear fuel (S6) had the largest positive effects on CO2 emission increments in Ordos (32.96 and 8.36 Mt, respectively), which was offset by farming, forestry, animal husbandry and fishery (S1) and other manufacture (S11) to some extent (−5.51 Mt).
Mining and processing industries are the largest contributors to CO2 emission growth in Yulin. Coal mining and washing (S2) and the mining and processing of nonmetal ores and other ores (S4) had great positive effects on CO2 emissions from 2002 to 2012, which caused 24.59 and 8.09 Mt CO2 emission increments, respectively. Farming, forestry, animal husbandry and fishery (S1) and services showed certain carbon emission reduction effects (−10.41 Mt).

4. Conclusions and Policy Implications

Taking Xinzhou, Lvliang, Ordos and Yulin in the contiguous area of SSIM as examples, this study explores the main drivers of CO2 emissions and the role of economic structure transformation in carbon emission reduction. The CO2 emission input–output tables of these cities for 2002 and 2012 are compiled. Then, the SDA combined with the Ghosh input–output model is constructed to decompose CO2 emission increments in these cities from 2002 to 2012. The main conclusions can be drawn as follows:
(1) CO2 emissions from energy consumption in energy-rich cities increase significantly with the expansion of the coal industry. Ordos had the largest increase in CO2 emissions (90.72), followed by Yulin (50.27) and Lvliang (42.65 Mt). Xinzhou had the smallest CO2 emission increments (12.90 Mt);
(2) Economic growth and structure changes are the main factors driving CO2 emission growth, and energy consumption intensity contributes most to carbon emission reduction in energy-rich cities. An energy structure dominated by coal resources has a small promotion effect on CO2 emission increments. Production output structure could also cause CO2 emission increases if more products flow to carbon-intensive industries;
(3) Mining and primary energy processing industries, including coal and nonmetal ore mining, and petroleum, coking, and nuclear fuel processing, play the most significant role in CO2 emission increments. Agriculture and services have the largest effects on carbon emission reduction. However, mining and primary energy processing industries are carbon-intensive, and their effects on CO2 emissions are far greater than the emission reduction effects of agriculture and services.
Based on these findings, the following policy implications are proposed.
First, energy-driven economic growth patterns must be transformed in energy-rich cities. With the depression of the coal market, the economic growth rate in the contiguous area of SSIM has declined sharply since 2012. Therefore, energy-rich cities must make efforts to transform the economy from energy-driven to innovation-driven in order to achieve sustainable development.
Second, energy-rich cities must accelerate economic structure transformation for carbon emission reduction. Government departments should strengthen the upgrading of the traditional coal industry. Small plants with high emissions should be closed or merged. Meanwhile, backward production capacity and its related facilities should be phased out gradually. Energy performance contracting can be carried out in high energy-consuming enterprises. More efforts should be made to cultivate new pillar industries by developing high-end manufacturing.
Third, investment in science and technology should be increased to improve energy efficiency. During the study period, energy efficiency in the contiguous area of SSIM was obviously improved by strengthening the application of energy-saving technologies. However, the energy consumption intensity of coal mining, the processing of petroleum, coking, processing of nuclear fuel and the production and supply of electricity was still high. Therefore, more funds should be invested in the research and development of key technologies for the efficient and clean use of coal. For example, the low-temperature power generation of coal gangue-fired circulating sulfurization bed technology can be developed. In addition, the market-oriented reform of energy pricing should be implemented. Increasing fossil fuel prices moderately will provide incentives for energy-intensive industries to improve energy efficiency.
Finally, governments should vigorously support the improvement of energy structure and product allocation structure in energy-rich cities. Fiscal policies, such as investment subsidies, financial discounts, tax preferences and price subsidies can be implemented to develop natural gas and renewable energy (wind power, photovoltaic power). Additionally, energy structure adjustment has been paid more attention by strictly controlling the total consumption of coal and promoting new energy power projects since 2012. Moreover, higher income taxes should be levied to prevent enterprises from selling too many products to carbon-intensive enterprises.

Author Contributions

Conceptualization, H.Z., L.S. and S.Z.; methodology, H.Z.; software, H.Z.; validation, S.Z.; formal analysis, H.Z.; investigation, H.Z. and S.Z.; resources, L.S.; data curation, H.Z.; writing—original draft preparation, H.Z.; writing—review and editing, H.Z., S.Z. and A.E.; visualization, H.Z., L.S. and A.E.; supervision, L.S.; project administration, L.S.; funding acquisition, L.S. All authors have read and agreed to the published version of the manuscript.

Funding

This study was funded by National Key Research and Development Program of China (Grant No. 2016YFA0602802), Strategic Priority Research Program of the Chinese Academy of Sciences (Grant No. XDA19040102) and National Natural Science Foundation of China (Grant No. 41771566, 71633006).

Conflicts of Interest

The authors declare no conflict of interest.

Appendix A

The key to compiling the city-level input–output table is to estimate the intermediate input matrix. The calculation method in early studies is to use simple location quotient (SLQ) to regionalize the national input–output table [57,58]. The formula of SLQ is as follows:
S L Q i r = X i r / X r X i n / X n
where X i r represents the output of industry i in region (city) r ; X r is the total output in region (city) r ; X i n represents the output of industry i in the country (province); X n is the total output in the country (province).
Based on SLQ, the cross-industry quotient (CIQ) is developed by taking the relative importance of supply industries and purchase industries into consideration. CIQ is defined as:
C I Q i j r = X i r / X i n X j r / X j n
where i and j represent supply industries and purchase industries, respectively.
A large number of studies have found that both SLQ and CIQ underestimate the interregional economic interactions [49,59]. Flegg et al. (1995) modified the location quotients and proposed FLQ formula as follows [60]:
F L Q i j r = C I Q i j r × λ   ( i j )
F L Q i j r = S L Q i r × λ   ( i = j )
λ = [ log 2 ( 1 + X r X n ) ] δ
The range of δ is defined as [0,1). With δ rising, the import in region (city) r will also increase. McCann and Dewhurst (1998) argued that regional specialization might lead to a regional intermediate input coefficient higher than the national coefficient [61]. Thus, Flegg and Webber (2000) adjusted the FLQ [50]. The augmentation of Flegg’s location quotient (AFLQ) is defined as:
A F L Q i j r = { F L Q i j r × log 2 ( 1 + S L Q j r ) S L Q j r > 1 F L Q i j r S L Q j r 1 }
Based on AFLQ, intermediate input coefficients in Xinzhou, Lvliang, Ordos and Yulin can be calculated as follows:
a i j r = A F L Q i j r × a i j n
where a i j r is the intermediate input coefficient in city r . a i j n represents the intermediate input coefficient in the province which the city r belongs to.
Intermediate input matrices in Xinzhou, Lvliang, Ordos and Yulin are calculated by multiplying intermediate input coefficients by the total output. According to statistical data of the total intermediate input in Xinzhou, Lvliang, Ordos and Yulin, this study chooses δ with the smallest error.

Appendix B

Table A1. Industrial classification and codes.
CodeIndustry
S1Farming, forestry, animal husbandry and fishery
S2Coal mining and washing
S3Metal ore mining and processing
S4Mining and processing of nonmetal ores and other ores
S5Manufacture of foods and tobacco
S6Processing of petroleum, coking, processing of nuclear fuel
S7Chemical industry
S8Manufacture of nonmetallic mineral products
S9Smelting and pressing of metals
S10General and special purpose machinery
S11Other manufacture
S12Production and supply of electricity and steam
S13Production and supply of gas and water
S14Construction
S15Transportation, storage, and post services
S16Wholesale, retail trade and hotel, restaurants
S17Others
Table A2. Energy types and codes.
CodeEnergy types
E1Raw coal
E2Coal products
E3Coke
E4Coke oven gas
E5Blast furnace gas
E6Natural gas
E7Gasoline
E8Diesel oil
E9Fuel oil
E10Other petroleum products
E11Heat
E12Electricity

References

  1. Shan, Y.; Guan, D.; Liu, J.; Mi, Z.; Liu, Z.; Liu, J.; Schroeder, H.; Cai, B.; Chen, Y.; Shao, S.; et al. Methodology and applications of city level CO2 emission accounts in China. J. Clean. Prod. 2017, 161, 1215–1225. [Google Scholar] [CrossRef] [Green Version]
  2. Mousavi, B.; Lopez, N.S.A.; Biona, J.B.M.; Chiu, A.S.F.; Blesl, M. Driving forces of Iran’s CO2 emissions from energy consumption: An LMDI decomposition approach. Appl. Energy 2017, 206, 804–814. [Google Scholar] [CrossRef]
  3. Shan, Y.; Guan, D.; Hubacek, K.; Zheng, B.; Davis, S.J.; Jia, L.; Liu, J.; Liu, Z.; Fromer, N.; Mi, Z.; et al. City-level climate change mitigation in China. Sci. Adv. 2018, 4, eaaq0390. [Google Scholar] [CrossRef] [PubMed] [Green Version]
  4. Wang, H.; Ang, B.W. Assessing the role of international trade in global CO2 emissions: An index decomposition analysis approach. Appl. Energy 2018, 218, 146–158. [Google Scholar] [CrossRef]
  5. Jiang, X.; Guan, D. The global CO2 emissions growth after international crisis and the role of international trade. Energy Policy 2017, 109, 734–746. [Google Scholar] [CrossRef]
  6. Wang, H.; Ang, B.W.; Su, B. Assessing drivers of economy-wide energy use and emissions: IDA versus SDA. Energy Policy 2017, 107, 585–599. [Google Scholar] [CrossRef]
  7. Wang, J.; Liao, H.; Tang, B.; Ke, R.; Wei, Y. Is the CO2 emissions reduction from scale change, structural change or technology change? Evidence from non-metallic sector of 11 major economies in 1995–2009. J. Clean. Prod. 2017, 148, 148–157. [Google Scholar] [CrossRef]
  8. Andreoni, V.; Galmarini, S. Drivers in CO2 emissions variation: A decomposition analysis for 33 world countries. Energy 2016, 103, 27–37. [Google Scholar] [CrossRef]
  9. Solaymani, S. CO2 emissions patterns in 7 top carbon emitter economies: The case of transport sector. Energy 2019, 168, 989–1001. [Google Scholar] [CrossRef]
  10. Rodríguez, M.; Pena-Boquete, Y. Carbon intensity changes in the Asian Dragons. Lessons for climate policy design. Energy Econ. 2017, 66, 17–26. [Google Scholar] [CrossRef]
  11. Kopidou, D.; Diakoulaki, D. Decomposing industrial CO2 emissions of Southern European countries into production- and consumption-based driving factors. J. Clean. Prod. 2017, 167, 1325–1334. [Google Scholar] [CrossRef]
  12. Mi, Z.; Meng, J.; Guan, D.; Shan, Y.; Liu, Z.; Wang, Y.; Feng, K.; Wei, Y. Pattern changes in determinants of Chinese emissions. Environ. Res. Lett. 2017, 12, 074003. [Google Scholar] [CrossRef]
  13. Xu, S.; He, Z.; Long, R.; Chen, H. Factors that influence carbon emissions due to energy consumption based on different stages and sectors in China. J. Clean. Prod. 2016, 115, 139–148. [Google Scholar] [CrossRef]
  14. Liang, S.; Wang, H.; Qu, S.; Feng, T.; Guan, D.; Fang, H.; Xu, M. Socioeconomic drivers of greenhouse gas emissions in the United States. Environ. Sci. Technol. 2016, 50, 7535–7545. [Google Scholar] [CrossRef] [PubMed] [Green Version]
  15. Cansino, J.M.; Román, R.; Ordóñez, M. Main drivers of changes in CO2 emissions in the Spanish economy: A structural decomposition analysis. Energy Policy 2016, 89, 150–159. [Google Scholar] [CrossRef]
  16. Kim, Y.G.; Yoo, J.; Oh, W. Driving forces of rapid CO2 emissions growth: A case of Korea. Energy Policy 2015, 82, 144–155. [Google Scholar] [CrossRef]
  17. Yuan, B.; Ren, S.; Chen, X. The effects of urbanization, consumption ratio and consumption structure on residential indirect CO2 emissions in China: A regional comparative analysis. Appl. Energy 2015, 140, 94–106. [Google Scholar] [CrossRef]
  18. Wu, Y.; Xiong, Y.; Tian, X.; Liu, Y.; Shi, F. Decoding the carbonization mode of the south coastal economic zone in China from the perspective of a dynamic industrial structure. J. Clean. Prod. 2018, 199, 518–528. [Google Scholar] [CrossRef]
  19. Wang, Z.; Yang, L. Delinking indicators on regional industry development and carbon emissions: Beijing–Tianjin–Hebei economic band case. Ecol. Indic. 2015, 48, 41–48. [Google Scholar] [CrossRef]
  20. Shen, L.; Wu, Y.; Lou, Y.; Zeng, D.; Shuai, C.; Song, X. What drives the carbon emission in the Chinese cities?—A case of pilot low carbon city of Beijing. J. Clean. Prod. 2018, 174, 343–354. [Google Scholar] [CrossRef]
  21. Zhao, M.; Tan, L.; Zhang, W.; Ji, M.; Liu, Y.; Yu, L. Decomposing the influencing factors of industrial carbon emissions in Shanghai using the LMDI method. Energy 2010, 35, 2505–2510. [Google Scholar] [CrossRef]
  22. Zhu, X.; Zou, J.; Feng, C. Analysis of industrial energy-related CO2 emissions and the reduction potential of cities in the Yangtze River Delta region. J. Clean. Prod. 2017, 168, 791–802. [Google Scholar] [CrossRef]
  23. Li, Z.; Shao, S.; Shi, X.; Sun, Y.; Zhang, X. Structural transformation of manufacturing, natural resource dependence, and carbon emissions reduction: Evidence of a threshold effect from China. J. Clean. Prod. 2019, 206, 920–927. [Google Scholar] [CrossRef]
  24. Wang, C.; Wang, F.; Zhang, X.; Yang, Y.; Su, Y.; Ye, Y.; Zhang, H. Examining the driving factors of energy related carbon emissions using the extended STIRPAT model based on IPAT identity in Xinjiang. Renew. Sustain. Energy Rev. 2017, 67, 51–61. [Google Scholar] [CrossRef]
  25. Li, L.; Lei, Y.; Wu, S.; He, C.; Chen, J.; Yan, D. Impacts of city size change and industrial structure change on CO2 emissions in Chinese cities. J. Clean. Prod. 2018, 195, 831–838. [Google Scholar] [CrossRef]
  26. Zhou, X.; Zhang, J.; Li, J. Industrial structural transformation and carbon dioxide emissions in China. Energy Policy 2013, 57, 43–51. [Google Scholar] [CrossRef]
  27. Qin, H.; Huang, Q.; Zhang, Z.; Lu, Y.; Li, M.; Xu, L.; Chen, Z. Carbon dioxide emission driving factors analysis and policy implications of Chinese cities: Combining geographically weighted regression with two-step cluster. Sci. Total Environ. 2019, 684, 413–424. [Google Scholar] [CrossRef]
  28. Lin, B.; Xu, B. Growth of industrial CO2 emissions in Shanghai city: Evidence from a dynamic vector autoregression analysis. Energy 2018, 151, 167–177. [Google Scholar] [CrossRef]
  29. Xu, B.; Lin, B. Reducing carbon dioxide emissions in China’s manufacturing industry: A dynamic vector autoregression approach. J. Clean. Prod. 2016, 131, 594–606. [Google Scholar] [CrossRef]
  30. Zou, J.; Tang, Z.; Wu, S. Divergent leading factors in energy-related CO2 emissions change among subregions of the Beijing–Tianjin–Hebei area from 2006 to 2016: An extended LMDI analysis. Sustainability 2019, 11, 4929. [Google Scholar] [CrossRef] [Green Version]
  31. Le Quéré, C.; Korsbakken, J.I.; Wilson, C.; Tosun, J.; Andrew, R.; Andres, R.J.; Canadell, J.G.; Jordan, A.; Peters, G.P.; Vuuren, D.P. Drivers of declining CO2 emissions in 18 developed economies. Nat. Clim. Chang. 2019, 9, 213–217. [Google Scholar] [CrossRef] [Green Version]
  32. Du, Z.; Lin, B. Analysis of carbon emissions reduction of China’s metallurgical industry. J. Clean. Prod. 2018, 176, 1177–1184. [Google Scholar] [CrossRef]
  33. Chen, L.; Xu, L.; Xu, Q.; Yang, Z. Optimization of urban industrial structure under the low-carbon goal and the water constraints: A case in Dalian, China. J. Clean. Prod. 2016, 114, 323–333. [Google Scholar] [CrossRef]
  34. Shao, S.; Yang, L.; Gan, C.; Cao, J.; Geng, Y.; Guan, D. Using an extended LMDI model to explore techno-economic drivers of energy-related industrial CO2 emission changes: A case study for Shanghai (China). Renew. Sustain. Energy Rev. 2016, 55, 516–536. [Google Scholar] [CrossRef] [Green Version]
  35. Ouyang, X.; Lin, B. An analysis of the driving forces of energy-related carbon dioxide emissions in China’s industrial sector. Renew. Sustain. Energy Rev. 2015, 45, 838–849. [Google Scholar] [CrossRef] [Green Version]
  36. Chen, W.; Lei, Y.; Wu, S.; Li, L. Opportunities for low-carbon socioeconomic transition during the revitalization of Northeast China: Insights from Heilongjiang province. Sci. Total Environ. 2019, 683, 380–388. [Google Scholar] [CrossRef]
  37. Fan, J.; Cao, Z.; Zhang, X.; Wang, J.; Zhang, M. Comparative study on the influence of final use structure on carbon emissions in the Beijing-Tianjin-Hebei region. Sci. Total Environ. 2019, 668, 271–282. [Google Scholar] [CrossRef]
  38. Li, J.; Zhou, H.; Meng, J.; Yang, Q.; Chen, B.; Zhang, Y. Carbon emissions and their drivers for a typical urban economy from multiple perspectives: A case analysis for Beijing city. Appl. Energy 2018, 226, 1076–1086. [Google Scholar] [CrossRef]
  39. Vries de, G.J.; Ferrarini, B. What accounts for the growth of carbon dioxide emissions in advanced and emerging economies? The role of consumption, technology and global supply chain participation. Ecol. Econ. 2017, 132, 213–223. [Google Scholar] [CrossRef]
  40. Wei, J.; Huang, K.; Yang, S.; Li, Y.; Hu, T.; Zhang, Y. Driving forces analysis of energy-related carbon dioxide (CO2) emissions in Beijing: An input-output structural decomposition analysis. J. Clean. Prod. 2017, 163, 58–68. [Google Scholar] [CrossRef]
  41. Tian, X.; Chang, M.; Shi, F.; Tanikawa, H. How does industrial structure change impact carbon dioxide emissions? A comparative analysis focusing on nine provincial regions in China. Environ. Sci. Policy 2014, 37, 243–254. [Google Scholar] [CrossRef]
  42. Jing, Q.; Bai, H.; Luo, W.; Cai, B.; Xu, H. A top-bottom method for city-scale energy-related CO2 emissions estimation: A case study of 41 Chinese cities. J. Clean. Prod. 2018, 202, 444–455. [Google Scholar] [CrossRef]
  43. Xu, X.; Huo, H.; Liu, J.; Shan, Y.; Li, Y.; Zheng, H.; Guan, D.; Ouyang, Z. Patterns of CO2 emissions in 18 central Chinese cities from 2000 to 2014. J. Clean. Prod. 2018, 172, 529–540. [Google Scholar] [CrossRef]
  44. Cai, B.; Liang, S.; Zhou, J.; Wang, J.; Cao, L.; Qu, S.; Xu, M.; Yang, Z. China high resolution emission database (CHRED) with point emission sources, gridded emission data, and supplementary socioeconomic data. Resour. Conserv. Recycl. 2018, 129, 232–239. [Google Scholar] [CrossRef]
  45. Tong, K.; Fang, A.; Li, Y.; Shi, L.; Wang, Y.; Wang, S.; Ramaswami, A. The collective contribution of Chinese cities to territorial and electricity-related CO2 emissions. J. Clean. Prod. 2018, 189, 910–921. [Google Scholar] [CrossRef]
  46. Zhang, Y. Supply-side structural effect on carbon emissions in China. Energy Econ. 2010, 32, 186–193. [Google Scholar] [CrossRef]
  47. Hermannsson, K.; McIntyre, S.G. Local consumption and territorial based accounting for CO2 emissions. Ecol. Econ. 2014, 104, 1–11. [Google Scholar] [CrossRef] [Green Version]
  48. Mukhopadhyay, K. Applications of the Input-Output Framework; Springer: Berlin/Heidelberg, Germany, 2018; pp. 120–185. ISBN 9789811315060. [Google Scholar]
  49. Flegg, A.T.; Mastronardi, L.J.; Romero, C.A. Evaluating the FLQ and AFLQ formulae for estimating regional input coefficients: Empirical evidence for the province of Córdoba, Argentina. Econ. Syst. Res. 2016, 28, 21–37. [Google Scholar] [CrossRef]
  50. Flegg, A.T.; Webber, C.D. Regional size, regional specialization and the FLQ formula. Reg. Stud. 2000, 34, 563–569. [Google Scholar] [CrossRef]
  51. Miller, R.E.; Blair, P.D. Nonsurvey and partial-survey methods: Extensions. In Input-Output Analysis: Foundations and Extensions, 2nd ed.; Miller, R.E., Blair, P.D., Eds.; Cambridge University Press: Cambridge, UK, 2009; pp. 347–398. ISBN 9780521517133. [Google Scholar]
  52. Chen, G.; Wiedmann, T.; Wang, Y.; Hadjikakou, M. Transnational city carbon footprint networks—Exploring carbon links between Australian and Chinese cities. Appl. Energy 2016, 184, 1082–1092. [Google Scholar] [CrossRef] [Green Version]
  53. Lenzen, M.; Geschke, A.; Wiedmann, T.; Lane, J.; Anderson, N.; Baynes, T.; Boland, J.; Daniels, P.; Dey, C.; Fry, J.; et al. Compiling and using input-output frameworks through collaborative virtual laboratories. Sci. Total Environ. 2014, 485–486, 241–251. [Google Scholar] [CrossRef] [PubMed] [Green Version]
  54. Xu, S.; Zhang, L.; Liu, Y.; Zhang, W.; He, Z.; Long, R.; Chen, H. Determination of the factors that influence increments in CO2 emissions in Jiangsu, China using the SDA method. J. Clean. Prod. 2017, 142, 3061–3074. [Google Scholar] [CrossRef]
  55. Zhang, J.; Jiang, H.; Liu, G.; Zeng, W. A study on the contribution of industrial restructuring to reduction of carbon emissions in China during the five Five-Year Plan periods. J. Clean. Prod. 2018, 176, 629–635. [Google Scholar] [CrossRef]
  56. Lu, Q.; Yang, H.; Huang, X.; Chuai, X.; Wu, C. Multi-sectoral decomposition in decoupling industrial growth from carbon emissions in the developed Jiangsu Province, China. Energy 2015, 82, 414–425. [Google Scholar] [CrossRef]
  57. Schaffer, W.A.; Chu, K. Nonsurvey techniques for constructing regional interindustry models. Pap. Reg. Sci. Assoc. 1969, 23, 83–104. [Google Scholar] [CrossRef]
  58. Czamanski, S.; Malizia, E.E. Applicability and limitations in the use of national input-output tables for regional studies. Pap. Reg. Sci. Assoc. 1969, 23, 65–77. [Google Scholar] [CrossRef]
  59. Morrissey, K. Producing regional production multipliers for Irish marine sector policy: A location quotient approach. Ocean Coast. Manag. 2014, 91, 58–64. [Google Scholar] [CrossRef]
  60. Flegg, A.T.; Webber, C.D.; Elliott, M.V. On the appropriate use of location quotients in generating regional input-output tables. Reg. Stud. 1995, 29, 547–561. [Google Scholar] [CrossRef]
  61. Mccann, P.; Dewhurst, J.H.L. Regional size, industrial location and input-output expenditure coefficients. Reg. Stud. 1998, 32, 435–444. [Google Scholar] [CrossRef]
Figure 1. Economic structure changes in the contiguous area of the Inner Mongolia Autonomous Region (SSIM) from 2002 to 2012.
Sustainability 12 01875 g001
Figure 2. CO2 emissions in the contiguous area of SSIM from 2002 to 2012.
Sustainability 12 01875 g002
Figure 3. Contributions of different factors to CO2 emissions in the contiguous area of SSIM from 2002 to 2012.
Sustainability 12 01875 g003
Figure 4. Contributions of different industries to CO2 emission increments in the contiguous area of SSIM from 2002 to 2012.
Sustainability 12 01875 g004

