Article

Analysis of Life Quality in a Tropical Mountain City Using a Multi-Criteria Geospatial Technique: A Case Study of Kandy City, Sri Lanka

1
Department of Environmental Management, Faculty of Social Sciences and Humanities, Rajarata University of Sri Lanka, Mihintale 50300, Sri Lanka
2
Faculty of Life and Environmental Sciences, University of Tsukuba, 1-1-1, Tennodai, Tsukuba, Ibaraki 305-8572, Japan
3
Department of Regional Science and Planning, SANASA Campus, Kegalle 71000, Sri Lanka
*
Authors to whom correspondence should be addressed.
Sustainability 2020, 12(7), 2918; https://0-doi-org.brum.beds.ac.uk/10.3390/su12072918
Submission received: 28 February 2020 / Revised: 31 March 2020 / Accepted: 2 April 2020 / Published: 6 April 2020

Abstract

:
The blooming of urban expansion has led to the improvement of urban life, but some of the negative externalities have affected the life quality of urban dwellers, both directly and indirectly. As a result of this, research related to the quality of life has gained much attention among multidisciplinary researchers around the world. A number of attempts have been made by previous researchers to identify, assess, quantify, and map quality of life or well-being under various kinds of perspectives. The objectives of this research were to create a life quality index (LQI) and identify the spatial distribution pattern of LQI in Kandy City, Sri Lanka. Multiple factors were decomposed, a hierarchy was constructed by the multi-criteria decision making (MCDM) method, and 13 factors were selected under two main criteria—environmental and socioeconomic. Pairwise comparison matrices were created, and the weight of each factor was determined by the analytic hierarchy process (AHP). Finally, gradient analysis was employed to examine the spatial distribution pattern of LQI from the city center to the periphery. The results show that socioeconomic factors affect the quality of life more strongly than environmental factors, and the most significant factor is transportation. The highest life quality zones (26% of the total area) were distributed around the city center, while the lowest zones represented only 9% of the whole area. As shown in the gradient analysis, more than 50% of the land in the first five kilometers from the city center comes under the highest life quality zone. This research will provide guidance for the residents and respective administrative bodies to make Kandy City a livable city. It the constructed model can be applied to any geographical area by conducting necessary data calibration.

1. Introduction

In mid-2019, the world’s population reached 7.7 billion, having added approximately 1 billion people in the last two decades [1]. Twenty-three percent of the world’s population were living in cities in 2018, and this percentage is predicted to reach 66% by 2050 [2]. This means that 43% of the global population will be living in urban regions within roughly 40 years, and it is estimated that the world’s fastest-growing cities will be in Asia and Africa [3]. Cities provide environmentally sound and socially accepted living environments in various ways, but they generate urbanization issues that severely impact the well-being of city dwellers [2,4]. Although developed countries have managed those issues to some extent with their capital power, the situation in most developing countries, especially in Asia, is dilapidated. The lack of socioeconomic and environmental resources in developing countries presents considerable challenges in an urban area. Thus, conducting research related to the well-being of inhabitants in complex urban areas is an important, timely task.
To ensure the well-being of urban inhabitants, various kinds of approaches have been taken following various viewpoints, the details of which can be explored elsewhere [5,6,7,8]. The United Nation’s Habitat Conference presented the concept of city livability (CL) in 1996 and stated that every city should be habitable [9]. Moreover, the following index and approaches provide some indicators to measure the level of livability in a city, such as the gross domestic product (GDP) and the human development index (HDI) [9]. The term “life quality” (LQ) is also used to describe the general well-being of societies and people [10,11]. As LQ is a theoretical concept that remains a significant subjective element, it is difficult to use it to compute measurable dimensions. As a result, there is no accepted definition or adequate measurements of LQ [4]. However, it is widely applied in various subjects using different types of elements and dimensions. Recently, research related to the LQ in urban areas has been given a benchmark by using various kinds of approaches that numerous studies have demonstrated [4,9,12].
Assessing the quality of life or constructing its index is quite a challenging task because it has no pre-defined factors or attributes [4]. On the other hand, measuring LQ is not a one-size-fits-all approach because life quality is the result of a combination of multifactorial attributes that can consist of social, economic, and environmental factors. These factors can depend on each other, or they may be connected directly or indirectly. Moreover, a multifactorial approach can be used in a complex decision-making environment, because each criterion does not contribute to results equally; rather, different criteria make different contributions [9]. Hence, there should be a scientifically sound and mathematically trustworthy approach to evaluate the contribution criteria based on their importance or weight. Nevertheless, humans have some difficulty with simultaneously addressing decisions using many criteria or alternatives because criteria have several uses [9]. The available literature shows that there are various methods for decision making in a multi-criteria environment, including the analytic hierarchy process (AHP) [12,13].
The AHP is a technique used to derive ratio gages from paired comparisons, which were initially developed by Professor Thomas L. Saaty in the 1970s [14]. It allows the criteria weights to be measured through pairwise comparison, which depends on the decisions of experts to regulate the priority ranges [15,16]. In the AHP technique, a hierarchical form, including goals, criteria, sub-criteria, and factors are used to solve every problem [15]. One of the notable leading factors is that the AHP approach allows users to define the weights of variables in the construction of the solution of a multi-criteria problem as a multi-criteria decision making (MCDM) method. Other than this, conventional research based on field surveys is not cost-effective and is a time-consuming task [17]. Because of its applicability, correctness, theoretical suitability, and capacity for addressing any criteria (intangible and tangible), the integration of AHP with MCDM in LQ analysis is still interesting for multi-disciplinary researchers [15,16]. However, such research is lacking in Sri Lanka.
In view of the above aspect, we hypothesized that socioeconomic and environmental factors are mainly influenced by the determination of LQ in urban dwellers in Kandy City, Sri Lanka. Over the past two decades, urbanization has led to rapid development, and several environmental problems, such as urban heat islands [18], increased energy consumption (R1), and reduced air quality [19], have occurred. Thus, LQ requires further study to enhance future urban planning activities. The objectives of this research are as follows: (i) to create an LQ index (LQI) for Kandy City and (ii) to identify the spatial distribution pattern of LQ and its composition along the gradient zones (GZs). We believe that our point of novelty is the incorporation of socioeconomic data to build a socially accepted LQI in Kandy City.

2. Materials and Methods
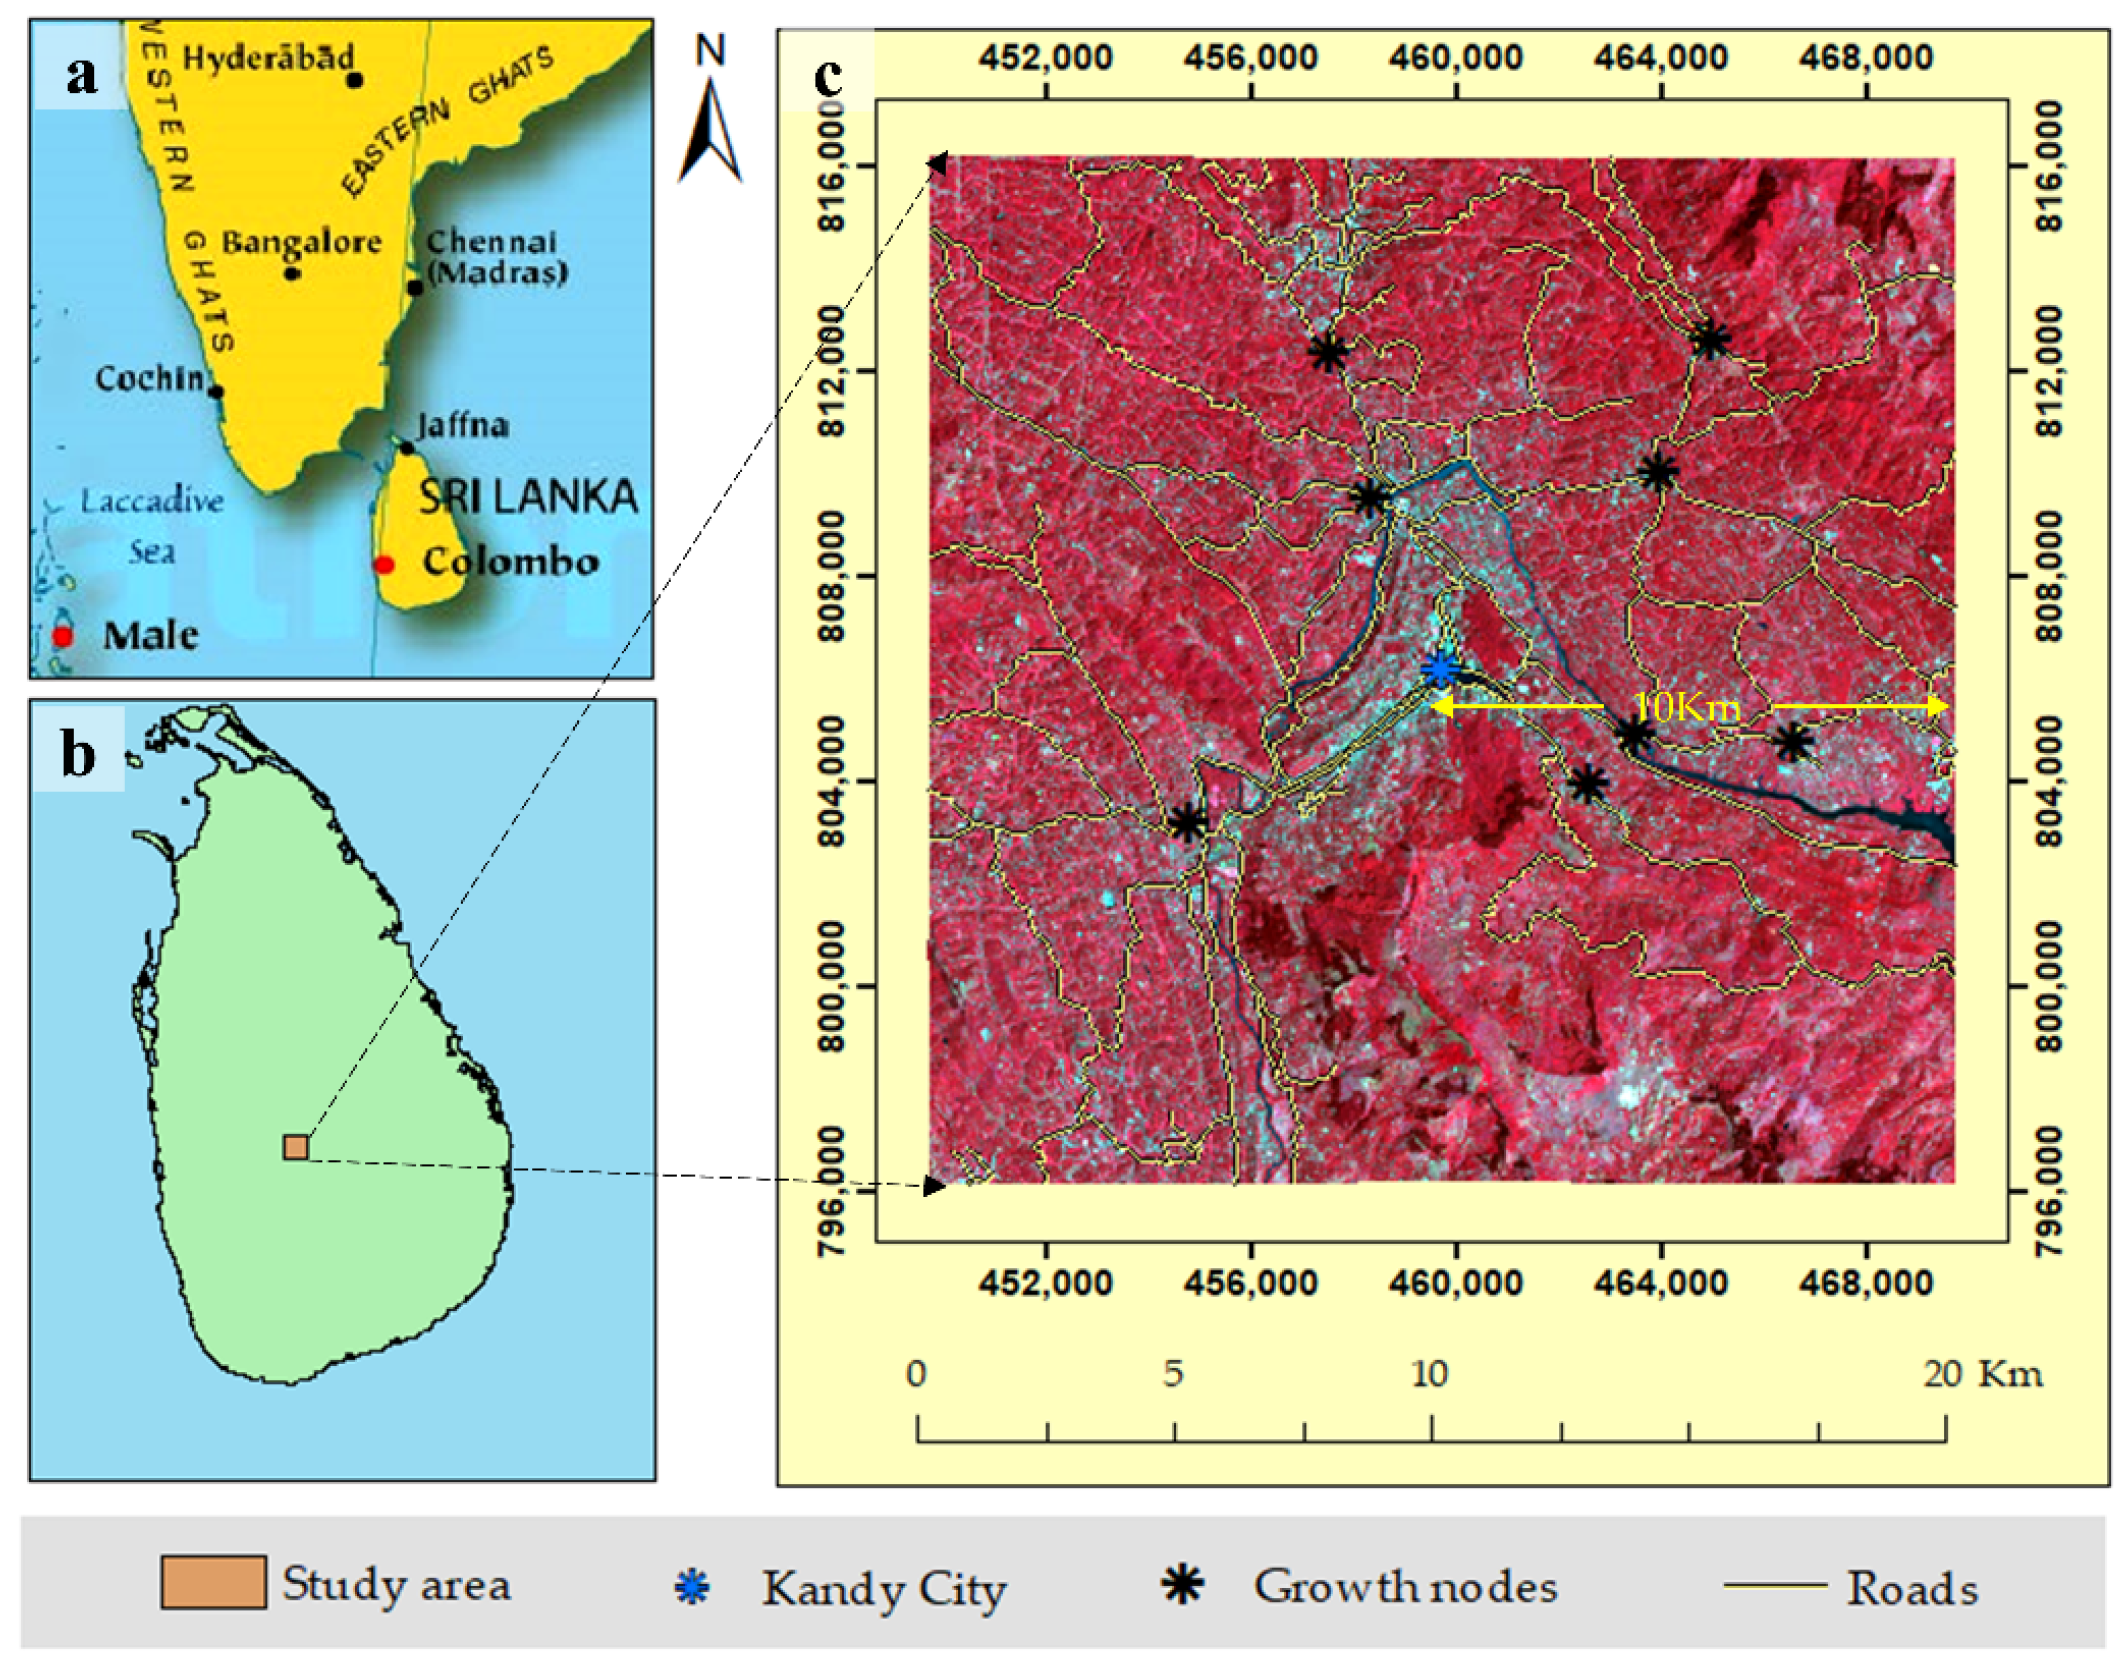
2.1. Study Area

Kandy is the capital and administrative city of the central province. It is the second-largest city in Sri Lanka, located 116 km away from Colombo City [5]. Because it is the home of the temple of the Tooth Relic (Sri Dalada Maligawa) and is a tropical mountain green city, Kandy is identified as an important tourist destination and was declared to be a world heritage site by the United Nations Educational, Scientific and Cultural Organization (UNESCO) [5]. Available literature shows that the estimated population is approximately 1.7 million, and the daily transient population is approximately one million in Kandy City [5]. As a result of the expansion of impervious surfaces and population size, Kandy City has undergone high urbanization growth in the last two decades. However, some of the topographical obstacles (mountain ranges and slopes) and malfunctioning of socioeconomic attributes (infrastructure and services) have been caused by the scarcity of livable resident land. The mean daytime temperature ranges from 28–32 °C, while the average rainfall is approximately 2085 mm (long-term) [20] and 52–398 mm (monthly) [18]. Except for a short, dry period, Kandy City is like other green cities and has a tropical equatorial climate and a monsoon rainfall pattern.
In this study, a geographical area of 400 km2 covering a 20 × 20 km grid with a 10 km radius from the city center was selected as the study area, and it is bound by latitudes from 7.225195° N to 7.360744° N and longitudes from 80.566965° E to 80.702955° E, as illustrated in Figure 1.

2.2. Types of Data and Sources

The research framework was constructed using two strategies; first, we observed regional requirements by consulting with a group of experts and administrative bodies in Kandy City, and second, the residents’ opinions regarding well-being were also observed by conducting informal interviews in both urban and peripheral areas. Then, we realized that the identification of the spatial distribution patterns of LQ would help both administrative bodies and inhabitants to achieve the goal of sustainable urban development.
Regarding this context, 13 factors extracted from socioeconomic and environmental (physical) criteria were evaluated using MCDM model coupling with AHP on the GIS platform. Both primary and secondary data were collected to assess the LQ of residents in Kandy City. In the process, the following steps were completed. To gather primary data, (i) formal interviews were conducted with a group of experts and respective administration bodies to determine the factors related to the AHP and MCDM (Figure 2), (ii) expert’s judgments were collected to complete the AHP questionnaire, and (iii) field observations were conducted to identify the current situation of the study area while interviewing some residents. As an approach for collecting secondary data, (i) literary information was collected, focusing on similar studies, and (ii) geospatial data were collected from respective sources, as explained in Table 1.

2.3. Data Pre-Processing

Both primary and secondary data were carefully checked, and fault-free data sets were rectified. Subsequently, raw data were pre-preceded in order to build factors.

2.3.1. Landsat-8 OLI/TIRS Data

We hypothesized that the use of more Landsat data in order to cover all months in the year would produce a reliable data set. There might be slight seasonal changes in the study area that could affect land use land cover (LULC) and land surface temperature (LST). Hence, obtaining annual average basic data sets is primarily important to generalize the model’s results for the whole year. In this perspective, 2018 was selected as the investigated year, and the following simple steps were accomplished to prepare basic remote sensing (RS) data.
i.
The Google Earth Engine (GEE) was selected because of its free tools and facilitates for radiometric-calibrated and atmospheric-corrected Landsat-8 Level 2 data sets powered by the United States Geological Survey (USGS) [8]. Additionally, it has many functional facilities for handling remote sensing data.
ii.
The research area was imported and checked for areas with cloud disturbance in the available Landsat imagery. Because the study area is located in a tropical region, there was cloud disturbance in the Landsat data [8]. Hence, the masking method was applied to remove the cloud.
iii.
The annual median at-satellite brightness temperature (in Kelvin) and multispectral bands (in radiance values) were computed by using image collection and ee.reducer functions in the GEE [21].
iv.
Prepared data sets were downloaded. Then, (a) calculation of the land surface temperature (LST) and (b) classification of the LULC were carried out.

2.3.2. Land Use Land Cover Classification

i.
A pixel-based supervised classification method was chosen [22]. Because medium- resolution Landsat data were selected, the best approach was to select a pixel-oriented classification method. Other than this, in order to identify precious LULC information as much as possible, the level was very important for the decision-making process.
ii.
Four classification techniques were employed with R software (open source) [23]: (i) support vector machine, (ii) K-nearest neighbor, (iii) random forest, and (iv) neural networks. As a result of the classification, four LULC maps were produced.
iii.
The resultant LULC maps were sorted [5]. Due to the highest values (overall accuracy and kappa coefficient), the map generated by the random forest method was chosen.
iv.
The issues of misclassification error or salt-and-pepper noise made by spectral confusion were resolved by using majority filters and hybrid classification methods [24]. As evidenced by the literature [25,26,27], past researchers have also adopted this method and have gained reliable results. Finally, an accuracy assessment was conducted to test whether the classification results could be trusted.

2.3.3. Retrieval of Land Surface Temperature

The median temperatures (Section 2.3.1) extracted from thermal band 10 (in Kelvin) were used to calculate the LST, as follows:
i.
The land surface emissivity (ε) was calculated using Equation (1):
ε = { mPV + n }
where m = (ε − ε) − (1 − εσ); Fεv and n = εs + (1 − εs) Fεv. εs and εv are the soil emissivity and vegetation emissivity, respectively. In this study, we used the results of [28] for m = 0.004 and n = 0.986. The proportion of vegetation (Pv) was calculated using Equation (2).
ii.
Using Equation (2), the proportion of vegetation (Pv) was computed.
P v = ( ( NDVI NDVI min ) / ( NDVI max NDVI min ) ) 2
where Pv denotes the proportion of vegetation, NDVI refers to the Normalized Difference Vegetation Index, which is calculated using the original NDVI values calculated in Equation (3), and NDVImin and NDVImax are the minimum and maximum values of the NDVI dataset, respectively.
iii.
The NDVI was calculated from Equation (3):
NDVI = ρ NIR ρ Red ρ NIR + ρ Red
where ρNIR refers to the surface reflectance values of band 5, and ρRed refers to the surface reflectance values of band 4 from the Landsat-8 OLI data.
iv.
The emissivity corrected LST was calculated using Equation (4):
LST = T b   / 1 + ( λ   ×   T b   / ρ ) ln ε .
where Tb is the at-satellite brightness temperature in Kelvin; λ is the central-band wavelength of the emitted radiance (11.5 μm for band 6 and 10.8 μm for band 10); ρ is h × c/σ (1.438 × 10⁻² m K) with σ being the Boltzmann constant (1.38 × 10⁻²³ J/K), h being Planck’s constant (6.626 × 10⁻³⁴ J∙s), and c being the speed of light (2.998 × 10⁸ m/s) [29]; ε is the land-surface emissivity estimated using Equation (3). Then, the calculated LST values (Kelvin) were converted to degrees Celsius (°C).

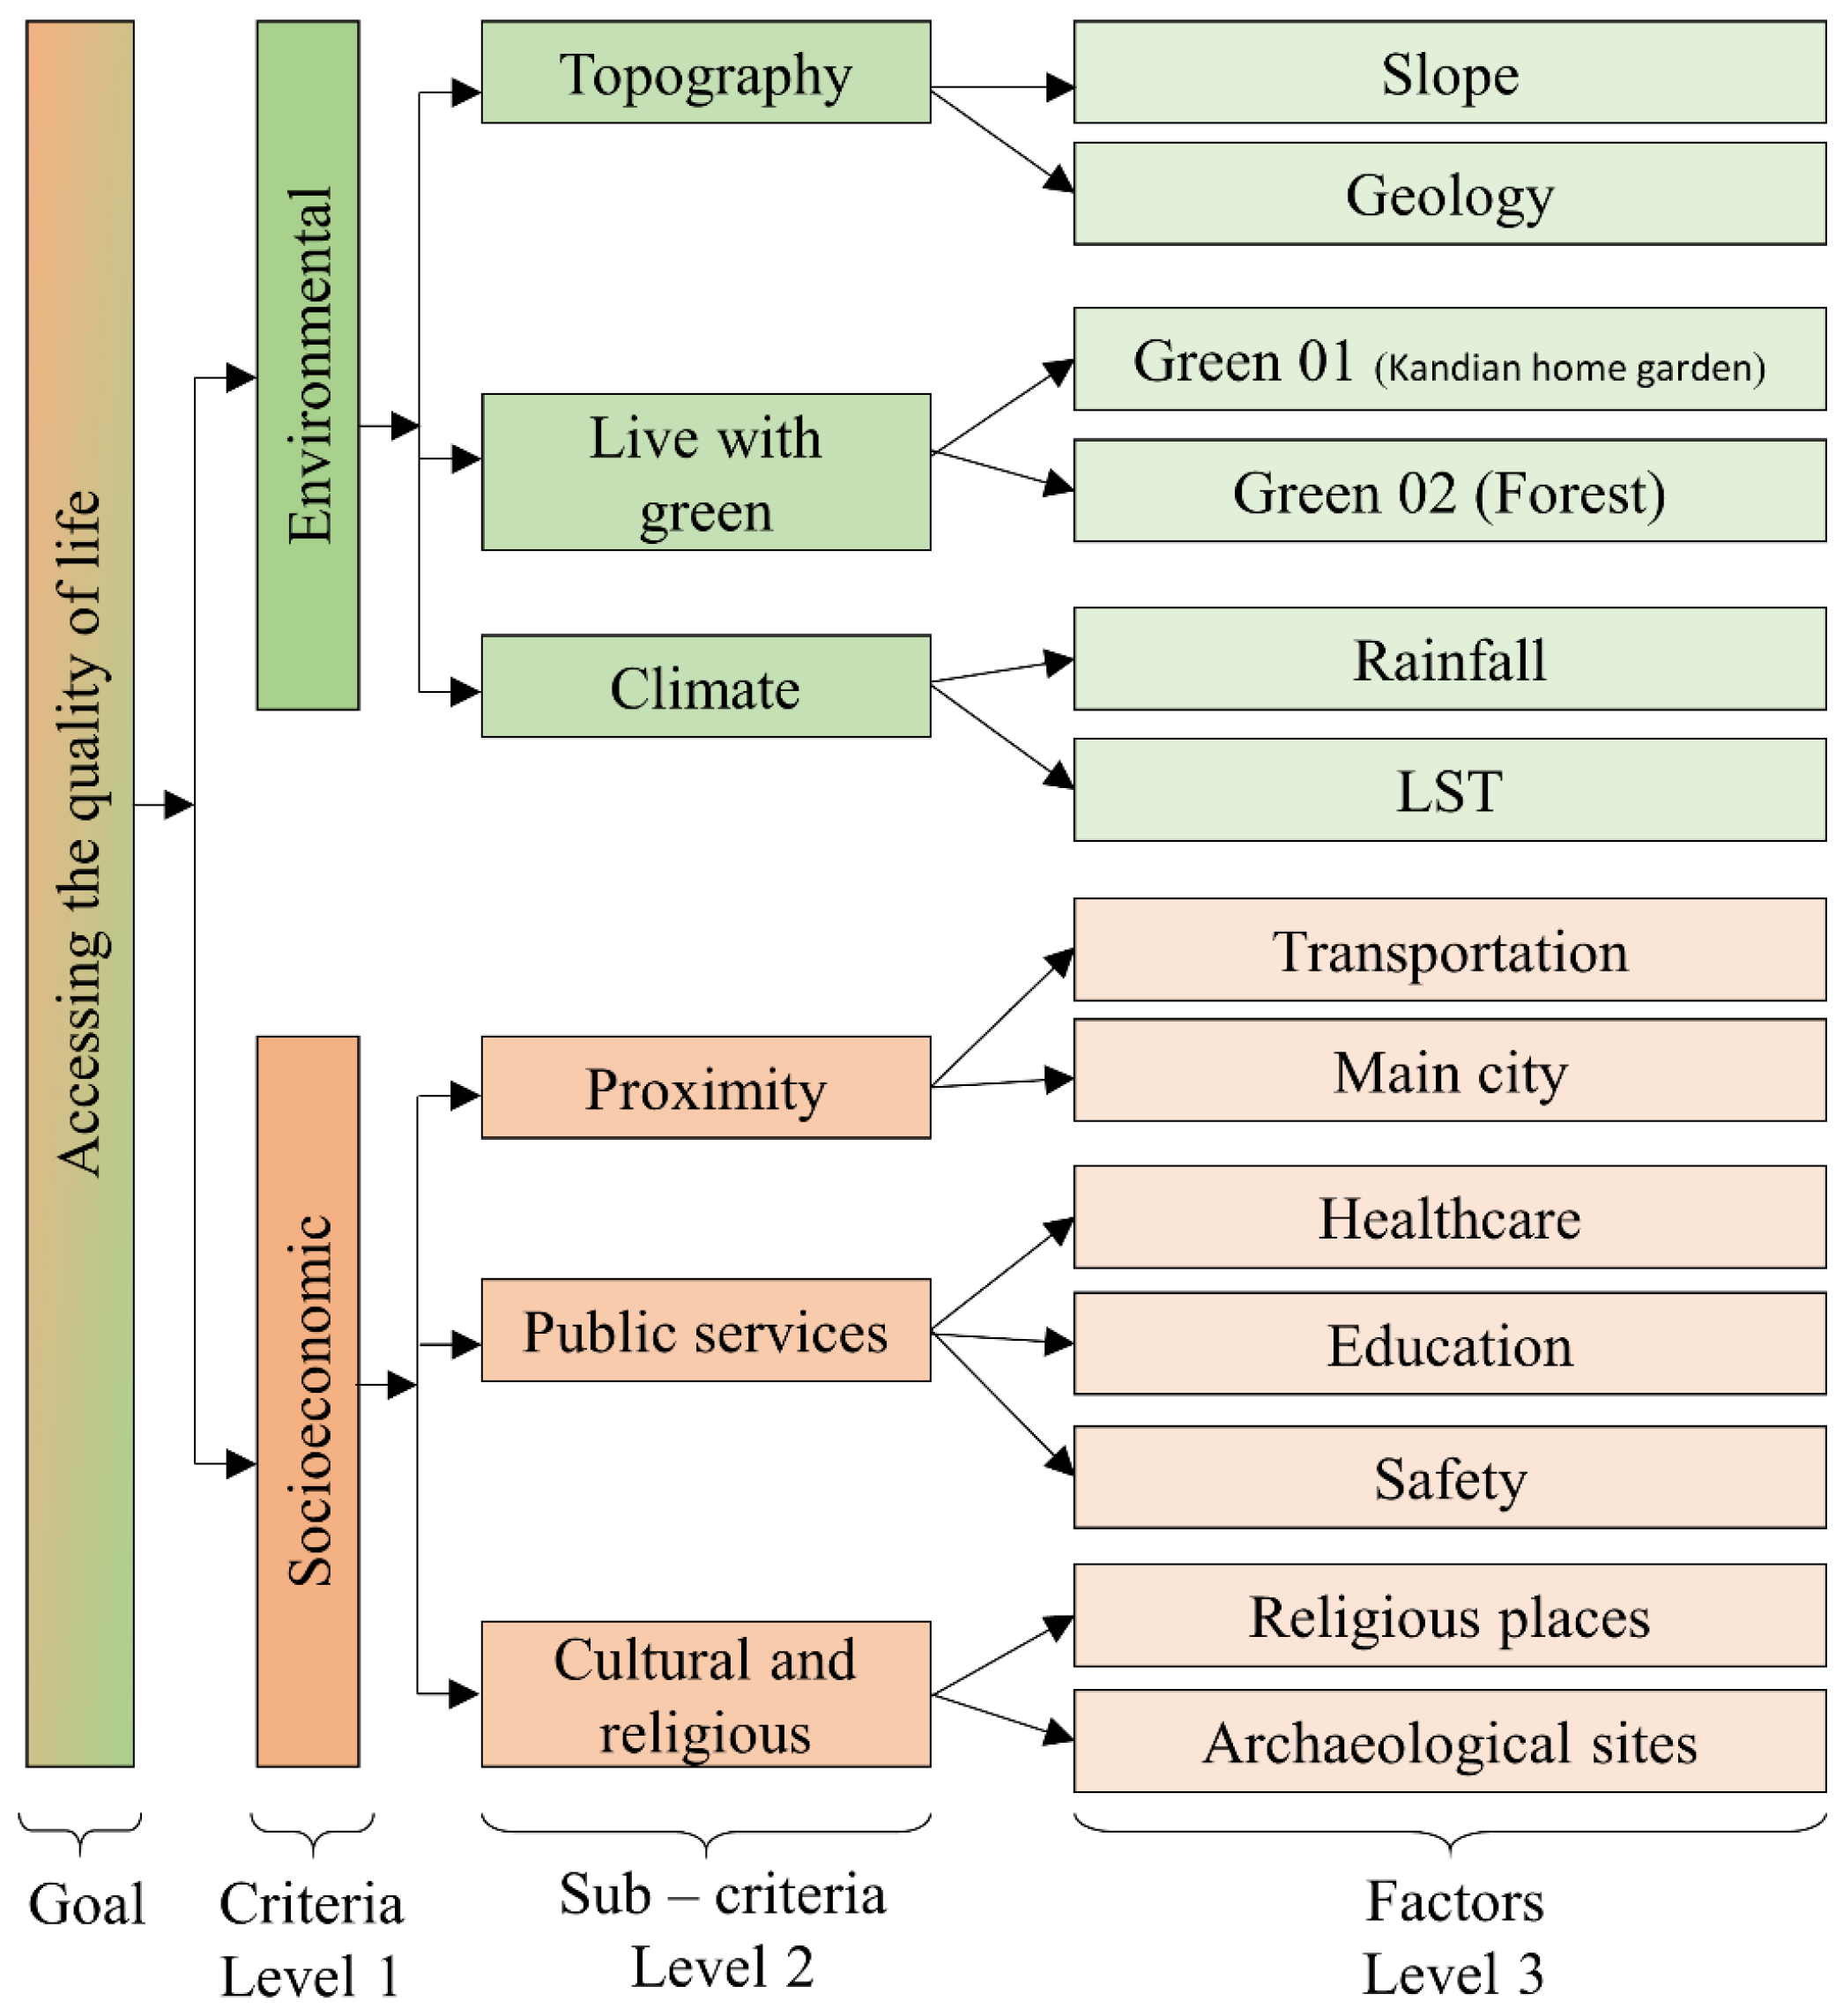
2.4. Preparation of Criteria and Factors in the AHP

Criteria and factors were determined based on the results of the field observations, past research, and information gained from experts [9]. To get wider image and deeper understanding, a discussion with experts was conducted to define the criteria, sub-criteria, and factors related to the AHP. The experts, including professional researchers and officers who engage with public services and the welfare of both the government and private sectors were interviewed. Gathering information from experts is a common approach in the AHP and references can be found elsewhere [15,16,30]. In addition to that, we also met with the respective administrative bodies of settlement constructors and land selling companies and carried out discussions.
Subsequently, the problem was decomposed by constructing a hierarchy of inter-related decision sections. From the highest to the lowest level, the hierarchical structure was made to interrelate and chain all decision sections, and the goal of the study was placed at the upper part of the hierarchical structure. The bottom level of the hierarchical structure was used to present more detailed factors inter-related with the criteria in the next upper level. The hierarchical structure is presented in Figure 2. In the structure, physical factors governed by nature are represented by environmental criteria, while man-made and modified natural environment factors are classes as socioeconomic factors. A detailed description of each factor and its relevance for the study is presented in Table 1. All factors were constructed using secondary data, and the data pre-procedure was dependent on the types of raw data, as shown in Table 1.

2.5. Determination of Threshold Using the LQI

As explained in Section 2.4, information from the experts and some similar research was used to determine the threshold for each factor [9,12]. In the process, the LQ was determined by assigning five classes from the highest to the lowest life quality, as shown in Table 2. The most suitable living areas, which consisted of most of the resources for both environmental and socioeconomic aspects, was designated as the highest LQ zone (Z1). The second zone, which contained resources required for quality life but not all resources like Z1, was named the high LQ zone (Z2). The moderately habitable zone, which consisted of fundamental living factors, was denoted the moderate LQ zone (Z3), while areas with some limitations for livability were classified as the low LQ zone (Z4). The areas with more limitations and fewer resources were categorized as the lowest LQ zone (Z5). Subsequently, the reclassification method or buffer zones of multiple radii were used on each factor to make the five classes listed above (Table 2). This is the most commonly applied technique in spatial multi-attribute decision making research [4,9,12].

2.6. Pairwise Comparison and Weights Calculation

Logical decisions result from the comprehensive analysis of sets of criteria and alternatives because many factors may have influenced one decision. Hence, identification of which factors are the most important and the construction of rank order with priorities is quite a challenging task. The experts carried out the AHP by pairing two factors according to their relative preferences on a scale of 1–9 [45] by answering the question, “By how many times is the selected factor more significant/better than the other one of the pair” [46,47]. In the process, the following steps were carried out:
First: Pairwise comparison questions were prepared by using the criteria and factors presented in Figure 2 and Table 1.
Second: A group of experts with comprehensive knowledge about factors in different fields was carefully selected to avoid factor bias due to their interests (the details of the experts are mentioned in Section 2.4)
Third: Formal interviews were conducted with 52 experts to complete the AHP questions. Then, fault-free questionnaires were rectified and lined up for the next step.
Fourth: Based on the answers given by the experts, pairwise comparison matrices were prepared for criteria, sub-criteria, and factors.
Fifth: The consistency ratio was calculated, and the prioritization of factors was then conducted.
Consistency of expert judgment is a vital attribute of an AHP to ensure the reliability of the results. Hence, in the AHP framework, the consistency ratio (CR) was calculated to ensure the overall consistency of judgments. According to Thomas L. Saaty (2008) [48], the CR value uses a priority vector, which could be 0.10 (10%) or less (≤ 0.1) to present a consistency of preferences. If the CR is higher than 10%, judgments should be revised subjectively. In this study, the CR was computed using Equation (5) [49,50].
C R = C I R I
where CR is the consistency ratio, RI is a random index introduced by Saaty in 1980 [45], and CI is the consistency index that represents a value of departure from consistency. The CI index was calculated using Equation (6) [50].
C I = λ m a x n n 1
where λmax is the largest eigenvalue in matrix A, and n is the dimension of the matrix.
The row geometric mean method (RGMM), which is one of the most popular methods in AHP and MCDM research [50], was used to calculate priority weights, as explained by Equation (7). The priority weights of factors were multiplied by the weights of the criteria and sub-criteria within the same hierarchical level. Then, all factors were normalized and ranked, as summarized in Table 3 [49,50].
P g ( A j ) = i = 1 n P i ( A j ) w i
where Pg(Aj) presents the final comparison of criterion j,Pi(Aj) is individual judgement i of criterion j, and Wi is the weight of individual judgement I. i = 1 n w i = 1 and n is the number of experts [51].

2.7. Computation of LQI with MCDM

The derived weights were multiplied by their respective factors, and all factors were merged into a single layer to compute the LQI in Kandy City, as per Equation (8).
L Q I = i = 1 n = 13 x i w i
where LQI is the life quality index, xi is factor i, and wi is the weight of factor i.

2.8. Spatial Analysis with Gradient Zones

The spatial variation in the quality of life from the city midpoint to the peripheral area was computed by the gradient analysis method. In the process, a sequence of buffers was created around the city center with a 1 km distance interval. It covered 10 buffer zones. Subsequently, the land fraction of each buffer zone was calculated by LQI classes. Finally, the spatial distribution of the the life quality and some statistical analyses were performed.

3. Results

3.1. Determination of Weight and Weight Prioritization

Weights were calculated for criteria, sub-criteria, and factors using pairwise comparison matrices, as explained in Section 2.6. Subsequently, the ranks of the factors were computed to determine the importance of factors. The descriptive statistics of the calculation are summarized in Table 3. As a result, socioeconomic criteria obtained approximately double the weight of environmental criteria. From the sub-criteria, the largest weight (0.669) was observed for proximity, while the lowest was presented for the climate as 0.055. The results of the priority weights show that the highest value is presented for the transportation system, while the third priority was observed from the main city. One of the highlighted results is that both factors (main city and transportation) are categorized under the sub-criteria of proximity. Moreover, these results emphasize that proximity to transportation and the main city are the key factors in LQ in Kandy City. Transportation, main city, and school were the socioeconomic criteria represented in the top five factors, while the other two factors (slope and green 1) were environmental criteria, as shown in Table 3.

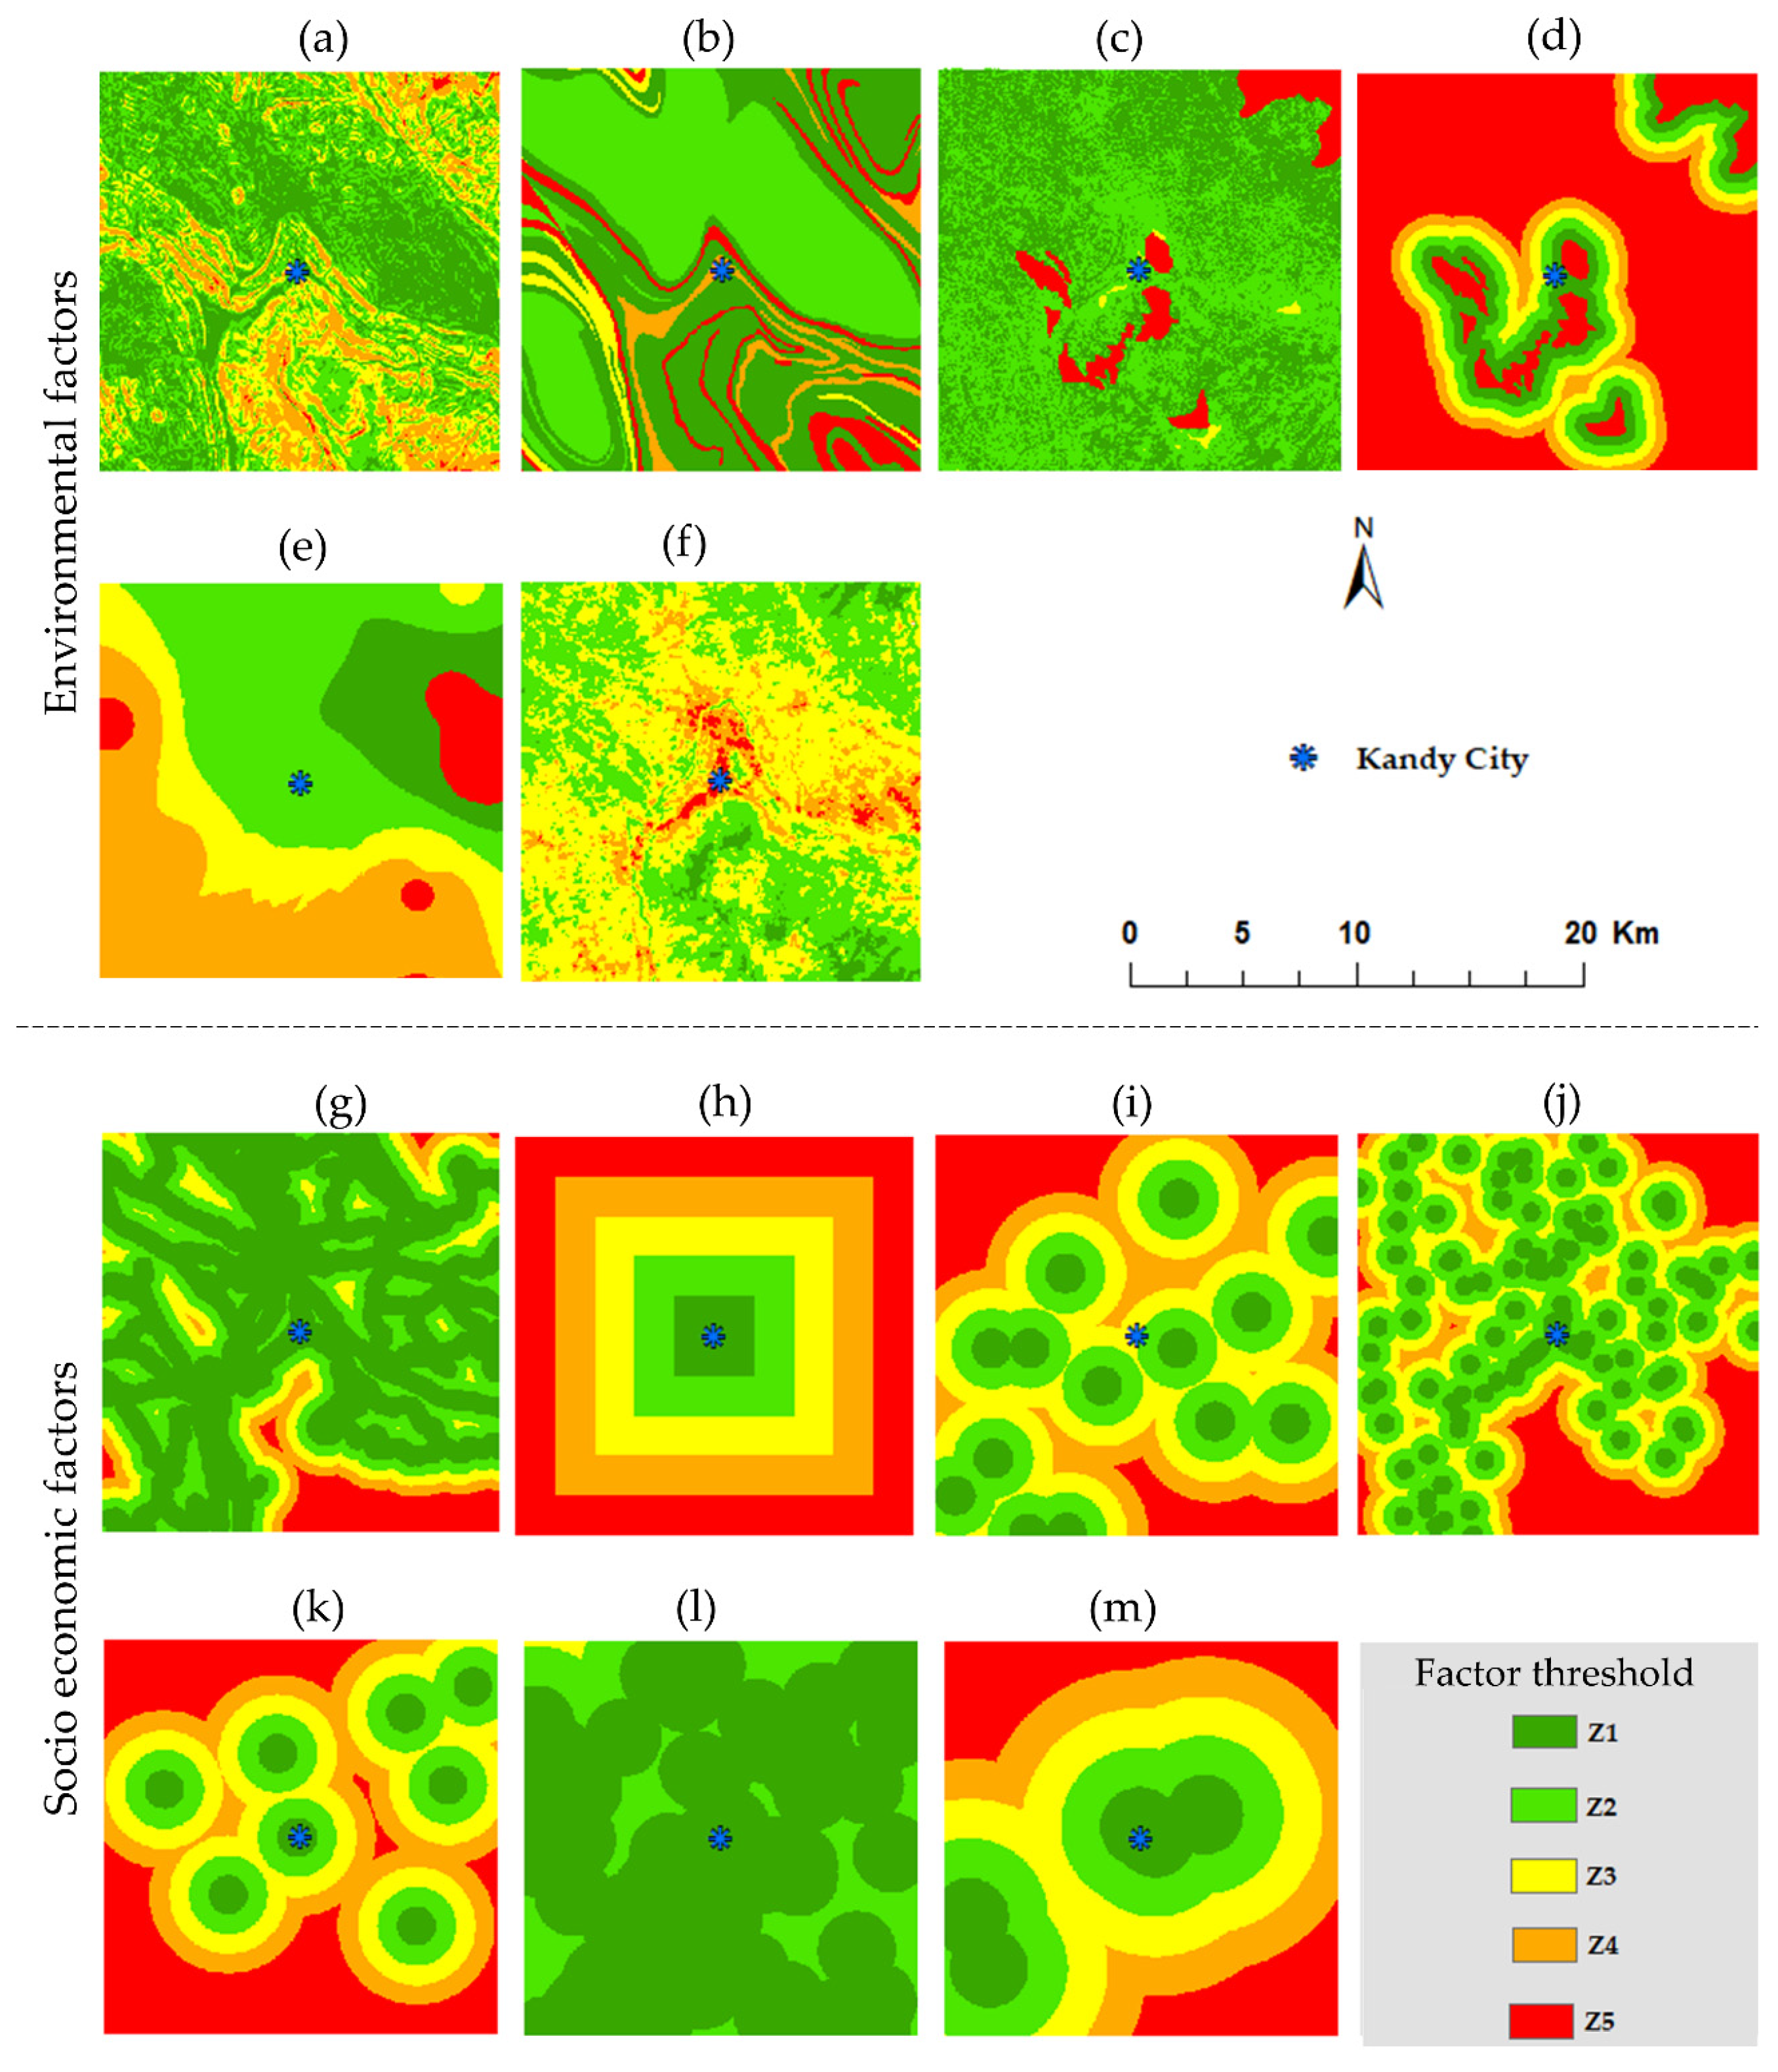
3.2. Spatial Distribution Pattern of Factors

The spatial distribution patterns of each factor are illustrated in Figure 3, while the descriptive statistics are tabulated in Table 4. High slope areas are dispersed in the southern part of the study area, while a low elevation area is observed in the north of the study area, as shown in Figure 3a. The Z1 and Z2 slope classes represent 68% (Table 4b) of the slope factor. There are 10 geology categories scattered over the study area. By considering the suitability for living (residential and commercial), a geology map was categorized into five classes. Among them, Z1 and Z2 jointly contributed to 172.9 km2 (43.2%).
As illustrated in Figure 3c, more than 90% of the green 1 area comes under Z1 and Z2. Moreover, both restricted and reserved forest areas dispersed in the middle and northeast sides (Figure 3c) are considered to be Z5 areas due to the restriction to residences and construction. However, lodging in surrounding forest areas is associated with long livability due to the power of forests for improving people’s mental and physical health. Buffer zones for forest areas were made, as shown in Figure 3d. For the green 1 fraction, 45.5% and 47.3% of the area was classified as Z1 and Z2, respectively. Out of 13 factors, green 2 is the only factor that has a higher portion of land (65.8%/263 km2) classified into Z5, as shown in Table 4. Less rainfall can lead to a dry environment, which is not convenient for living, while more rainfall may cause hazards. Hence, areas with both lower and higher levels of rainfall are considered to be in Z5, although only 6.6% of the classification was due to the rainfall factor. The rest of the rainfall area was categorized into four classes (Figure 3e). A high-temperature zone was observed in the city’s core area and some parts of the periphery, as shown in Figure 3f. A raised temperature in an urban zone may affect the wellbeing of urban dwellers and can affect human health [23]. Thus, these areas were considered as not comfortable for living and were rated as lower (Z5) or low livable (Z4) zones, representing 12.1% (48.3 km2) of LST classes.
The second higher portion (57.3%) of Z1 as influenced by transportation (Figure 3g). However, access to transportation facilities was much less in the southeast part of the study area because of the mountainous topography. The classification of the main city factor gradually increased from Z1 to Z2, as illustrated by Figure 3h. When all thirteen factors were compared, the lowest land portion of Z1 was attributed to the main city factor 4% of the total area. More than 50% of the total area of healthcare was represented by Z2 and Z3, and the same scenario was also observed for the education factor, as shown in Table 4b. The south and southeast parts of the study area were mostly not covered by a safety factor, while more than 50% of places classified as having this factor belonged to Z4 and Z5, suggested that safety is currently unsatisfactory. A total of 83.2% (332.8 km2), which is the highest land portion, of areas belonging to Z1 are represented by religious places, as revealed in Table 4b. Further, it is the only factor that is absent of any land fraction in Z4 or Z5, as illustrated in Figure 3l.

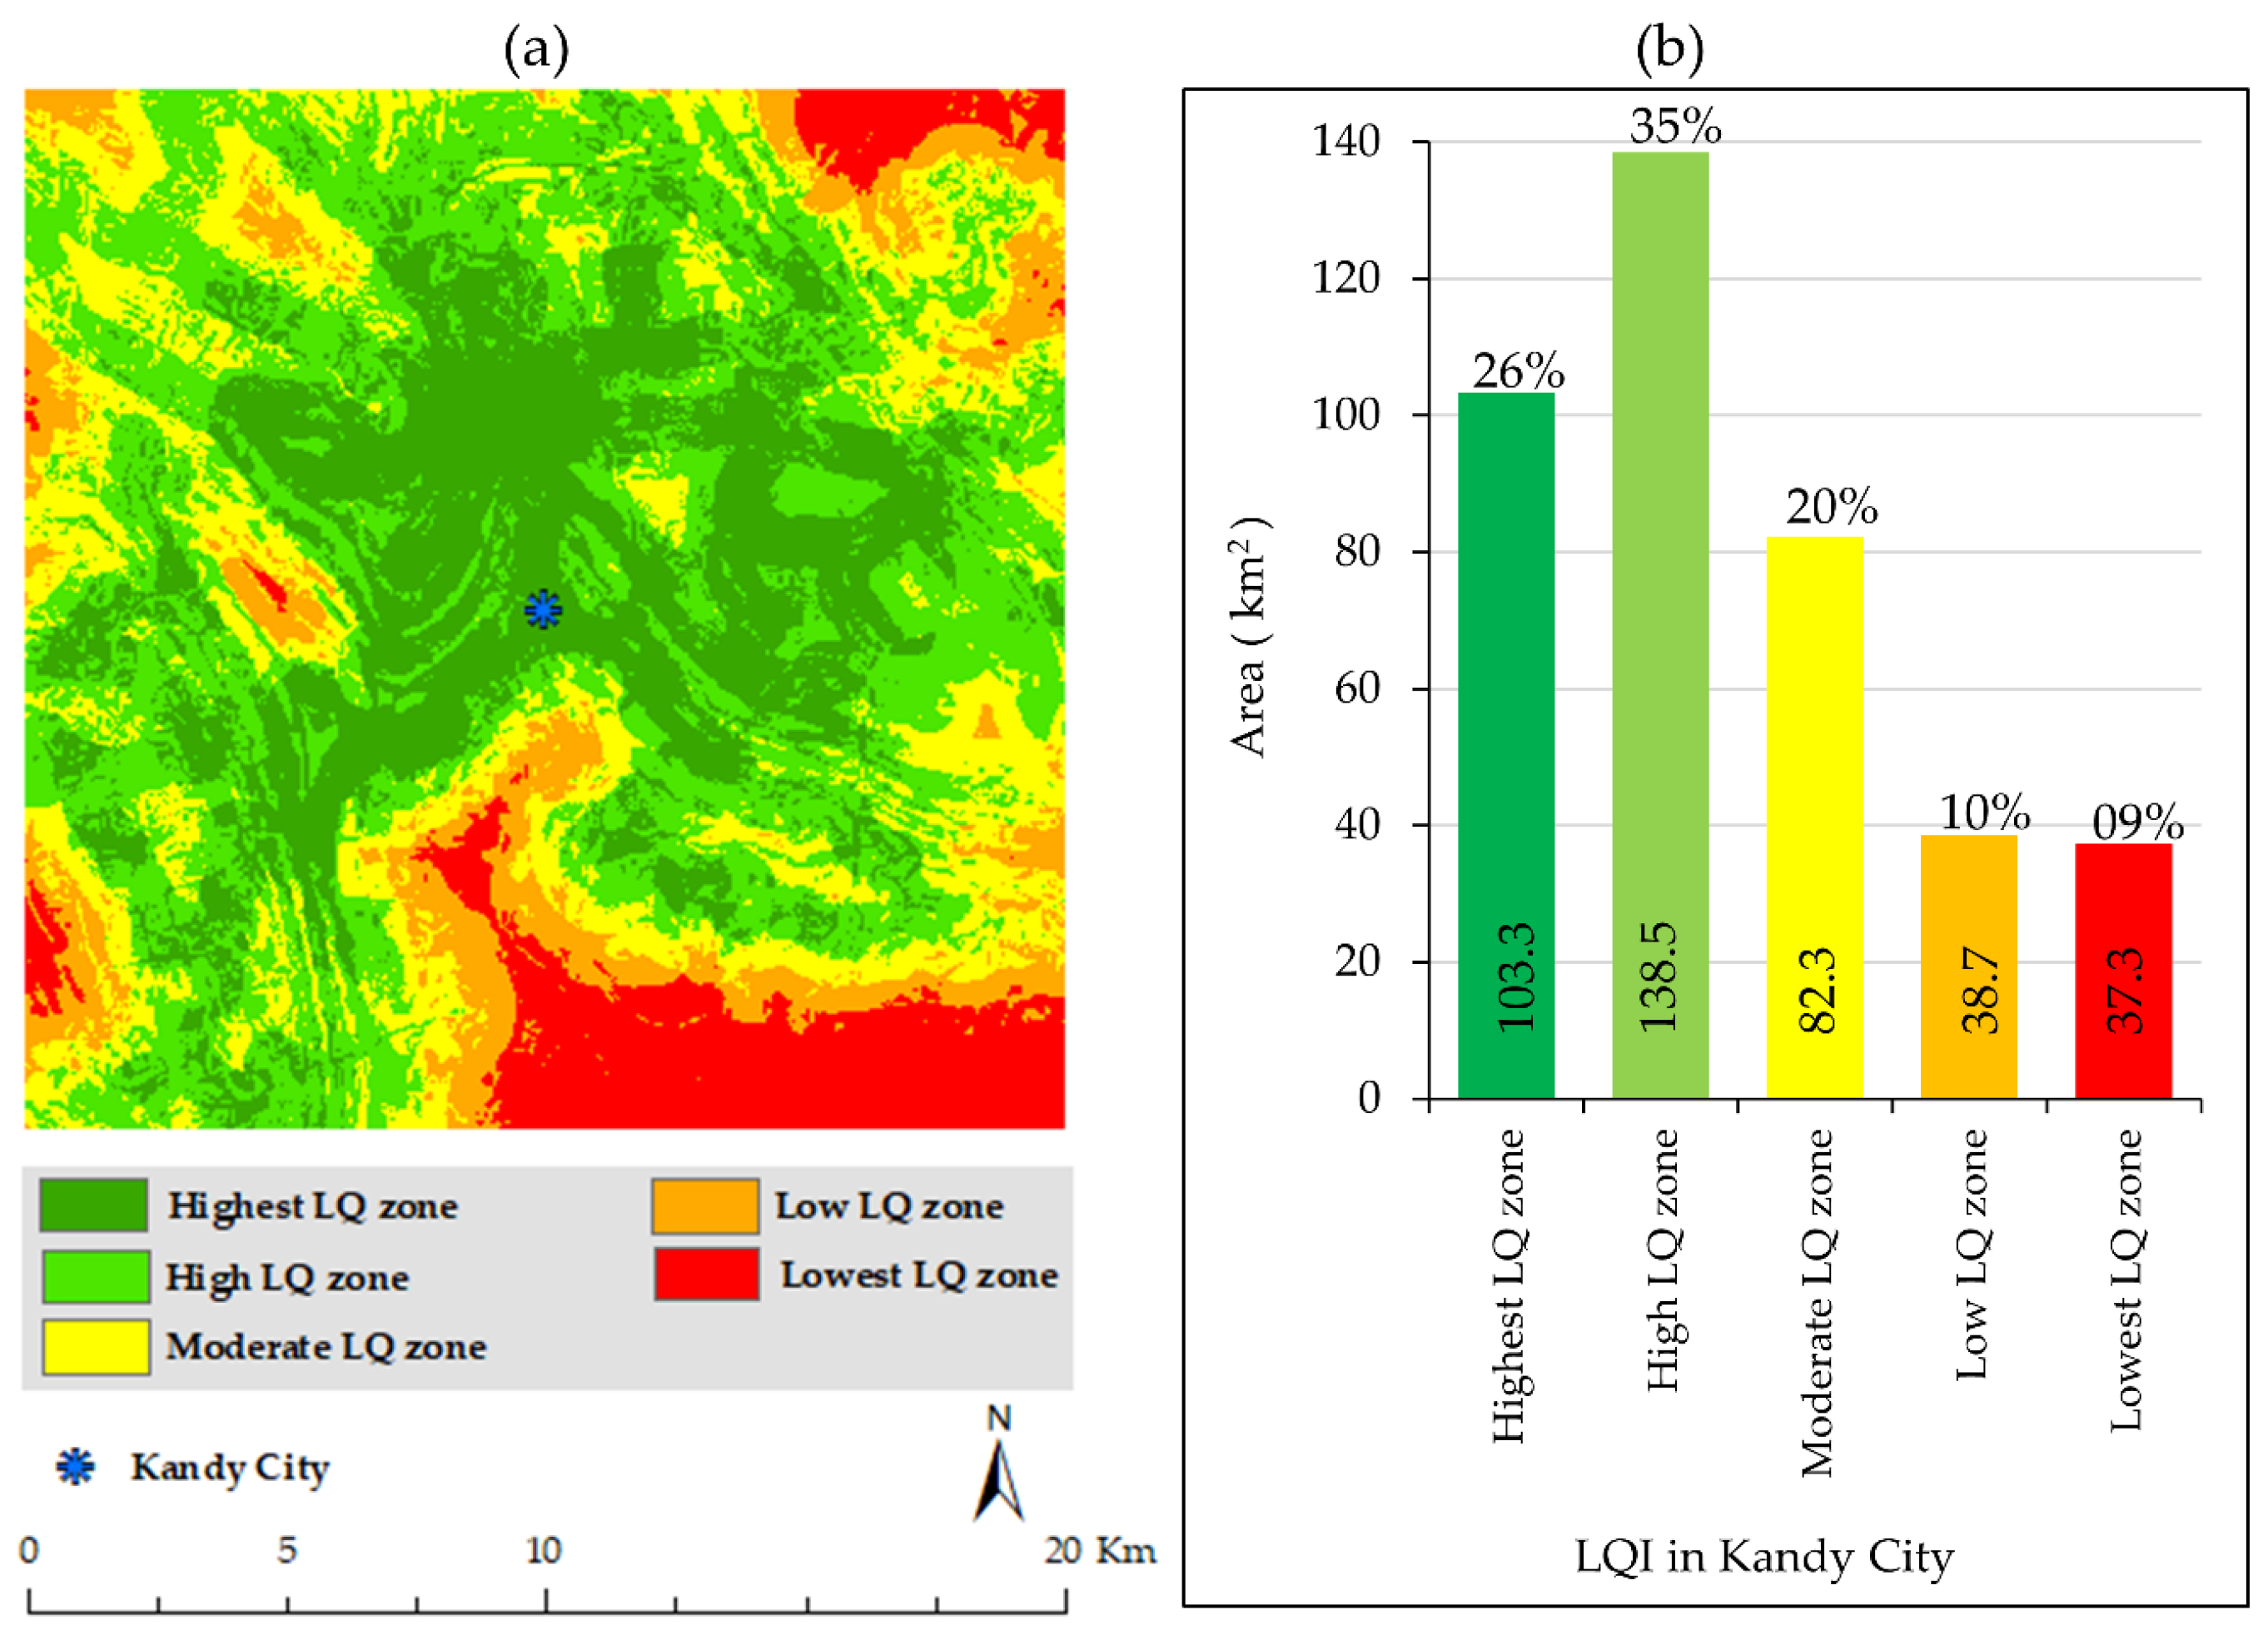
3.3. LQI in Kandy City

MCDM and the AHP were used to produce a weighted life quality index for Kandy City. Many researchers have theoretically and practically stated that the range of numerical values generated by MCDM has no scientific sense other than to explain the research area in relative terms. The values of LQI range from 1.06 to 4.56 throughout the study area. There are many classification methods powered by various kinds of software and applications. Among them, we tested six methods powered by Arc GIS version 10.6, and results were crosschecked with field observations. In addition, we discussed the results with experts. Finally, as a result of a lot of trial and error, the natural break method, which is the most frequently applied technique [12,57,58], was adopted in our research to make an LQI zonation map. Its spatial distribution is shown in Figure 4a, while the summarized results of the area and area percentage of LQI in Kandy City are presented in Figure 4b.
The results show that the highest LQ zone covers 103.3 km2, which is 26% of the total study area, as illustrated in Figure 4b. As one of the highlighted results, the highest LQ zone is somewhat skewed to the north side of the study area. A scatter distribution pattern presents a high LQ zone which is covered with the highest land fraction of 138.5 km2 (35%). Moreover, the highest and high LQ zones jointly make up 61% or 241.8 km2 of the land fraction, as shown in Figure 4b. The moderate, low, and lowest LQ zones cover 20%, 10%, and 9%, respectively. The lowest LQ zone is mainly found in the southeast and northeast of the study area, as illustrated by Figure 4a.

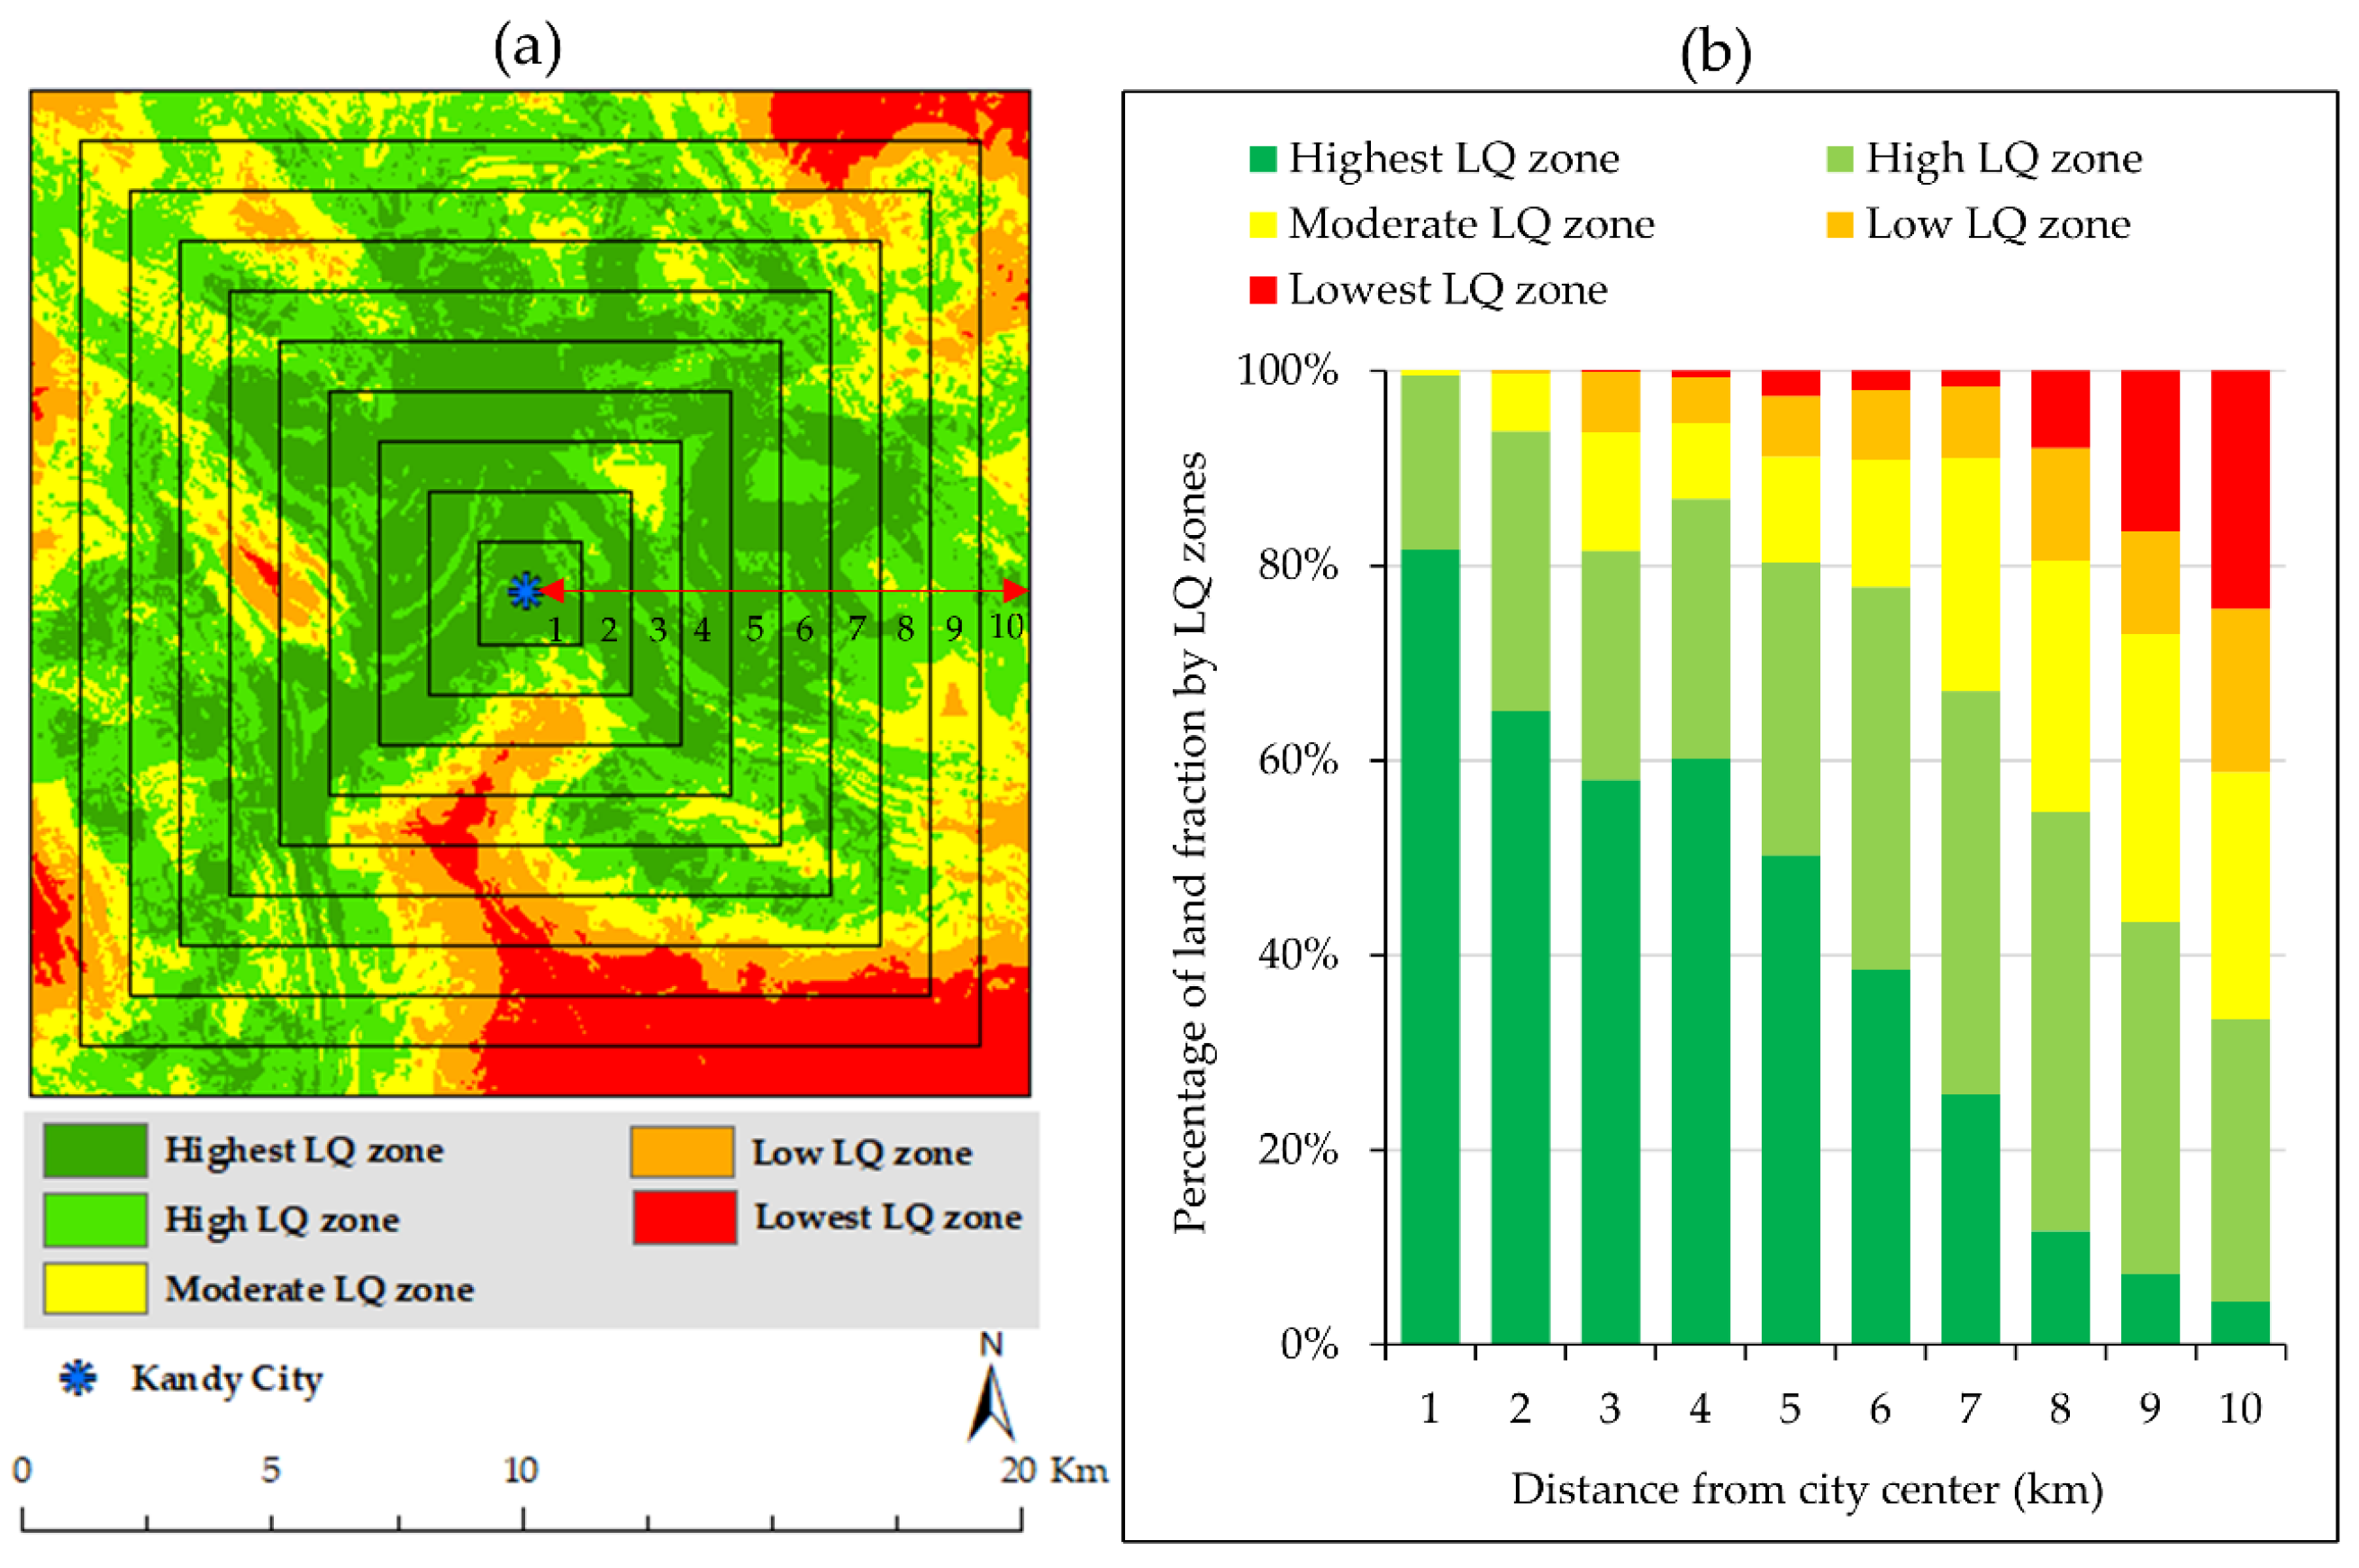
3.4. Distribution of Life Quality from the City Center

A gradient zone analysis was carried out to get a deeper understanding of the spatial distribution of life quality from the city’s midpoint to the border area. LQI zones with gradients are presented in Figure 5a, while each gradient zone (from GZ1 to GZ10) is shown in the LQI zones in Figure 5b. The area of the highest LQ zone gradually declines from the city midpoint to the border area, while the low and lowest LQ zones have the opposite trend, as shown in Figure 5b. The areas of the other two zones (high and moderate IQ zones) also decline when moving away from the city center, but slight fluctuations were noticed. More than 80% of the first GZ is represented by the highest LQ zone, and the rest is covered by high and moderate LQ zones. The other two LQ zones are not represented by GZ1, as shown in Figure 5b. At least 80% of the total extended area of GZ2 to GZ5 is covered by the highest and high LQ zones, and the trend gradually declines so that the last zone (GZ10) covers only 33.5%.

4. Discussion

4.1. Urbanization and Its Effect on Life Quality in Kandy City

Kandy City is a fast-growing city and essential tourist destination [18] located in the central mountain area, and it is wealthy with well-being attributes (social, economic, and environmental), which brings high livability. Additionally, it is the main city of the central province and is one of the important economic hubs in Sri Lanka. Thus, conducting this type of research is a timely vital task to identify the level of life quality of residents. In the process, we first identified the importance of Kandy City as a commercial and living place by exploring past research [19,20] and development plans [59]. However, research related to the quality of life or livability of the city was still lacking, and this was the motivation factor for selecting this research title. Both primary and secondary data were gathered from reliable and trustworthy data sources, and methodology including AHP and MCDM was adopted. A group of experts was selected in order to cover all factors, and factor bias was avoided. Finally, a weighted LQI with five zones was made. Throughout the whole process, especially in field activities, our research team took responsibility for minimizing liveware faults as much as possible.
The results of the AHP show that, among the criteria (level 1), socioeconomic factors obtained a higher weight (0.667) than environmental factors. These results indicate that socioeconomic factors influence the life quality in Kandy City more strongly than environmental factors. Proximity, which was categorized as a socioeconomic factor, obtained the highest weight of all sub-criteria (level 2). Furthermore, the highest weight (0.33) from all 13 factors was transportation (level 3). In 2019, Dissanayake et al. [5] stated that Kandy City has shown a linear city development pattern in the last twenty years. Our LULC classification results also proved this linear development pattern. Figure A1 shows that impervious surfaces are mainly distributed around the road network. We also observed this pattern through our field visits. These results indicate that the factor triggering life quality in Kandy City is the transportation network. Primarily, new settlements have been constructed in close proximity to the roads. New apartments and land fragmentation projects for new settlements have taken place around the main and minor roads. Our results and those from secondary sources reflected the ground-level scenario in the Kandy City area.
While we conducted field observations, some qualitative information related to the quality of life was also collected from residents using informal interviews. Most respondents who resided in the peripheral area stated that they wish to settle close to Kandy City due to the proximity to resources and infrastructure. The group of experts also gave the same idea. Additionally, the results of the life quality GZs show that the highest LQ zone is also distributed around the main city (Figure 5). It is approximately 5 km from the city center. By observing these facts, we can see that highly livable areas or high life quality areas are grounded by surrounding the central city area. Hence, respective government and private companies should have a plan to provide more lodging facilities surrounding the main city area, or they could plan to decentralize the resources to other areas.

4.2. The Implication of Our Results for Enhancing the Life Quality of Urban Life

Except for the green factors (forest and Kandian home garden), physical factors (geology and rainfall) are governed by nature. We cannot change these factors according to our preferences. Hence, human activities should be based on physical factors by changing socioeconomic attributes in order to reach a higher quality of life. On the other hand, we must adapt to nature by making changes to natural factors to promote a high quality of life. As an example, a green environment can be enhanced through the green belt and other applications identified by past researchers, even in Kandy City [5]. The green environment brings several benefits, and it is a suitable solution for controlling the negative effects of LST [18]. Higher LST significantly reduces the quality of life. Thus, enhancing the green environment is an essential, timely task, and green 1 was ranked in the top five most important factors, as shown in Table 3.
An area of 158.2 km2 or 39% of the study area was classified into the lowest three LQ zones (moderate, low, and lowest), and most of these areas were located at least 7 km away from the city center (Figure 5b), especially in the northeast and southeast, as shown in Figure 4a. Further, these areas lack public services including healthcare (Figure 3i), education (Figure 3j), and transportation (Figure 3g). However, these services are fundamentally required for enhancing life quality. Hence, respective administrative bodies should take responsibility for enhancing these public services in order to sustain the quality of life in peripheral areas.
As mentioned above, Kandy City is a fast-growing city. It has a high demand for land for both new investments and settlements. Mainly, the demand surrounds the main city area. Thus, identification of the most livable areas is essential for people who are expecting to buy land in Kandy City and respective administrative bodies (government and private) who provide services for the new settlements. We believe that the results of our research can be used as proxy indicators to generate policies regarding life quality planning and future development scenarios. Regarding the implications of the research results, future city plans should be life quality-oriented, aligning with “goal 11” of the sustainable development goals (SDGs) [60].
As we have detailed, discussed, and illustrated, quality of life depends on both socioeconomic and environmental factors. Some of the factors are more important, while some of the factors are less important. However, we only investigated 13 factors that are applicable for spatial analysis. In this regard, methods applied by past researchers and experts’ ideas were mainly considered. Due to the difficulty of collecting data and inapplicability to spatial analysis, human emotion factors or other preferences influenced by social caste or ethnic groups were not accounted. There may be more than 13 factors that can directly and indirectly influence the quality of life, but available data sources were limited, and some of the data sources could not be trusted. We omitted these data sources from this research. Thus, the results may be interpreted by considering these limitations.

5. Conclusions

This study attempted to develop a life quality index for Kandy City, Sri Lanka using a geospatial approach with AHP and MCDM. The decomposition of factors and construction of a hierarchical order were carried out using information from experts and past research. The AHP approach was performed through pairwise comparisons and derivation of the weight of each factor. MCDM was used to resolve the complex decision environment generated by multiple factors. Socioeconomic criteria were more found to be more necessary than environmental criteria, while proximity was the most sensitive among all sub-criteria. The transportation facility was the most significant factor and presented the highest rank on the LQI in Kandy City. The highest LQ zone was shown to surround the main city, and this was proven by GZ analysis also. The results imply that urban pressure and overpopulation can be controlled by improving socioeconomic facilities in the peripheral and rural areas. Due to the socioeconomic resource availability, people attempt to live in urban areas or close to urban areas. We conclude that the overall findings of this research can be used as guidance for the sustainability of Kandy City. Selected factors will not be a one-size-fits-all approach for any city, but the LQI model is flexible for any calibration. Hence, the constructed model can be applied to other cities to assess their life quality.

Author Contributions

The corresponding author, D.D., proposed the topic and spearheaded the data processing and analysis, as well as the writing of the manuscript. T.M., Y.M., M.R., and E.P. helped in the design, research implementation and analysis, and writing of the manuscript. All authors have read and agreed to the published version of the manuscript.

Funding

This study was supported by the Japan Society for the Promotion of Science (JSPS) through Grant-in-Aid for Scientific Research (B) 18H00763 (2018-20) and it is partly supported by the University of Tsukuba through the Data Bank Project of the Division of Policy and Planning Science Commons.

Acknowledgments

The authors are grateful to the anonymous reviewers for their helpful comments and suggestions to improve the quality of this paper.

Conflicts of Interest

The authors declare no conflict of interest.

Appendix A

Figure A1. Land use and land cover information in 2018 in Kandy City.
Sustainability 12 02918 g0a1

References

  1. United Nations Department for Economic and Social Affairs. World Population Prospects 2019: Highlights; United Nations Department for Economic and Social Affairs: New York, NY, USA, 2019. [Google Scholar]
  2. United Nations Department for Economic and Social Affairs. The World’s Cities in 2018; United Nations: New York, NY, USA, 2018. [Google Scholar]
  3. United Nations Department of Economic and Social Affairs. World Urbanization Prospects: The 2014 Revision, Highlights; United Nations: New York, NY, USA, 2015. [Google Scholar]
  4. Psatha, E.; Deffner, A.; Psycharis, Y. Defining the quality of urban life: Which factors should be considered? In Proceedings of the 51st ERSA Congress European Regional Science Association, Barcelona, Spain, 30 August–2 September 2011; Volume 19. [Google Scholar]
  5. Dissanayake, D.; Morimoto, T.; Ranagalage, M.; Murayama, Y. Land-use/land-cover changes and their impact on surface urban heat islands: Case study of Kandy City, Sri Lanka. Climate 2019, 7, 99. [Google Scholar] [CrossRef] [Green Version]
  6. Maas, J.; Spreeuwenberg, P.; Van Winsum-Westra, M.; Verheij, R.A.; de Vries, S.; Groenewegen, P.P. Is green space in the living environment associated with people’s feelings of social safety? Environ. Plan. A 2009, 41, 1763–1777. [Google Scholar] [CrossRef] [Green Version]
  7. Ranagalage, M.; Wang, R.; Gunarathna, M.H.J.P.; Dissanayake, D.; Murayama, Y.; Simwanda, M. Spatial forecasting of the landscape in rapidly urbanizing hill stations of south Asia: A case study of Nuwara Eliya, Sri Lanka (1996–2037). Remote Sens. 2019, 11, 1743. [Google Scholar] [CrossRef] [Green Version]
  8. Ranagalage, M.; Murayama, Y.; Dissanayake, D.; Simwanda, M. The impacts of landscape changes on annual mean land surface temperature in the tropical mountain city of Sri Lanka: A case study of Nuwara Eliya (1996–2017). Sustainability 2019, 11, 5517. [Google Scholar] [CrossRef] [Green Version]
  9. Onnom, W.; Tripathi, N.; Nitivattananon, V.; Ninsawat, S. Development of a liveable city index (Lci) using multi criteria geospatial modelling for medium class cities in developing countries. Sustainability 2018, 10, 520. [Google Scholar] [CrossRef] [Green Version]
  10. Feneri, A.M.; Vagiona, D.; Karanikolas, N. Multi-criteria decision making to measure quality of life: An integrated approach for implementation in the urban area of Thessaloniki, Greece. Appl. Res. Qual. Life 2015, 10, 573–587. [Google Scholar] [CrossRef]
  11. Zarghami, E.; Sharghi, A.; Olfat, M.; Salehi Kousalari, F. Using multi-criteria decision-making method (MCDM) to study quality of life variables in the design of senior residences in Iran. Ageing Int. 2018, 43, 279–296. [Google Scholar] [CrossRef]
  12. Pawattana, C.; Tripathi, N.K. Analytical Hierarchical Process (AHP)—Based flood water retention planning in Thailand. GISci. Remote Sens. 2008, 45, 343–355. [Google Scholar] [CrossRef]
  13. Kaklauskas, A.; Zavadskas, E.K.; Radzeviciene, A.; Ubarte, I.; Podviezko, A.; Podvezko, V.; Kuzminske, A.; Banaitis, A.; Binkyte, A.; Bucinskas, V. Quality of city life multiple criteria analysis. Cities 2018, 72, 82–93. [Google Scholar] [CrossRef]
  14. Saaty, T.L.; Luis, G. Vargas. Models, Methods, Concepts & Applications of the Analytic Hierarchy Process; Springer: Berlin/Heidelberg, Germany, 2012; Volume 175. [Google Scholar]
  15. Chandio, I.A.; Matori, A.N.B.; WanYusof, K.B.; Talpur, M.A.H.; Balogun, A.L.; Lawal, D.U. GIS-based analytic hierarchy process as a multicriteria decision analysis instrument: A review. Arab. J. Geosci. 2013, 6, 3059–3066. [Google Scholar] [CrossRef]
  16. Deswal, M.; Laura, J.S. GIS based modeling using analytic hierarchy process (AHP) for optimization of landfill site selection of Rohtak city, Haryana (India). J. Appl. Nat. Sci. 2018, 10, 633–642. [Google Scholar] [CrossRef] [Green Version]
  17. Dissanayake, D.; Morimoto, T.; Ranagalage, M. Accessing the soil erosion rate based on RUSLE model for sustainable land use management: A case study of the Kotmale watershed, Sri Lanka. Model. Earth Syst. Environ. 2018, 5, 291–306. [Google Scholar] [CrossRef]
  18. Ranagalage, M.; Dissanayake, D.; Murayama, Y.; Zhang, X.; Estoque, R.C.; Perera, E.; Morimoto, T. Quantifying surface urban heat island formation in the world heritage tropical mountain city of Sri Lanka. ISPRS Int. J. Geo-Inf. 2018, 7, 341. [Google Scholar] [CrossRef] [Green Version]
  19. Weerasundara, L.; Amarasekara, R.W.K.; Magana-Arachchi, D.N.; Ziyath, A.M.; Karunaratne, D.G.G.P.; Goonetilleke, A.; Vithanage, M. Microorganisms and heavy metals associated with atmospheric deposition in a congested urban environment of a developing country: Sri Lanka. Sci. Total Environ. 2017, 584, 803–812. [Google Scholar] [CrossRef] [PubMed] [Green Version]
  20. Weerasundara, L.; Magana-Arachchi, D.N.; Ziyath, A.M.; Goonetilleke, A.; Vithanage, M. Health risk assessment of heavy metals in atmospheric deposition in a congested city environment in a developing country: Kandy City, Sri Lanka. J. Environ. Manag. 2018, 220, 198–206. [Google Scholar] [CrossRef] [PubMed]
  21. Google Erath Engine. Image Collection Reductions. Available online: https://developers.google.com/earthengine/ reducers_image_collection (accessed on 15 January 2020).
  22. Weng, Q. Land use change analysis in the Zhujiang Delta of China using satellite remote sensing, GIS and stochastic modelling. J. Environ. Manag. 2002, 64, 273–284. [Google Scholar] [CrossRef] [Green Version]
  23. Dissanayake, D.; Morimoto, T.; Murayama, Y.; Ranagalage, M. Impact of landscape structure on the variation of land surface temperature in sub-saharan region: A case study of Addis Ababa using Landsat data (1986–2016). Sustainability 2019, 11, 2257. [Google Scholar] [CrossRef] [Green Version]
  24. Phiri, D.; Morgenroth, J. Developments in Landsat land cover classification methods: A review. Remote Sens. 2017, 9, 967. [Google Scholar] [CrossRef] [Green Version]
  25. Erkan, U.; Gökrem, L. A new method based on pixel density in salt and pepper noise removal. Turkish J. Electr. Eng. Comput. Sci. 2018, 26, 162–171. [Google Scholar] [CrossRef]
  26. Thapa, R.; Murayama, Y. Image classification techniques in mapping urban landscape: A case study of Tsukuba city using AVNIR-2 sensor data. Tsukuba Geoenviron. Sci. 2007, 3, 3–10. [Google Scholar]
  27. Sakthidasan, K.; Sankaran, K.; Velmurugan Nagappan, N. Noise free image restoration using hybrid filter with adaptive genetic algorithm. Comput. Electr. Eng. 2016, 54, 382–392. [Google Scholar] [CrossRef]
  28. Sobrino, J.A.; Jiménez-Muñoz, J.C.; Paolini, L. Land surface temperature retrieval from LANDSAT TM 5. Remote Sens. Environ. 2004, 90, 434–440. [Google Scholar] [CrossRef]
  29. Yulianto, T.; Suripin, S.; Purnaweni, H. Zoning landslide vulnerable area according to geological structure, slopes, and landuse parameters in Trangkil Sukorejo Gunungpati Semarang City’s Residental Area. In Proceedings of the 8th International Seminar on New Paradigm and Innovation on Natural Science and Its Application, Semarang, Indonesia, 26 September 2018; Volume 1227. [Google Scholar]
  30. Thinh, N.X.; Vogel, R. Application of the analytic hierarchy process in the multiple criteria decision analysis of retention areas for flood risk management. Environ. Inform. Syst. Res. 2007, 2007, 675–682. [Google Scholar]
  31. Perera, E.N.C.; Jayawardana, D.T.; Jayasinghe, P.; Ranagalage, M. Landslide vulnerability assessment based on entropy method: A case study from Kegalle district, Sri Lanka. Model. Earth Syst. Environ. 2019, 5, 1635–1649. [Google Scholar] [CrossRef]
  32. Prakash, S.; Singh, S.K.; Jain, P.A.; Dwivedi, N.; Dwivedi, S.; Mishra, V.K.; Pundir, V.S. Importance of geology in construction and prevent the hazards. Libr. Adv. Appl. Sci. 2015, 6, 75–80. [Google Scholar]
  33. Bell, F.G. Engineering Geology and Construction; CRC Press: Boca Raton, FL, USA, 2004. [Google Scholar]
  34. Ranagalage, M. Landslide Hazards Assessment in Nuwara Eliya District in Sri Lanka. In Proceedings of the Japanese Geographical Meeting, Tsukuba, Japan, 28–30 March 2017; p. 100336. [Google Scholar]
  35. Jacob, V.J.; Alles, W.S. Kandyan gardens of Sri Lanka. Agrofor. Syst. 1987, 5, 123–137. [Google Scholar] [CrossRef]
  36. Perera, A.H.; Rajapakse, R.M.N. A baseline study of Kandyan forest gardens of Sri Lanka: Structure, composition and utilization. For. Ecol. Manag. 1991, 45, 269–280. [Google Scholar] [CrossRef]
  37. De Vries, S.; Verheij, R.A.; Groenewegen, P.P.; Spreeuwenberg, P. Natural environments—Healthy environments? An exploratory analysis of the relationship between greenspace and health. Environ. Plan. 2003, 35, 1717–1731. [Google Scholar] [CrossRef] [Green Version]
  38. Potuhera, O.L.; Primali, V.; Weerasinghe, A. Improving existing landslide hazard zonation map in KMC area, Sri Lanka. Suan Sunandha Sci. Technol. J. 2015, 2, 24–29. [Google Scholar]
  39. World Health Organization. Housing, Energy and Thermal Comfort: A Review of 10 Countries within the WHO European Region; WHO Regional Office for Europe: Copenhagen, Denmark, 2007. [Google Scholar]
  40. Priyankara, P.; Ranagalage, M.; Dissanayake, D.; Morimoto, T.; Murayama, Y. Spatial Process of Surface Urban Heat Island in Rapidly Growing Seoul Metropolitan Area for Sustainable Urban Planning Using Landsat Data (1996–2017). Climate 2019, 7, 110. [Google Scholar] [CrossRef] [Green Version]
  41. Sze, N.N.; Christensen, K.M. Access to urban transportation system for individuals with disabilities. IATSS Res. 2017, 41, 66–73. [Google Scholar] [CrossRef]
  42. Serag El Din, H.; Shalaby, A.; Farouh, H.E.; Elariane, S.A. Principles of urban quality of life for a neighborhood. HBRC J. 2013, 9, 86–92. [Google Scholar] [CrossRef] [Green Version]
  43. Behere, P.B.; Das, A.; Yadav, R.; Behere, A.P. Religion and mental health. Indian J. Psychiatry 2013, 55, S187. [Google Scholar] [CrossRef] [PubMed] [Green Version]
  44. Sharp, B.; Kerr, G. Option and Existence Values for the Waitaki Catchment; Ministry for the Environment Manatū Mō Te Taiao: Wellington, New Zealand, 2005.
  45. Ammarapala, V.; Chinda, T.; Pongsayaporn, P.; Ratanachot, W.; Punthutaecha, K.; Janmonta, K. Cross-border shipment route selection utilizing analytic hierarchy process (AHP) method. Songklanakarin J. Sci. Technol. 2018, 40, 31–37. [Google Scholar]
  46. Bozóki, S.; Fülöp, J.; Poesz, A. On pairwise comparison matrices that can be made consistent by the modification of a few elements. Cent. Eur. J. Oper. Res. 2011, 19, 157–175. [Google Scholar] [CrossRef] [Green Version]
  47. Omamalin, B.N.; Canoy, S.R.; Rara, H.M. Differentiating total dominating sets in the join, corona and composition of graphs. Int. J. Math. Anal. 2014, 8, 1275–1284. [Google Scholar] [CrossRef]
  48. Saaty, T.L. Decision making with the analytic hierarchy process. Int. J. Serv. Sci. 2008, 1, 83. [Google Scholar] [CrossRef] [Green Version]
  49. Aguarón, J.; Teresa Escobar, M.; Moreno-Jiménez, J.; Turón, A. AHP-group decision making based on consistency. Mathematics 2019, 7, 242. [Google Scholar] [CrossRef] [Green Version]
  50. Escobar, M.T.; Aguarón, J.; Moreno-Jiménez, J.M. A note on AHP group consistency for the row geometric mean priorization procedure. Eur. J. Oper. Res. 2004, 153, 318–322. [Google Scholar] [CrossRef]
  51. Forman, E.; Peniwati, K. Aggregating individual judgments and priorities with the Analytic Hierarchy Process. Eur. J. Oper. Res. 1998, 108, 165–169. [Google Scholar] [CrossRef]
  52. National Building Research Organization (NBRO). Hazard Resilient Housing Construction Manual; National Building Research Organisation: Colombo, Sri Lanka, 2015.
  53. Kapila, D. Handbook on Geology and Mineral Resources of Sri Lanka: A Collection of Authoritative State-of-the-Art Papers by Specialists on Some Geological and Mineralogical Aspects of Sri Lanka; Geological Survey and Mines Bureau (GSMB): Kotte, Sri Lanka, 1995.
  54. Disaster Management Centre. Sri Lanka Post-Disaster Needs Assessment; Ministry of Disaster Management: Colombo, Sri Lanka, 2016.
  55. Japan International Cooperation Agency. The Data Collection Survey on Road Protection against Natural Disaster (Landslide-Disaster); Japan Conservation Engineers & Co., Ltd.: Saitama, Japan, 2012. [Google Scholar]
  56. Näyhä, S.; Rintamäki, H.; Donaldson, G.; Hassi, J.; Jousilahti, P.; Laatikainen, T.; Jaakkola, J.J.K.; Ikäheimo, T.M. Heat-related thermal sensation, comfort and symptoms in a northern population. Eur. J. Public Health 2014, 24, 620–626. [Google Scholar] [CrossRef] [PubMed] [Green Version]
  57. Nazri Che, D.; Abu Hassan, A.; Zulkiflee Abd, L.; Rodziah, I. Application of geographical information system-based analytical hierarchy process as a tool for dengue risk assessment. Asian Pac. J. Trop. Dis. 2016, 6, 928–935. [Google Scholar]
  58. Thirumalaivasan, D.; Karmegam, M.; Venugopal, K. AHP-DRASTIC: Software for specific aquifer vulnerability assessment using DRASTIC model and GIS. Environ. Model. Softw. 2003, 18, 645–656. [Google Scholar] [CrossRef]
  59. Ministry of Urban Development, Water Supply and Drainage Sri Lanka. Kandy City Region Strategic Development Plan—2030; Urban Development Authority: Kandy, Sri Lanka, 2015.
  60. United Nations (UN). Transforming Our World. In The 2030 Agenda for Sustainable Development; United Nations General Assembly: New York, NY, USA, 2015; pp. 1–35. [Google Scholar]
Figure 1. Study area. (a) South Asia; (b) the Democratic Socialist Republic of Sri Lanka, including the study area; and (c) the study area represented by a Landsat-8 image with a false-color composite (bands 5, 4, 3).
Sustainability 12 02918 g001
Figure 2. Criteria and factors related to the analytic hierarchy process (AHP).
Sustainability 12 02918 g002
Figure 3. Factor thresholds: (a) slope, (b) geology, (c) green 1, (d) green 2, (e) rainfall, (f) LST, (g) transportation, (h) main city, (i) healthcare, (j) education, (k) safety, (l) religious places, and (m) archaeological sites.
Sustainability 12 02918 g003
Figure 4. (a) Distribution of the life quality index (LQI) and (b) descriptive statistics of LQ index (LQI) of Kandy City.
Sustainability 12 02918 g004
Figure 5. (a) Spatial distribution of the LQI with gradient zones from the city center to the peripheral area, and (b) area proportion by LQ zone in each gradient zone (from GZ1 to GZ10).
Sustainability 12 02918 g005
Table 1. Factors and their relevance including the factor derivation method.
FactorsPurpose and RelevanceRaw DataData SourcesData Processing/Method
SlopeThe high slope area is not convenient for the settlement because of the risk of landslides [31] and the high construction cost. Considering that Kandy is a hill country city, slope is a relevant factor for the study.DEMSDOSLConstruction of slope from digital elevation model (DEM) and reclassification.
GeologyA geological structural fault causes the vulnerability of the settlement and leads to damage to infrastructure [32,33]. Settlements located on poor geological structures can be vulnerable to landslides [34], and this may cause many problems, notably land instability and road damage [29]. This information emphasizes that geological structural faults create an unpleasant environment for lodging and directly affect the LQ in Kandy city. Geology mapSDOSLThe suitability of construction was reclassified into a geology map.
Green 01 (Kandian Home garden [35,36] which is known as secondary forest in Sri Lanka)Kandyan Home Gardens (KHG), which is known as Kandyan Forest Gardens (KFG) in Sri Lanka denotes a traditional system of wealth cropping that has been in practice for several centuries. It refers to mixed settlements with a variety of crops from economically valuable groups (spices, fruits, medicinal plants, and timber species), where the climate and edaphic environment support luxurious lodges [35]. All types of forest (restricted and reserved) are excluded from the Kandian Home garden.LULC Map
(Section 2.3.2)
USGSProximity analysis was used by applying the buffer distance to the Kandian home gardens.
Green 02
(Forest)
A high-density green environment is important not only for scenic beauty, but also, as a comfortable living environment [6]. Further, rich green environments are reliable in terms of scenic aspects, aesthetic beauty, water recharging, and boosting the natural air regulation procedure to generate a comfortable breathing environment [23,37].Proximity analysis was conducted by applying the buffer distance to the forest area.
RainfallVegetated land, streams, and channels are sustained by rainfall. However, heavy rainfall can cause several hazards, for example, flooding, damage to buildings and infrastructure, loss of crops and livestock, landslides [31,38], and risk to human life that can threaten the quality of life. Thus, the consideration of rainfall as a factor is important in LQ studies.Annual average rainfall over the last twenty years (1998–2018)MDOSLRain gauging station (21 stations) data were transformed into spatial data by using an inverse distance weighted (IDW) interpolation technique [17]. Then, this was reclassified into five classes.
Land Surface Temperature (LST)Kandy, as a tropical city, has short seasonal changes, where the dry period is from January to April. The average daytime ambient temperature ranges from 28 to 32 °C, and the relative daytime humidity is in the range of 63%–83% [5]. High temperatures can negatively affect the ability to lead a healthy life. They may lead to a low LQ [39,40]. Due to the absence of continuous air temperature data measured at ground level, remote sensing based LST was derived [5,8] Landsat-8 OLI/TIRS data (Section 2.3.3)USGSReclassification by LST based on suitability class
TransportationTransportation facilities are crucial not only for mobility but also for access to resources. From the perspective of quality of life, the level of service is based on the available transport facilities [41]. Additionally, the price of residential land and social status are influenced by transportation facilities. Thus, considering transportation as a one-factor in LQ research is important. Roads and railwaySDOSLProximity analysis was used by applying buffer distances, as noted in Table 2
Main cityWhen it comes to choosing a place to lodge, everyone has their priorities and subjective tastes. Still, there are specific attributes, among them, the distance to the main city. This is the principal factor because the main city provides many services including those related to livelihood and infrastructure [42]. Additionally, living in the city is prestigious to residents and is an indicator of social class. Hence, the distance from the main city is an important factor for measuring LQ. Kandy City
HealthcareHealthcare is an essential factor in the quality of life, and the availability of hospital facilities can reduce life risk by accidental damage [9]. Both private and public hospitals were considered.Teaching and regional hospitals
EducationSchools are education hubs that provide not only subject knowledge but also improvement of attitude [9]. Main schools
SafetyThe safety factor was selected by considering police stations because they provide national security at the regional and local levels [9]. All police stations
Religious places *Engaging with religious activities brings spiritual power, which is vital for mental health to build a perfect life [43]. As noted in Section 2.1, Kandy is a famous cultural city because it is home to the temple of the Tooth Relic (Sri Dalada Maligawa). Additionally, it is ethnically diverse due to the historical religious places located not only in the city area but also in its surrounding area. Buddhist temples, churches, and mosques
Archaeological sitesThe ancient monuments and archaeological sites create a pleasant settlement environment with scenic beauty. Additionally, they provide value due to satisfaction from preserving a historic environment; in other words, they maintain the natural heritage or cultural heritage for future generations [44]. People love to live close to archaeological sites. Land and settlement selling companies also mainly emphasize archaeological sites as a propagation technique.Archaeological and heritage sites
LQ: life quality, SDOSL = Survey Department of Sri Lanka, MDOSL = Meteorology Department of Sri Lanka, USGS = United States Geological Survey. * Because of different types of ethnic groups, all types of religious places were accounted.
Table 2. Factor threshold and suitability classes.
LQIHighest Livable ZoneHigh Livable ZoneModerate Livable ZoneLow Livable ZoneLowest Livable Zone
Factor threshold classesZ1Z2Z3Z4Z5
Slope [52]< 5°5°–11°11°–17°17°–31°> 31°
Geology [53]Charnockitic Gneiss, Garnet Sillimanite Biotite Gneiss, Granite Gneiss, Undifferentiated Charnockitic Biotite GneissBiotite Hornblende Garnet GneissCalc Gneisses and/or granulites, Hornblende biotite migmatitesMarbleImpure quartzite and quartz schists, Quartzite
Green 1
[6,37]
Inside G1 (excluding restricted area)< 0.25 km0.25–0.5 km0.5–0.75 km> 0.75 km and all restricted area as explained in Table 1
Green 2 [6,37]0.5km0.5–1.0 km1.0–1.5 km1.5–2.0 km> 2km
Rainfall (annual) [38,54,55]1500–1800 mm1800–2100 mm2100–2300 mm2300–2600 mm> 2300 mm and < 1500 mm
LST [39,56]< 22 °C22–24 °C24–26 °C26–28 °C> 28 °C
Transportation [9]< 0.5 km0.5–1.0 km1.0–1.5 km1.5–2.0 km> 2 km
Main city< 2.5 km2.5–5 km5–7.5 km7.5–10 km> 10 km
Healthcare [9]< 1 km1–2 km2–3 km3–4 km> 4 km
Education [9]< 0.5 km0.5–1.0 km1.0–1.5 km1.5–2.0 km> 2 km
Safety [9]< 1 km1–2 km2–3 km3–4 km> 4 km
Religious places< 2 km2–4 km4–6 km6–8 km> 8 km
Archaeological sites< 2 km2–4 km4–6 km6–8 km> 8 km
Table 3. Weights of criteria, sub-criteria, and factors concerning the priority weights and ranks.
CriteriaSub-CriteriaFactorsPriority WeightRank
CategoryWeightCategoryWeightCategoryWeight
Environmental0.333Topography0.655Slope0.8330.182
Geology0.1670.048
Live with green0.29Green 10.7500.075
Green 20.2500.029
Climate0.055Rainfall0.6670.0111
LST0.3330.0113
Socioeconomic0.667Proximity0.669Transportation0.7500.331
Main city0.2500.113
Public services0.243Healthcare0.2580.047
Education0.6370.104
Safety0.1050.0210
Cultural and religious0.088Religious places0.8330.056
Archaeological sites0.1670.0112
Table 4. Descriptive statistics of life quality (LQ) classes by factors.
a. Area (km2) by factors
LQI classesSlopeGeologyGreen 1Green 2RainfallLSTTransportationMain cityHealthcareEducationSafetyReligious placesArchaeological sites
Z1127.8172.9182.234.549.07.3229.316.041.267.324.7332.847.1
Z2144.1156.0189.133.5133.2151.692.848.0105.9130.573.665.984.0
Z372.812.41.935.263.1192.735.480.0114.186.596.21.497.2
Z453.420.70.033.7128.541.117.4112.070.440.382.30.083.8
Z51.938.026.9263.026.27.225.1144.068.475.4123.20.087.8
Total400.0400.0400.0400.0400.0400.0400.0400.0400.0400.0400.0400.0400.0
b. Area percentage by factors
LQI classesSlopeGeologyGreen 1Green 2RainfallLSTTransportationMain cityHealthcareEducationSafetyReligious placesArchaeological sites
Z131.943.245.58.612.21.857.34.010.316.86.283.211.8
Z236.039.047.38.433.337.923.212.026.532.618.416.521.0
Z318.23.10.58.815.848.28.820.028.521.624.10.324.3
Z413.35.20.08.432.110.34.428.017.610.120.60.021.0
Z50.59.56.765.86.61.86.336.017.118.930.80.022.0
Total100100100100100100100100100100100100100

