Article

The Rio Olympic Games: A Look into City Dynamics through the Lens of Twitter Data

by
Ana Condeço-Melhorado
1,*,
Inmaculada Mohino
2,
Borja Moya-Gómez
3 and
Juan Carlos García-Palomares
1
1
tGIS Research Group, Geography Department, Complutense University of Madrid, 28040 Madrid, Spain
2
LoCUS Interdisciplinary Lab on Complex Urban & Regional Spatial Processes, Department of City and Regional Planning, School of Architecture, Universidad Politécnica de Madrid, 28040 Madrid, Spain
3
Transport Research Centre (TRANSyT-UPM), Universidad Politécnica de Madrid, 28040 Madrid, Spain
*
Author to whom correspondence should be addressed.
Sustainability 2020, 12(17), 7003; https://0-doi-org.brum.beds.ac.uk/10.3390/su12177003
Submission received: 11 July 2020 / Revised: 5 August 2020 / Accepted: 13 August 2020 / Published: 27 August 2020

Abstract

:
The Olympic Games have a huge impact on the cities where they are held, both during the actual celebration of the event, and before and after it. This study presents a new approach based on spatial analysis, GIS, and data coming from Location-Based Social Networks to model the spatiotemporal dimension of impacts associated with the Rio 2016 Olympic Games. Geolocalized data from Twitter are used to analyze the activity pattern of users from two different viewpoints. The first monitors the activity of Twitter users during the event—The arrival of visitors, where they came from, and the use which residents and tourists made of different areas of the city. The second assesses the spatiotemporal use of the city by Twitter users before the event, compared to the use during and after the event. The results not only reveal which spaces were the most used while the Games were being held but also changes in the urban dynamics after the Games. Both approaches can be used to assess the impacts of mega-events and to improve the management and allocation of urban resources such as transport and public services infrastructure.

1. Introduction

Mega-events can be defined as events that attract a large number of visitors, have a large mediated reach, come with high costs and have a large impact on the built environment and the host population [1]. The importance of sporting, cultural, or political mega-events is confirmed by the competition between cities to host them [2]. A substantial body of literature about mega-events has risen over recent decades, both theoretical [3,4] and empirical, based on case studies [5,6,7,8,9]. These studies have mainly focused on the impact of mega-events from different perspectives such as economic, tourism and commercial; infrastructure and physical resources; political; sport and recreation; environmental; and socio-cultural [7,10,11].
Most previous studies conclude that mega-events, especially mega-sporting events, benefit host regions in terms of city branding, urban regeneration, and international investment, and creating substantial and long-term economic impacts [12]. The Olympic Games, in particular, constitute an opportunity to transform urban areas that have become obsolete in terms of use, for example, industrial areas, into areas related to the service economy [13,14,15]. Despite all these studies, there is limited knowledge about the effects of mega-events (particularly the Olympic Games) on the activity levels of the host city and in areas not only restricted to the event facilities. This paper aims to analyze the Rio 2016 Olympic Games and its influence on the spatiotemporal dynamics of the host city. For that purpose, we will explore the potential of Location-Based Social Networks (LBSN) and particularly Twitter data. The following research questions will be addressed:
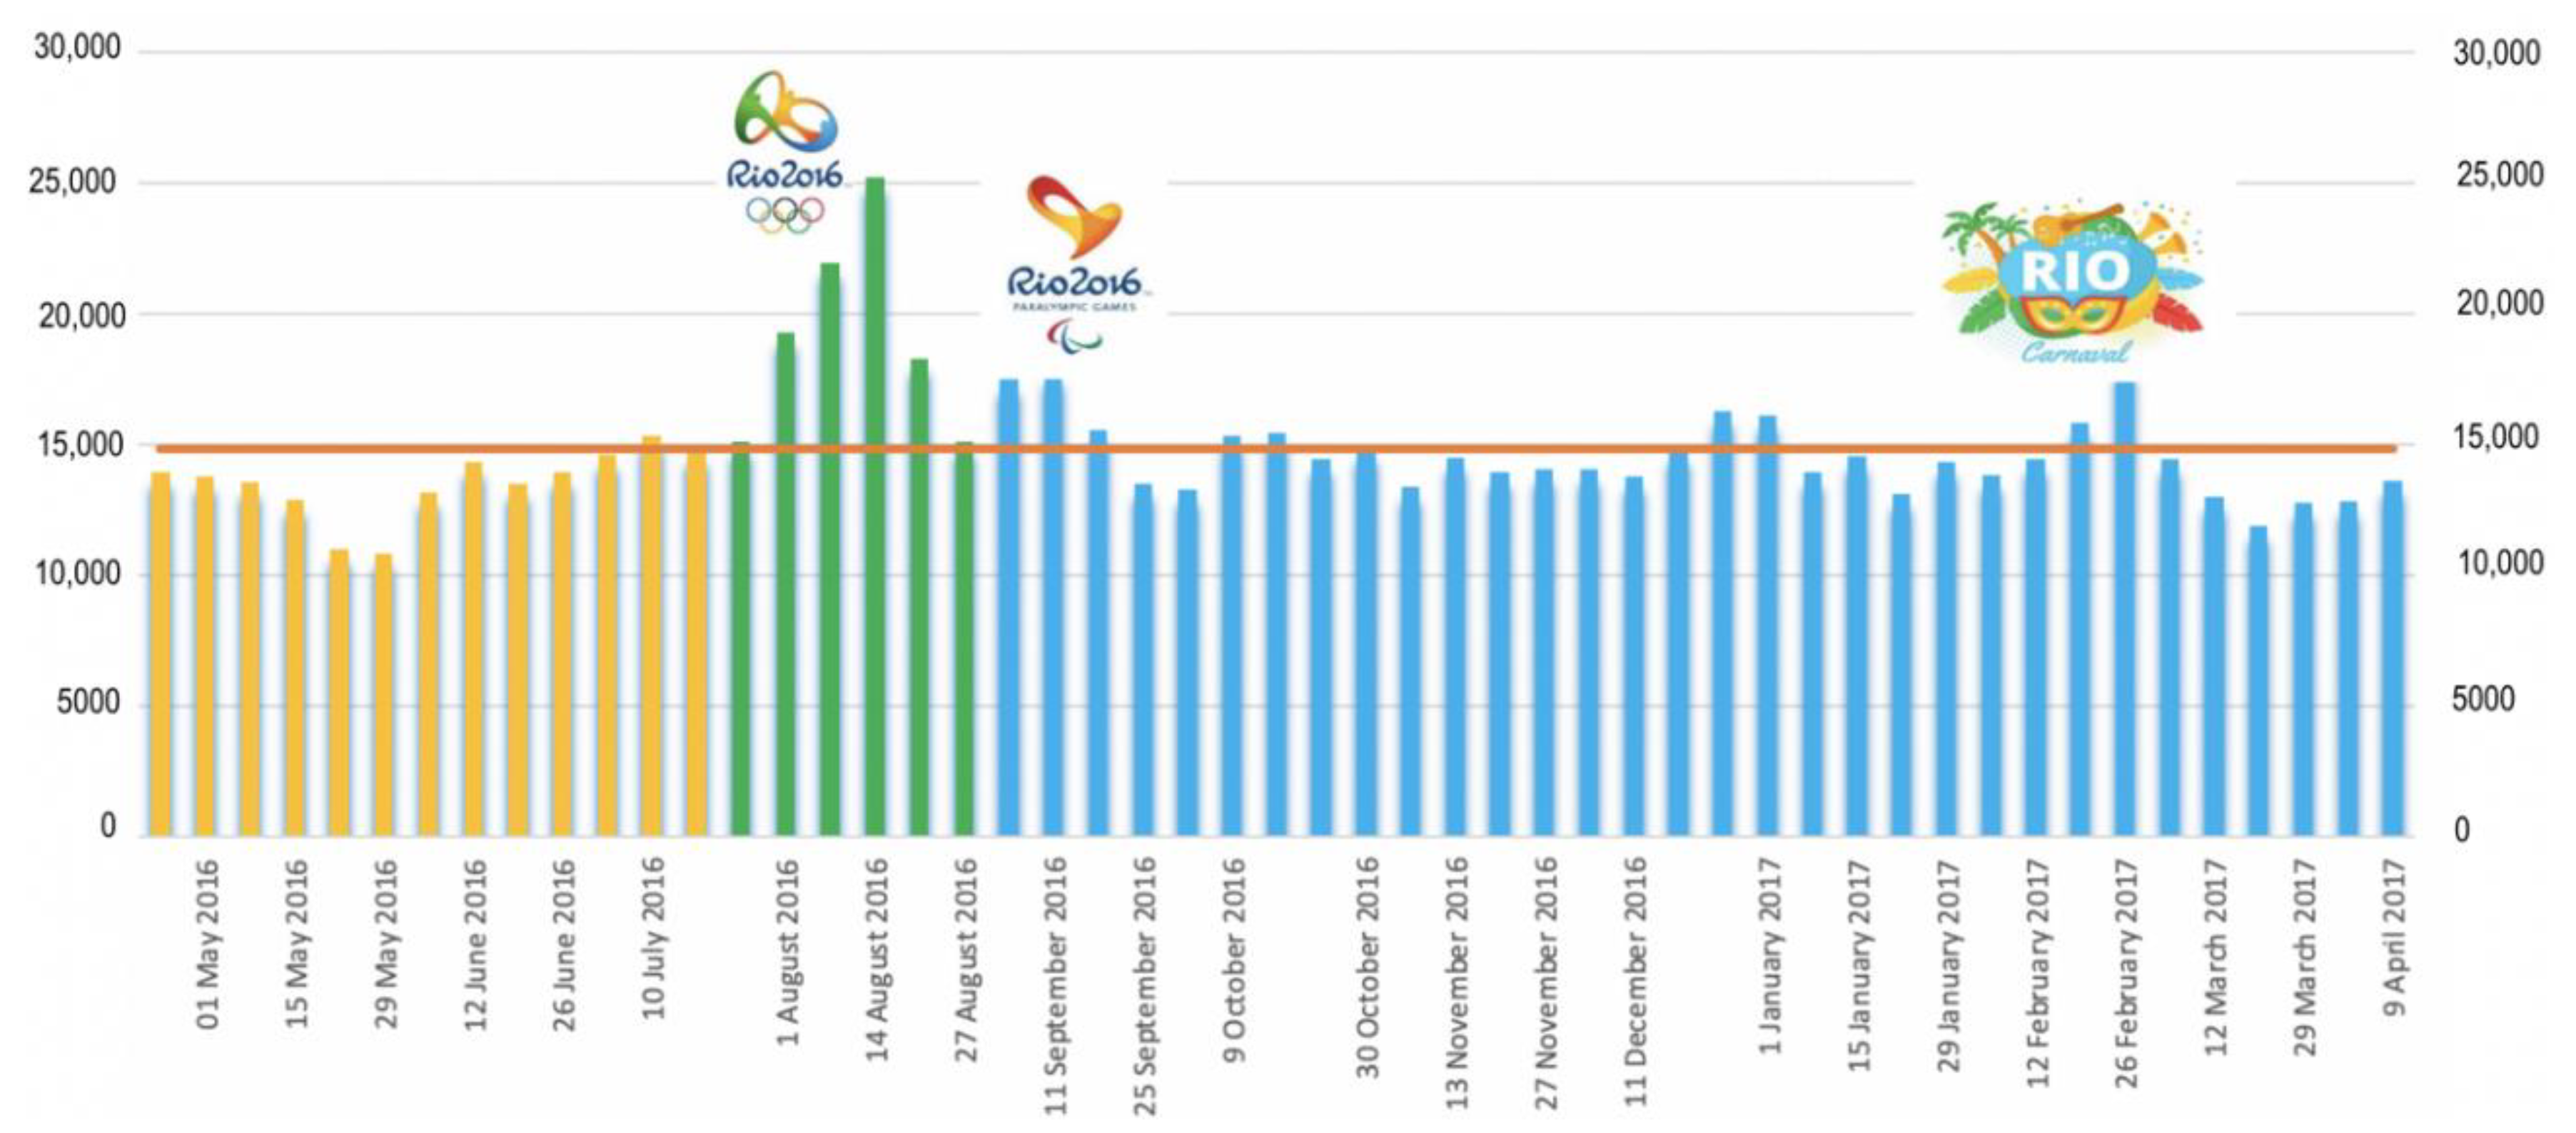
  • What was the impact of the Olympic Games on the number of Twitter users in the study area and in comparison to other events occurring in the city during the analyzed period?
  • What was the proportion of visitors to the Olympic Games and the degree of language diversity?
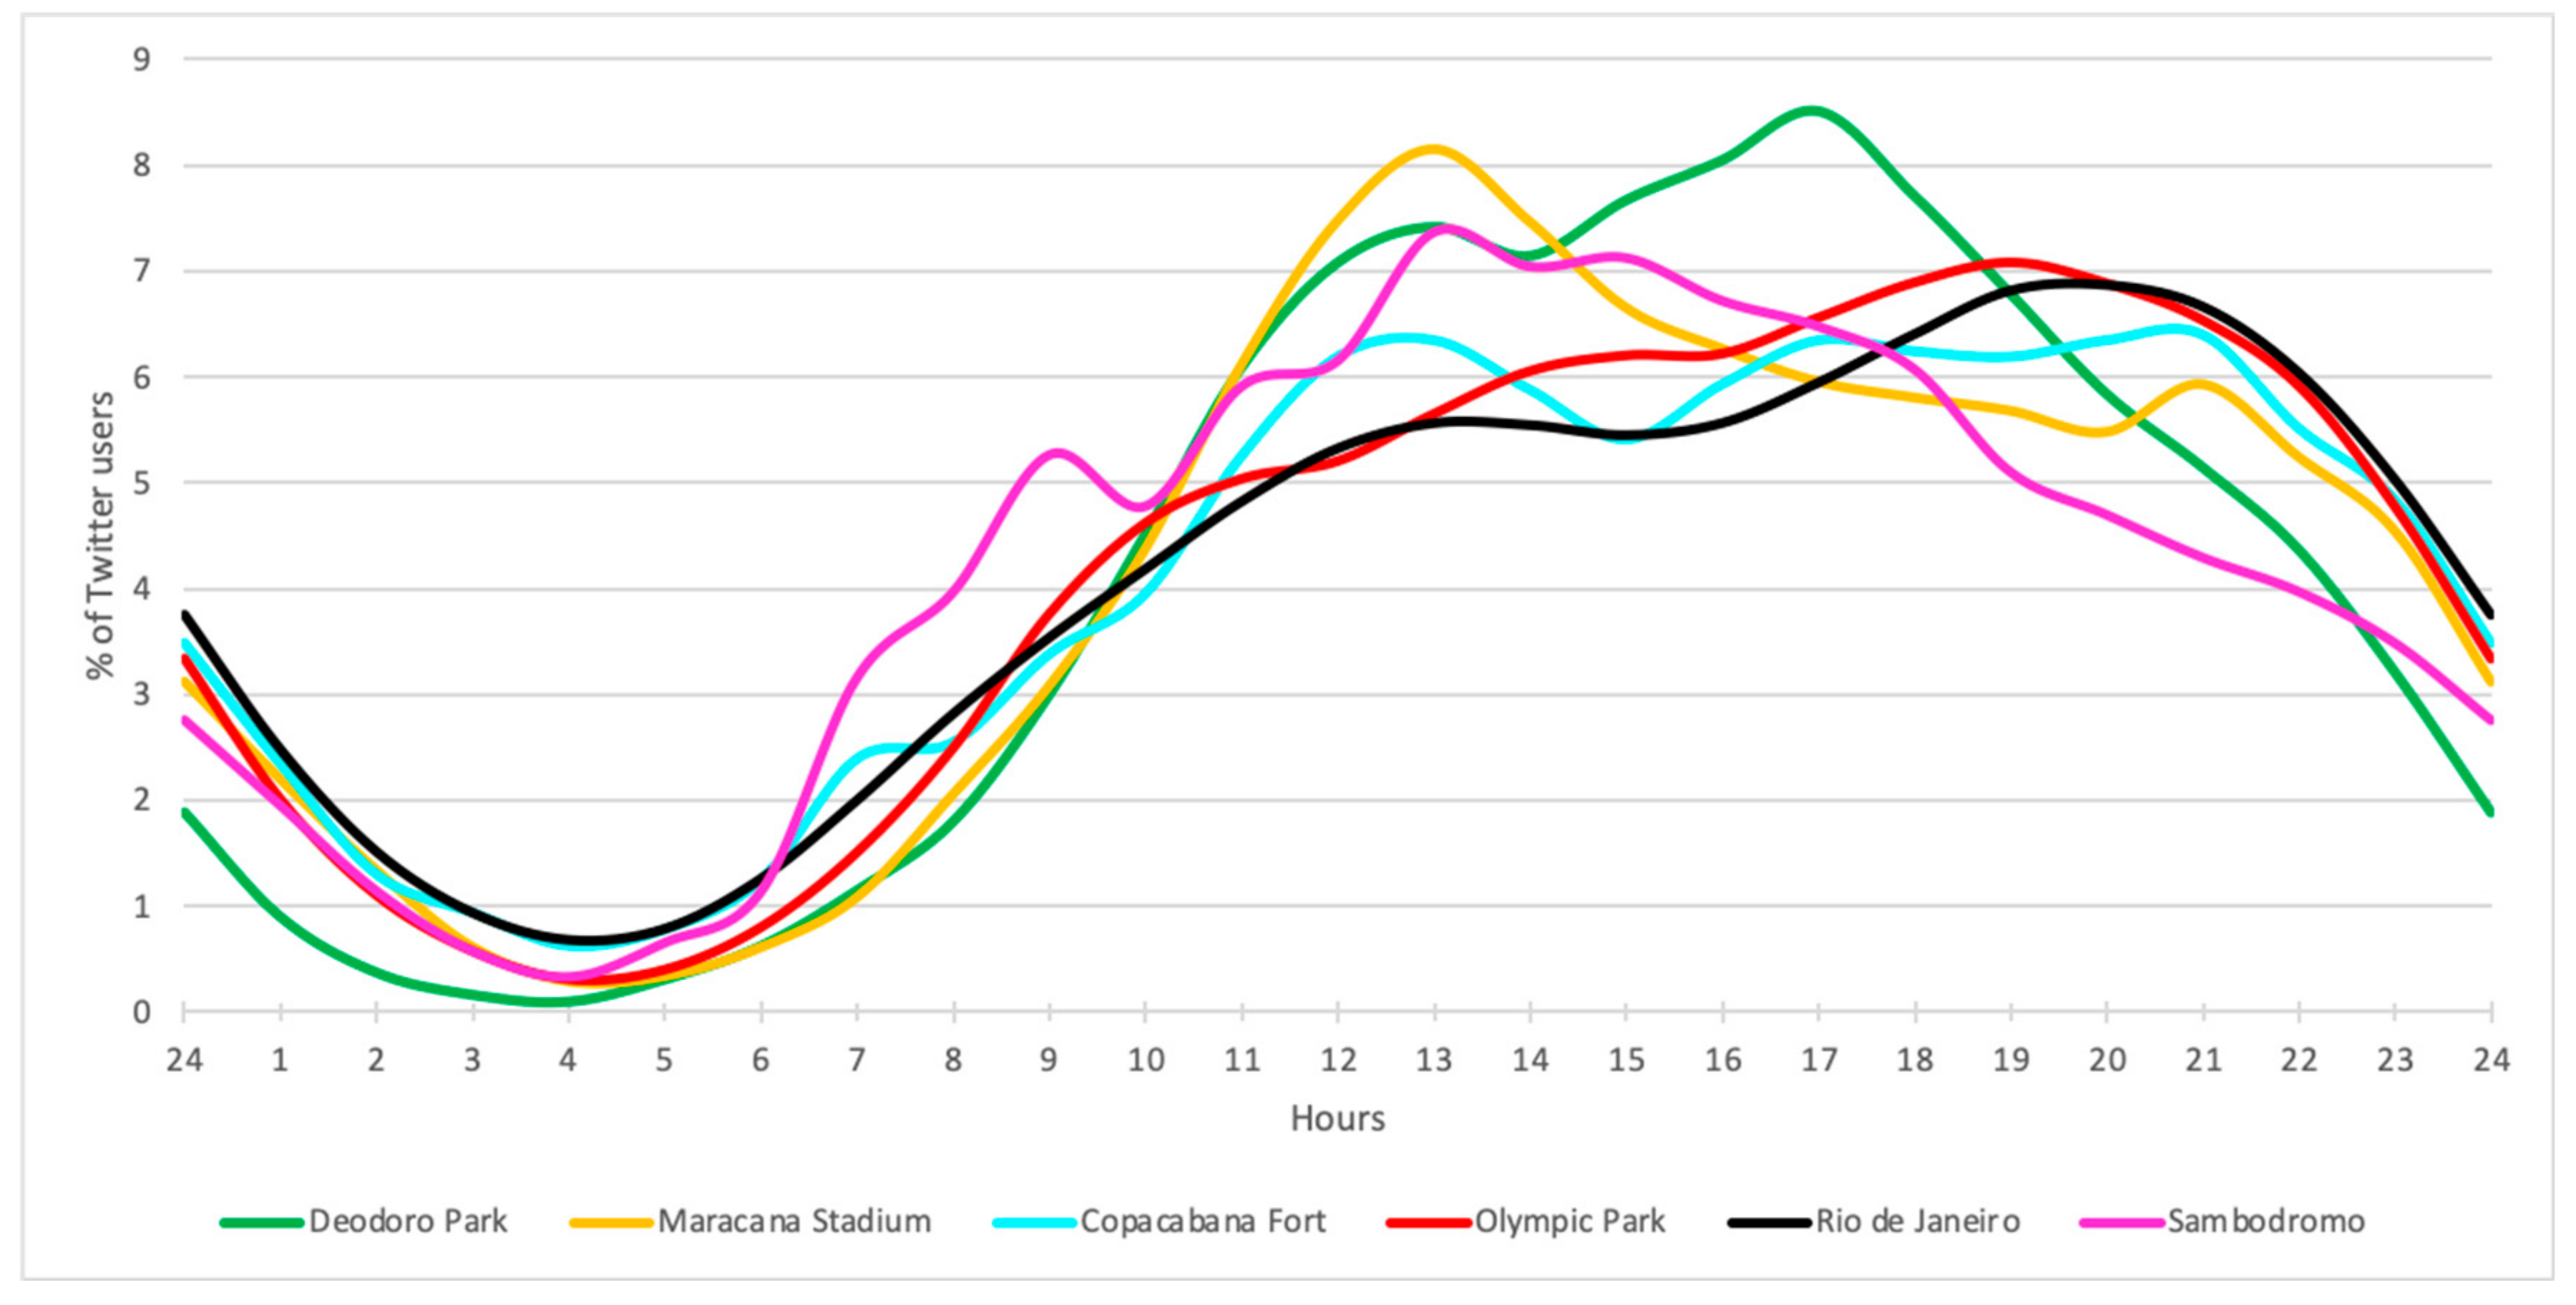
  • Which was the daily dynamic of Olympic venues in terms of user presence?
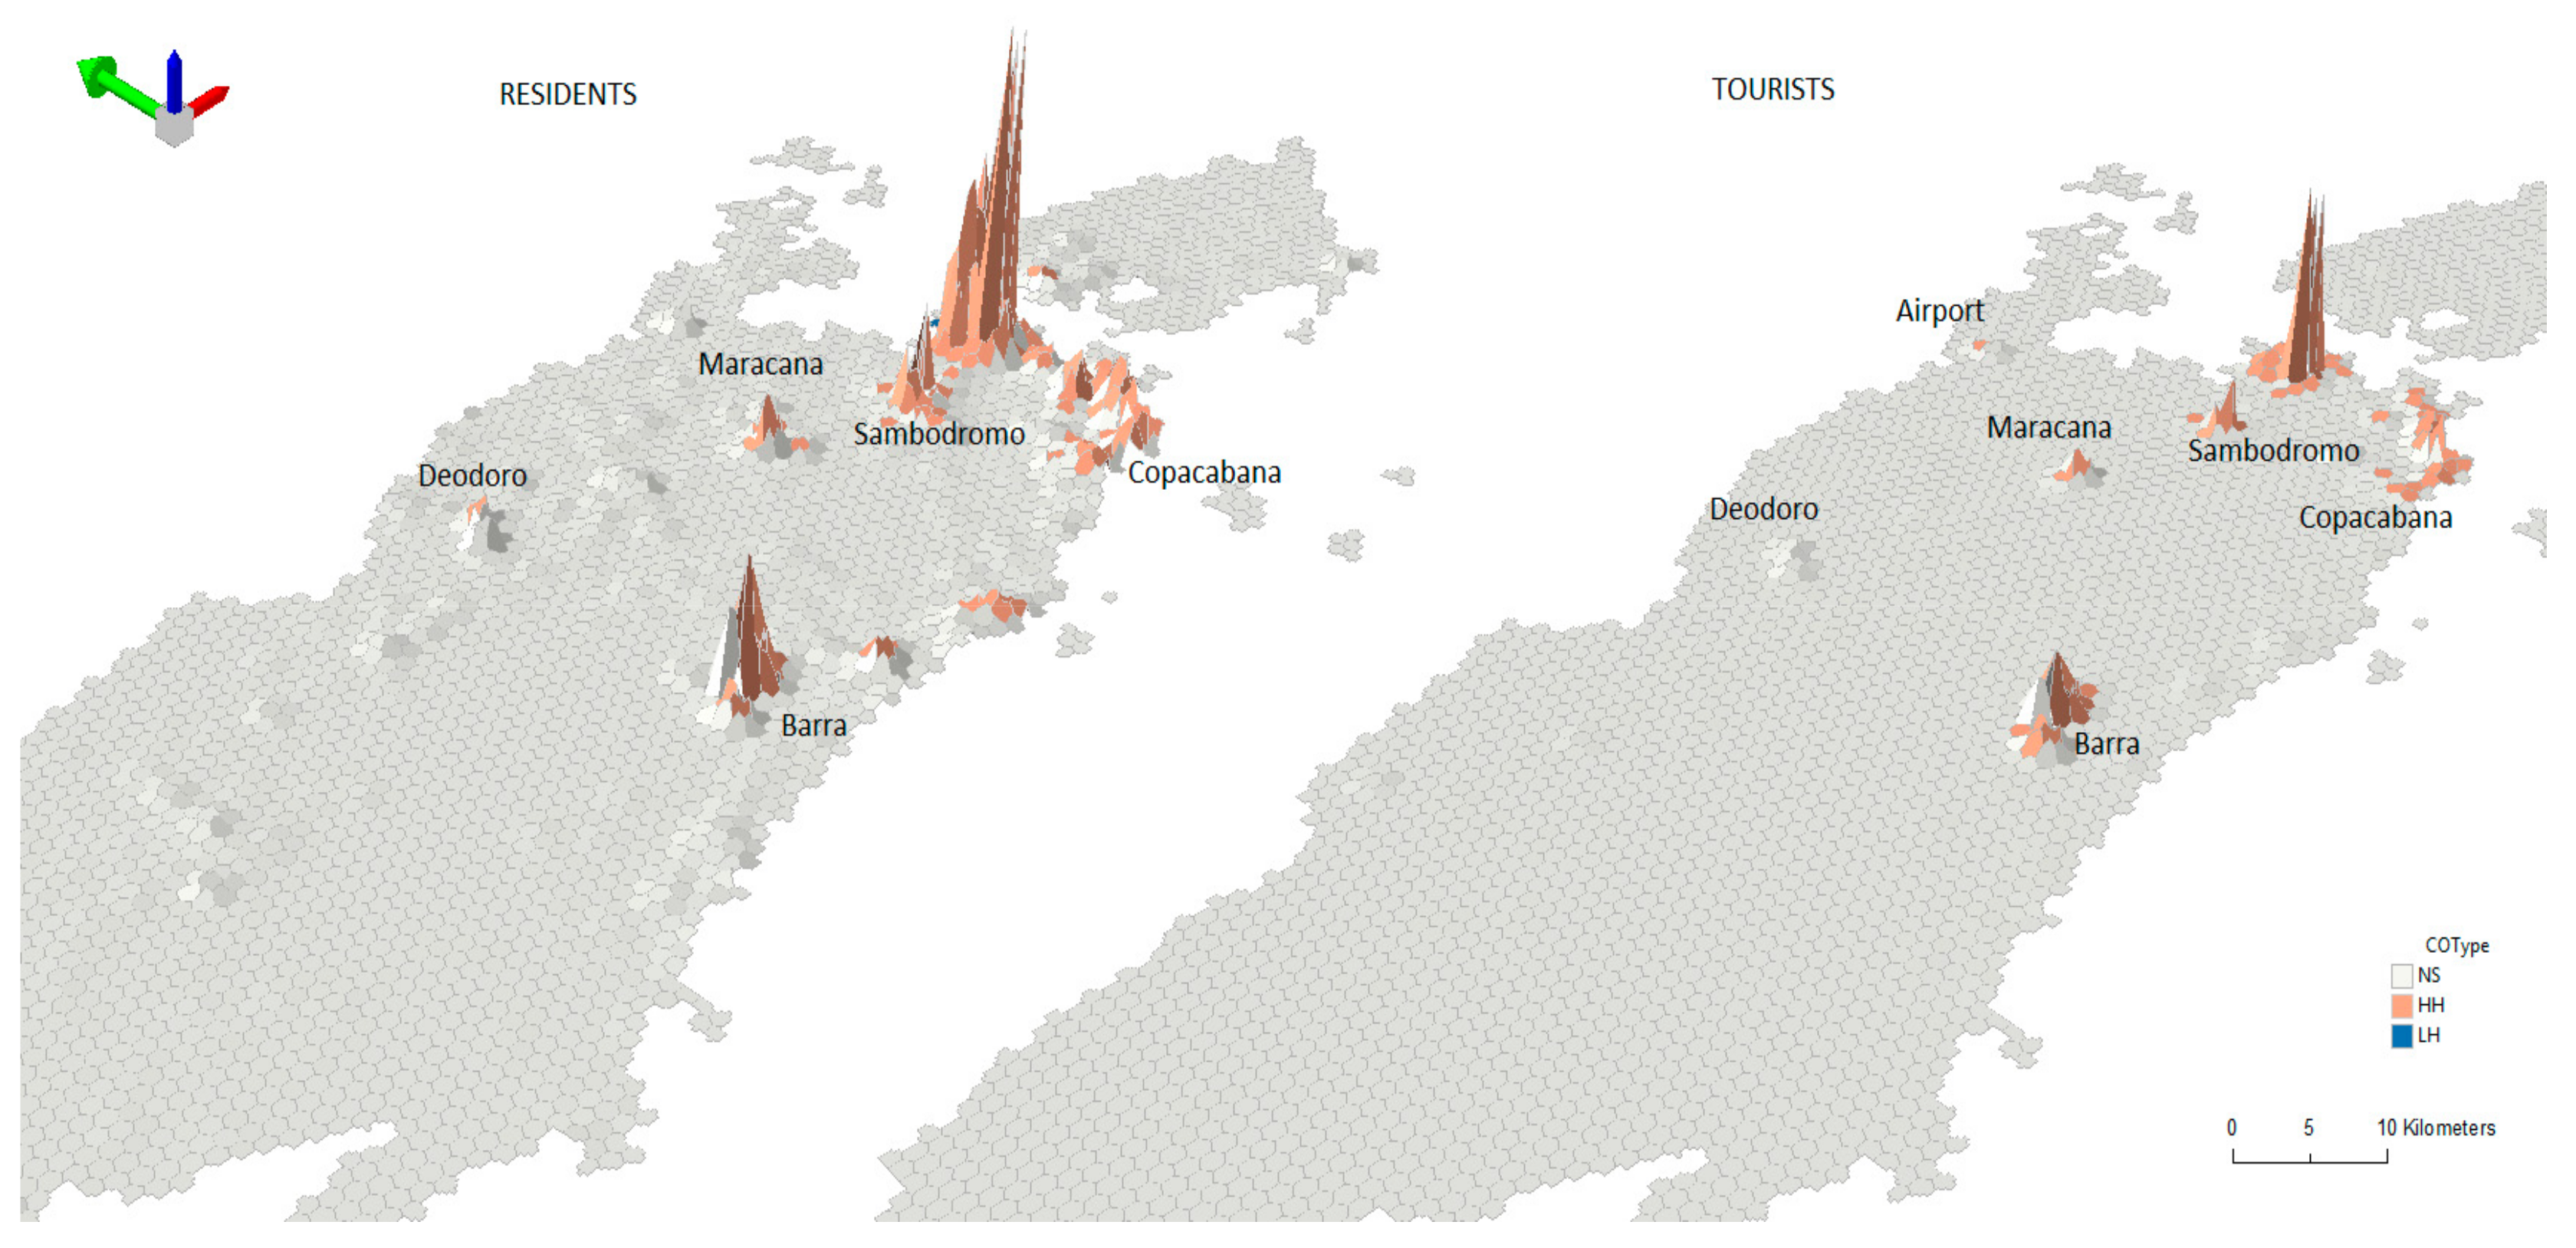
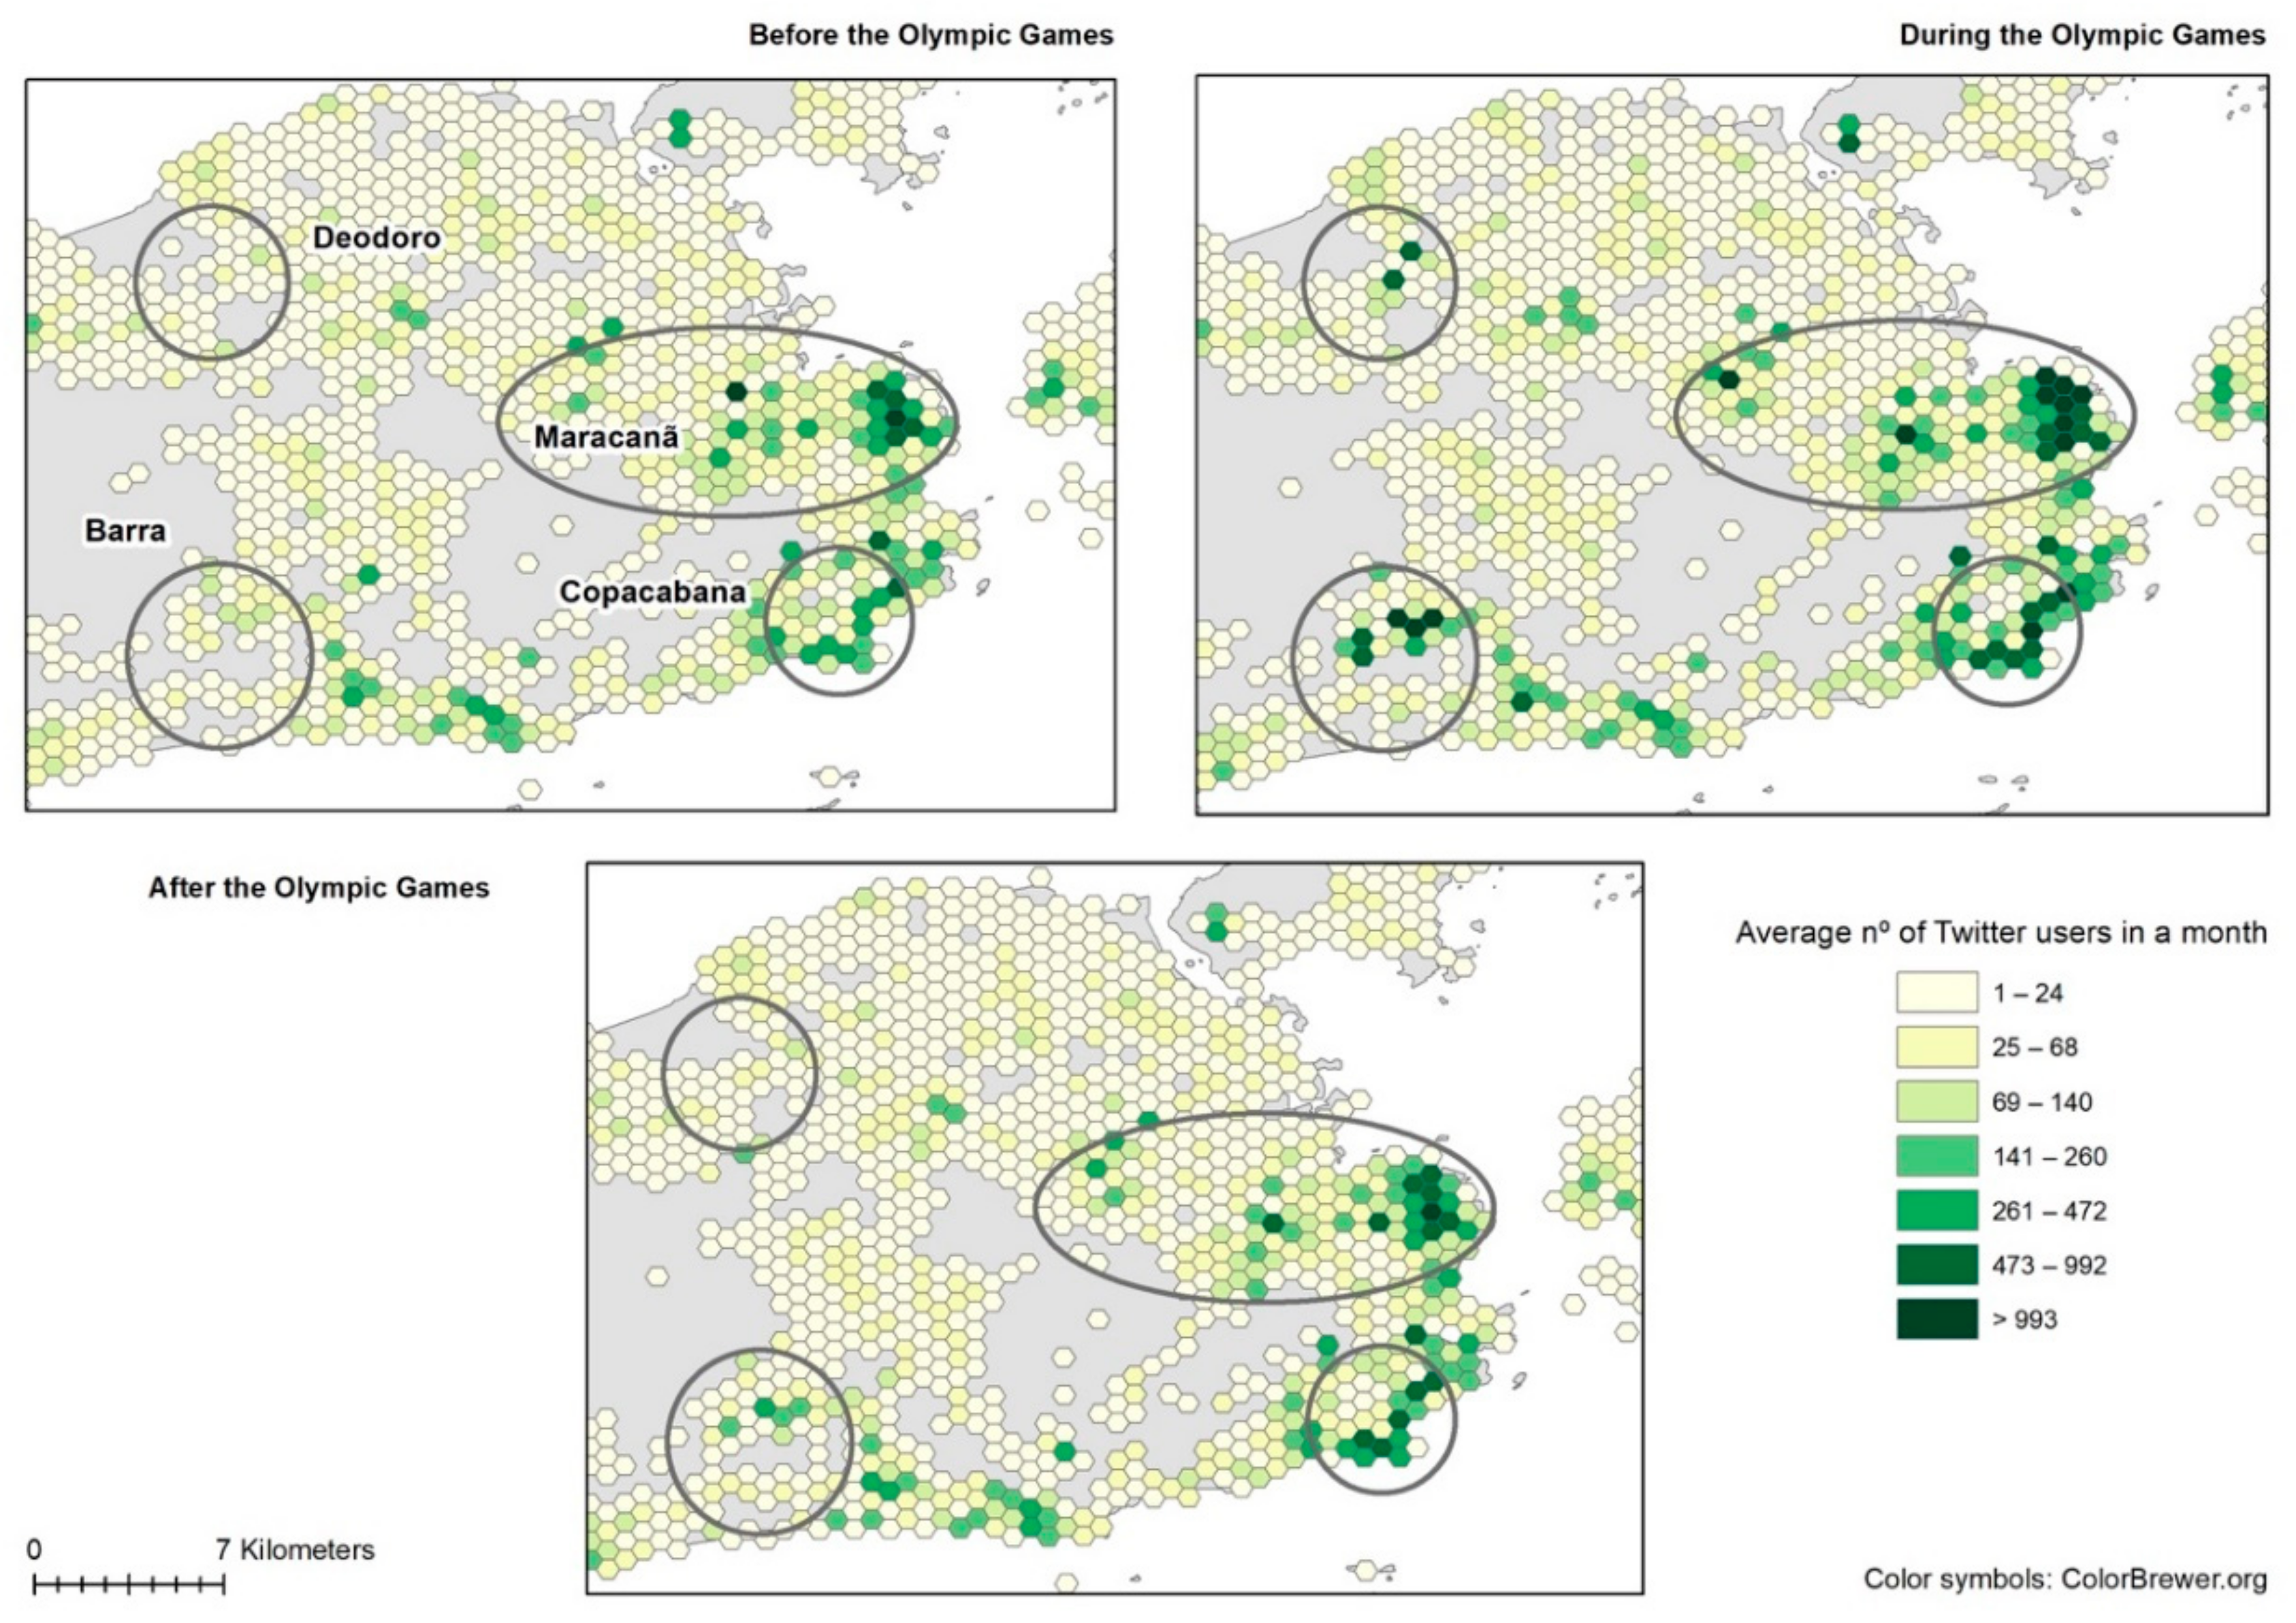
  • Which areas of Rio de Janeiro were most frequented by users before, during, and after the Games?
  • Which areas were more/less successful in retaining users′ activity after the Olympic Games?
The remainder of this paper is organized into the following five sections: (1) a literature review on mega-events, event tourism, and LBSN data opportunities; (2) a description of the case study; (3) data sources and the methodological approach; (4) an analysis of the spatiotemporal distribution of Twitter users in Rio de Janeiro before, during and after the Olympic Games, and the impacts of this mega-event in terms of residents′ and tourists′ activity patterns; and (5) a discussion of main conclusions.

2. Literature Review

2.1. Mega-Events, Tourism, and Impacts on the Host City

International mega-events, such as the Olympic Games, have become key for host cities seeking economic growth, urban development dynamics, and city image branding [12,16,17,18]. Mega-events are also frequently considered as a highly significant tourist asset for a host city; firstly, because they directly attract participants, and secondly, because they increase general visitation as a result of the raised profile of the area [19]. The issue has aroused significant scientific interest and has spawned a substantial number of studies. There is a particular abundance of Olympics-related literature, regarding its economic impacts, tourism and urban regeneration [20,21,22,23,24], or the attitudes of the host population concerning the Games and its impacts [25,26,27,28,29,30].
Nevertheless, mega-events also disrupt cities′ routines and negatively impact on mobility by increasing travel times [31], thereby decreasing the appeal of hosting a sports mega-event [32,33] due to the financial, environmental [26,34] and social costs [35,36]. Some authors have pointed out the dramatic overestimation of the economic benefits of mega-events, warning about the limited effects observed during post-event assessment, and in the long term in general [37].
Tourism legacy is often used as a primary justification for staging mega-events [38]. A recurrent question among stakeholders and managers has been whether the Olympic Games can effectively be used to increase tourism in the host city or country, with an emphasis on the concept of event tourism, whether these levels of tourism can be maintained after the Games, or whether the boost given to tourism by mega-events is ephemeral and temporary [3,39,40].

2.2. Location-Based Social Network Data Applied to Study the Impacts of Mega-Events

Despite the intensive use of cellular phone records to analyze human mobility [41,42,43,44,45], the high fragmentation of the mobile telecom market limits the availability of a worldwide dataset, and access to data from telephone companies is extremely difficult. Consequently, data from Location-Based Social Networks (LBSN) such as Twitter, Facebook, Foursquare, Flickr or Instagram has become a good alternative [46]. Thanks largely to its ready availability, the analysis of Twitter data has started receiving considerable attention from academics as a source for opinion mining and trend tracking, with a focus on message content and users′ features [47,48].
Twitter is among the most used sources of data for urban and mobility studies. Geolocated tweets constitute a useful tool for urban studies since they allow a spatiotemporal tracking/tracing of users (e.g., the times and places that concentrate the highest number of users). For instance, Lansley and Longley [47] set out to identify trends on Twitter during typical weekdays in Inner London, using a large sample of geotagged tweets to investigate how key Twitter behavior trends vary across space and time and among user characteristics. The spatial distribution of tweets has revealed to be a good proxy for representing: (a) population densities [49,50]; (b) social characteristics of neighborhoods [51,52,53]; (c) identification of a city′s spatial structure and urban land uses [37,54,55]; (d) human and crowd mobility patterns, going beyond the home-based data offered by conventional geodemographic data sources [46,56,57,58,59,60,61,62,63]; (e) the study of tourism comparing tourist behaviors between cities (both on a national and global scale) or examining local spatial patterns [63,64,65,66,67,68,69,70]; (f) real-time notification and anomalous activity detection, with the potential to inform emergency services [71]; and (g) sentiment analysis and opinion mining [72].
Different analyses have been undertaken to evaluate the impacts of mega-events on cities (pre- and post-event evaluation). LBSN has become a good alternative for exploring events, such as the Oscars ceremony [73], the Olympic Games [68,69,74] and the Super Bowl [75]. Interesting applications can also be found in the field of identifying planned or unexpected events in space and time [76,77,78,79,80,81,82,83,84,85]. However, more research is needed at intra-urban levels of analysis, in particular for gaining an understanding of activity levels during mega-events and potential changes occurring after all urban regeneration processes associated with this type of event.
In the current study, we go a step further in the analysis of the spatiotemporal distribution of Twitter users in the context of a mega-event such as the Rio Olympic Games, with several contributions to the existing literature of mega-events:
  • The analyzed period includes the entire Olympic cycle, distinguishing between the periods before, during, and after the Games, in order to identify potential structural changes in the use of certain areas of Rio de Janeiro, directly linked with the investments made in the city.
  • The collection of data is a key issue here. Most previous studies on event-related analyses have focused on surveys. In this study, we use Twitter data that has an important potential for spatiotemporal assessment, given its broad geographic distribution of users and its high resolution, both spatial (X, Y coordinates) and temporal (precise time of Twitter messages).
  • We analyze Twitter users instead of Twitter messages (tweets), which represents a more meaningful unit of analysis in terms of urban planning and mitigates the effect of compulsive users posting several messages at similar spaces and times.
  • During the games, we differentiate between residents and visitors and analyze the different spatiotemporal patterns.
Nonetheless, the use of geolocated tweets implies certain limitations to our study which we would like to acknowledge here. First of all, geotagged tweets downloaded from the Twitter Streaming API account are approximately just 1% of all the messages that are sent using the Twitter service [85]. The strategy followed to mitigate this small proportion of tweets is to “harvest” messages for long periods. In our case, we were downloading data for almost a year, collecting a total of 2.9 million tweets, as we explain in Section 4.1. A further consideration is that this social network is mainly used by young adults between the ages of 20 and 30 [86], and this fact may be taken into account when interpreting the result.

3. Materials and Methods
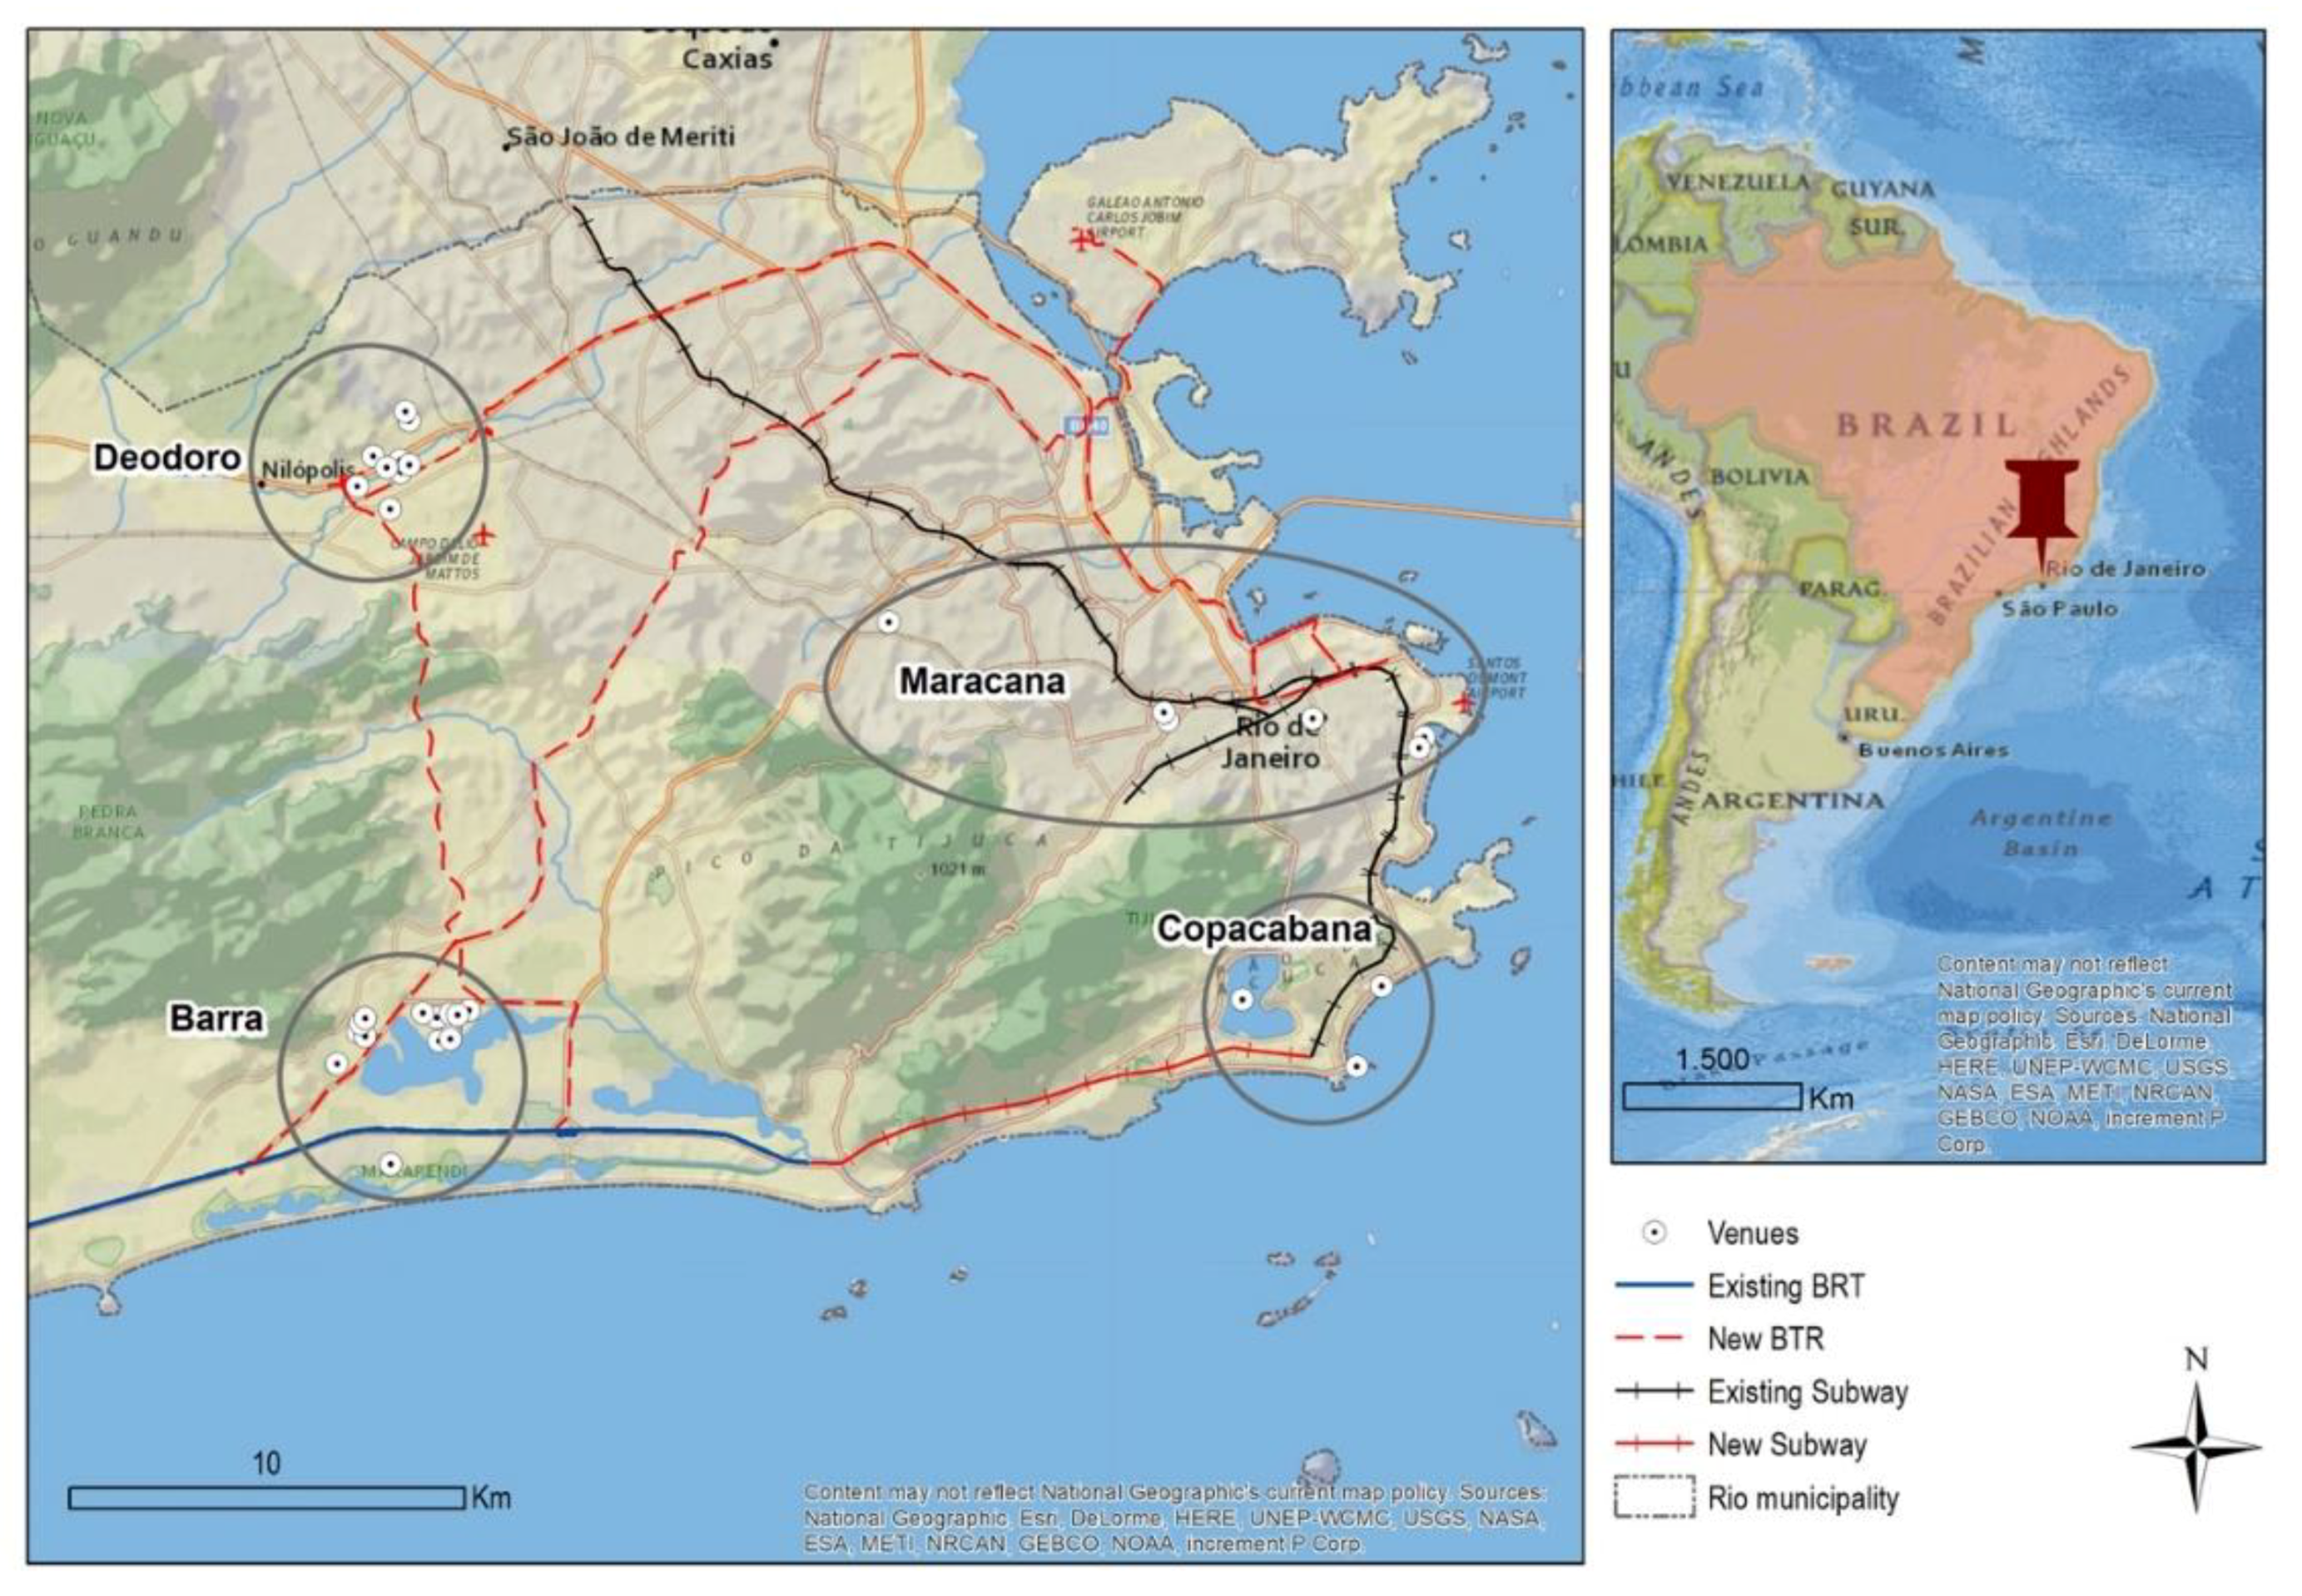
3.1. Case Study

Over the last years, Rio de Janeiro has become a hub for world mega-events [32]: The Pan American Games, the 5th CISM Military World Games in 2007, the 2012 Rio + 20, the 2013 World Youth Day, the FIFA World Cup in 2014 and the Olympics in 2016. This paper focuses on the Rio 2016 Olympic Games, which led to extensive urban transformation, thanks to new sports venues and a series of projects associated with mobility, housing, and the environment. The highest amount of investment was received by four main areas: Barra, Deodoro, Maracanã, and Copacabana (Figure 1):
(1)
Barra is a beautiful, dynamic area with zones given over to both nature and leisure. In recent years, it has experienced the greatest residential expansion in the city of Rio. The Olympic Park, one of the greatest legacies to Rio of the Olympic Games, was built in this area. As home to 14 of the 31 sports venues, there was massive investment in its residential and commercial areas and transport infrastructure. Investment in this area includes more than 2400 high-class homes [87] and two new Bus Rapid Transport lines (BRT), namely the Transolímipica and the Transcarioca, which connect this area to the north and center of the city. It is important to note that before the Olympic Games, this area had weak links to the city center and the most famous tourist sites.
(2)
The Deodoro area is a less economically developed and peripheral location with several nearby slum neighborhoods—Favelas. It was the second major area in terms of Olympic sites, new leisure zones, and new BRT connections.
(3)
The Maracanã area includes some of Rio′s most famous icons, such as the Maracanã stadium and the Sambodromo. It also includes the city center and port area. For the Olympic Games, a new middle-class residential area was built near the Maracanã stadium. Furthermore, a complete restructuring of the port area was undertaken, with new residential areas for the lower economic classes and sites destined for leisure and tourism.
(4)
Finally, Copacabana is a privileged area, thanks to its beaches, mountains, and famous tourist attractions. This densely populated area did not experience any noteworthy changes in terms of sports venues and residential areas. However, in terms of transport infrastructure, it benefited from the construction of subway line 4, which extended the existing line 1 and connected it to the Barra neighborhood.
Apart from these Olympic areas, other improvements in road infrastructure were carried out in different parts of the city. Transport infrastructure projects promote accessibility gains [88]. However, access inequalities in the city of Rio seem to remain [89].
After the Olympic period, some of the Olympic venues were opened to the general public, as in the case of the Olympic Park. In other cases, it was clear that the Olympic sites were not planned for the current and future needs of the city. One of the most paradigmatic examples was the Canoe Slalom venue (Deodoro area), that opened as a giant swimming pool just after the games and closed in December 2016. Another case was that of the 31 residential towers opposite the Olympic Park (Barra), built as homes for the upper classes, many of which remain unsold after a long time after the event.

3.2. Data and Methods

Twitter data seem remarkably suited to our purposes in our pursuit of an understanding of the impacts on tourism and urban dynamics related to the Olympic Games. Geotagged tweets, in particular, constitute a useful tool for urban studies since they allow spatiotemporal tracking/tracing of users.

3.2.1. Twitter Data Download

Twitter messages (tweets) were downloaded using Python′s package, for requesting petitions to the Twitter Streaming API, and to store data on MongoDB over one year (from April 2016 till March 2017) in order to identify changes in the spatiotemporal distributions of tweets between the periods before, during and after the Games. Only geotagged tweets were downloaded, and those selected covered the city of Rio de Janeiro and Niteroi. Besides tweets′ coordinates, other relevant information for this study is the user ID, the date and time the tweet was posted, the device language setting, and the number of friends and followers. Over 2.9 million tweets were downloaded in the Rio and Niteroi municipalities. The data were loaded into a GIS (ArcGIS 10.4.1), creating a layer of points with the point coordinates of the position from which each of them was posted. The data were then cleaned of bots and compulsive users that did not move, and over 36,000 tweets were excluded. Bots were identified as users having a disproportional number of friends (more than 1500) compared to the number of followers (less than 50), as this is one of the characteristics found in previous works [90]. Compulsive users are defined here as those profiles posting an average of more than 10 messages per day.

3.2.2. Spatial and Temporal Aggregation of Data to Obtain the Number of Unique Active Users

The same user often posts several tweets from the same location at approximately the same time. The number of such tweets from some users can be extremely high, leading to an overestimation of the presence of this type of user at these locations and times. It is, therefore, necessary to analyze unique users rather than tweets. To this end, the tweets were aggregated spatially and temporally (every quarter of an hour) depending on the user ID, to obtain the presence of unique active users in each spatial unit, rather than the number of tweets posted. The spatial aggregation of Twitter data was based on nonoverlapping regular hexagons with sides measuring 400 m in diameter. This zoning was preferred to other administrative boundaries, such as census tracks, because of their irregular size and shape (based on population density). Other studies use diameters of 1 km [53], but in our case, we have selected a 400 m diameter, more in line with the size of Rio′s residential blocks and similar to other studies carried out in Rio de Janeiro where diameters of 500 m are used [88]. Regular hexagons have the advantage of mitigating the problem of modified spatial units [91] since they have the same size and shape.

3.2.3. Temporal Scenarios

The analysis considers three important time periods: the period leading up to the Olympic Games, the period of the event itself, and the period after the Games. The periods analyzed before and after (4 and 9 months, respectively) are ample in order to avoid the effect of temporary fluctuations, for example, holiday periods or other events. The Olympic Games period in this study, between 31 July 2016 and 28 August 2016, covers the two weeks of the event, between 5 August and 21 August 2016, to which one week before and one week after have been added, thereby including the more than probable presence of tourists associated with the Games in the weeks leading up to and following the event. Taking into account the different duration of the periods to be compared, the monthly average of users is used as an indicator of the presence of Twitter users.

3.2.4. Analysis of Spatial Distribution Patterns

When analyzing the spatial distribution of users in the study area, density maps and spatial autocorrelation analysis were obtained, considering the average of Twitter users by hexagons and by month. Density maps provided an initial visual overview of the density distribution of users in Rio before, during, and after the Olympic Games.
Unlike density maps, spatial autocorrelation techniques do not consider each location in isolation but concerning its environment [92]. Anselin′s Local Indicator of Spatial Association (LISA) was calculated separately for the three periods using the inverse distance weighted algorithm (IDW). The IDW algorithm is one of the most used methods for a conceptualization of spatial relations, since it represents Tobler′s first law [93] that states that everything is related to everything else, but near things are more related than distant things. An 1834 m radius was selected after a calibration procedure based on z-scores, as the distance with the highest spatial clustering in our study area. The LISA analysis identified the type of areas according to their activity patterns (high/low concentration of users). The results for the different periods were combined in order to determine the possible change in each area′s activity patterns. For instance, areas can be classified as always having a high concentration of users (High-High clusters or HH), High-High only during the Olympic Games, or High-High clusters during and after the Olympic Games.

4. Results

4.1. Temporal Dynamics

First, an analysis was carried out on the distribution of Twitter users throughout the whole period, focusing on possible changes in the periods before, during, and after the Olympic Games. The Olympic Games started on 5 August and ended on 21 August 2016, and it was observed that the event had an important impact on the number of users in the study area (Figure 2). The number of users increased just before the start of the Games, peaking in the third week, between 14 August to 20 August (70% above the average of the whole period) and decreased after that. A small increase can also be observed during the Paralympic Games, with around 18,000 users (an increment of 20%). We believe the increase in users to be mainly due to tourists, teams of athletes, and other professionals arriving in Rio for the Olympic Games. The data also reveals other peaks at other times of year that are especially attractive to tourists, such as summer or Carnival, with lower increases in the number of Twitter users (between 6 and 20%).

4.2. Visitors to the Olympics

The second step was to determine the differences between residents and tourists in terms of activity patterns. It was, therefore, necessary to differentiate between both groups of users. Tourists of the Olympic Games are defined as those users that only posted during the four weeks of the Games, including one week before and one week after the Games. It was assumed that a “normal tourist” would not come to Rio during this period, considering the elevated prices of travel tickets and accommodation. During this period, more than 15,000 tourists were captured in the study area, representing around 30% of all active users in our data (Table 1). The highest number of active users, both in terms of tourists and residents, were scored in the second and especially the third weeks, coinciding with the central weeks of the games.
Users′ self-declared user interface language can also be extracted from the dataset. This information was used to analyze the diversity of tourists during the Olympic Games. Figure 3 shows that one week before and after the games, Portuguese was the prevalent language of tourists in Rio (especially in the week before). This indicates the importance of national tourism in the city, with 61% of tweets posted by tourists in Portuguese, followed by English (26%) and Spanish (8%). Once the Olympic competitions stared, the situation was reversed, and English became the most used language (rising to 42%), followed by Portuguese and Spanish. Additionally, the mix of languages was much richer during the Games, with the appearance of other languages, such as Russian, Italian, French, or Indonesian, which had a high number of use.

4.3. Urban Dynamics during the Olympic Games

The daily activity of users during the Olympic Games period differs depending on the site analyzed. Figure 4 presents the daily presence of users (%) at different Olympic venues. Resident and tourist users are jointly represented here since no remarkable differences were observed between their use of the Olympic venues. The Olympic Park area (Barra) follows the general pattern observed for the whole study area (dark line), with the highest activity registered around 9 p.m. This pattern, which is also in line with other studies [94], represents activity in an area that is a mix of commercial and residential zones, including the Olympic Village, where most athletes and teams stayed. As a residential area, Copacabana shows similar behavior to that of the Olympic Park, registering another peak between 11 and 12 a.m. Other sites show a much earlier peak around 12 p.m. and 13 p.m. for Maracanã and Sambodromo, and around 16–17 p.m. for Deodoro Park. These patterns reflect the increase in users attending sports events and leaving these areas afterward.
Maps of the spatial distribution of residents and tourists in Rio during the Games (Figure 5) show that residents are present, logically, throughout the city, whereas tourists are concentrated in specific areas. Residents are concentrated in the most densely populated areas of the center of Rio and the Santo Cristo, Santa Teresa, Cadete, and Flamengo neighborhoods; at the same time, although tourists are also found in these areas, they are present in much greater numbers in the areas of Copacabana and Ipanema. The Olympic areas show high densities of both tourists and residents, especially in the Barra and Deodoro areas. The third dimension in Figure 5 represents the number of users during the games. Colors are derived from computing LISA and confirm that the areas previously mentioned form clusters of statistically significant user concentration.

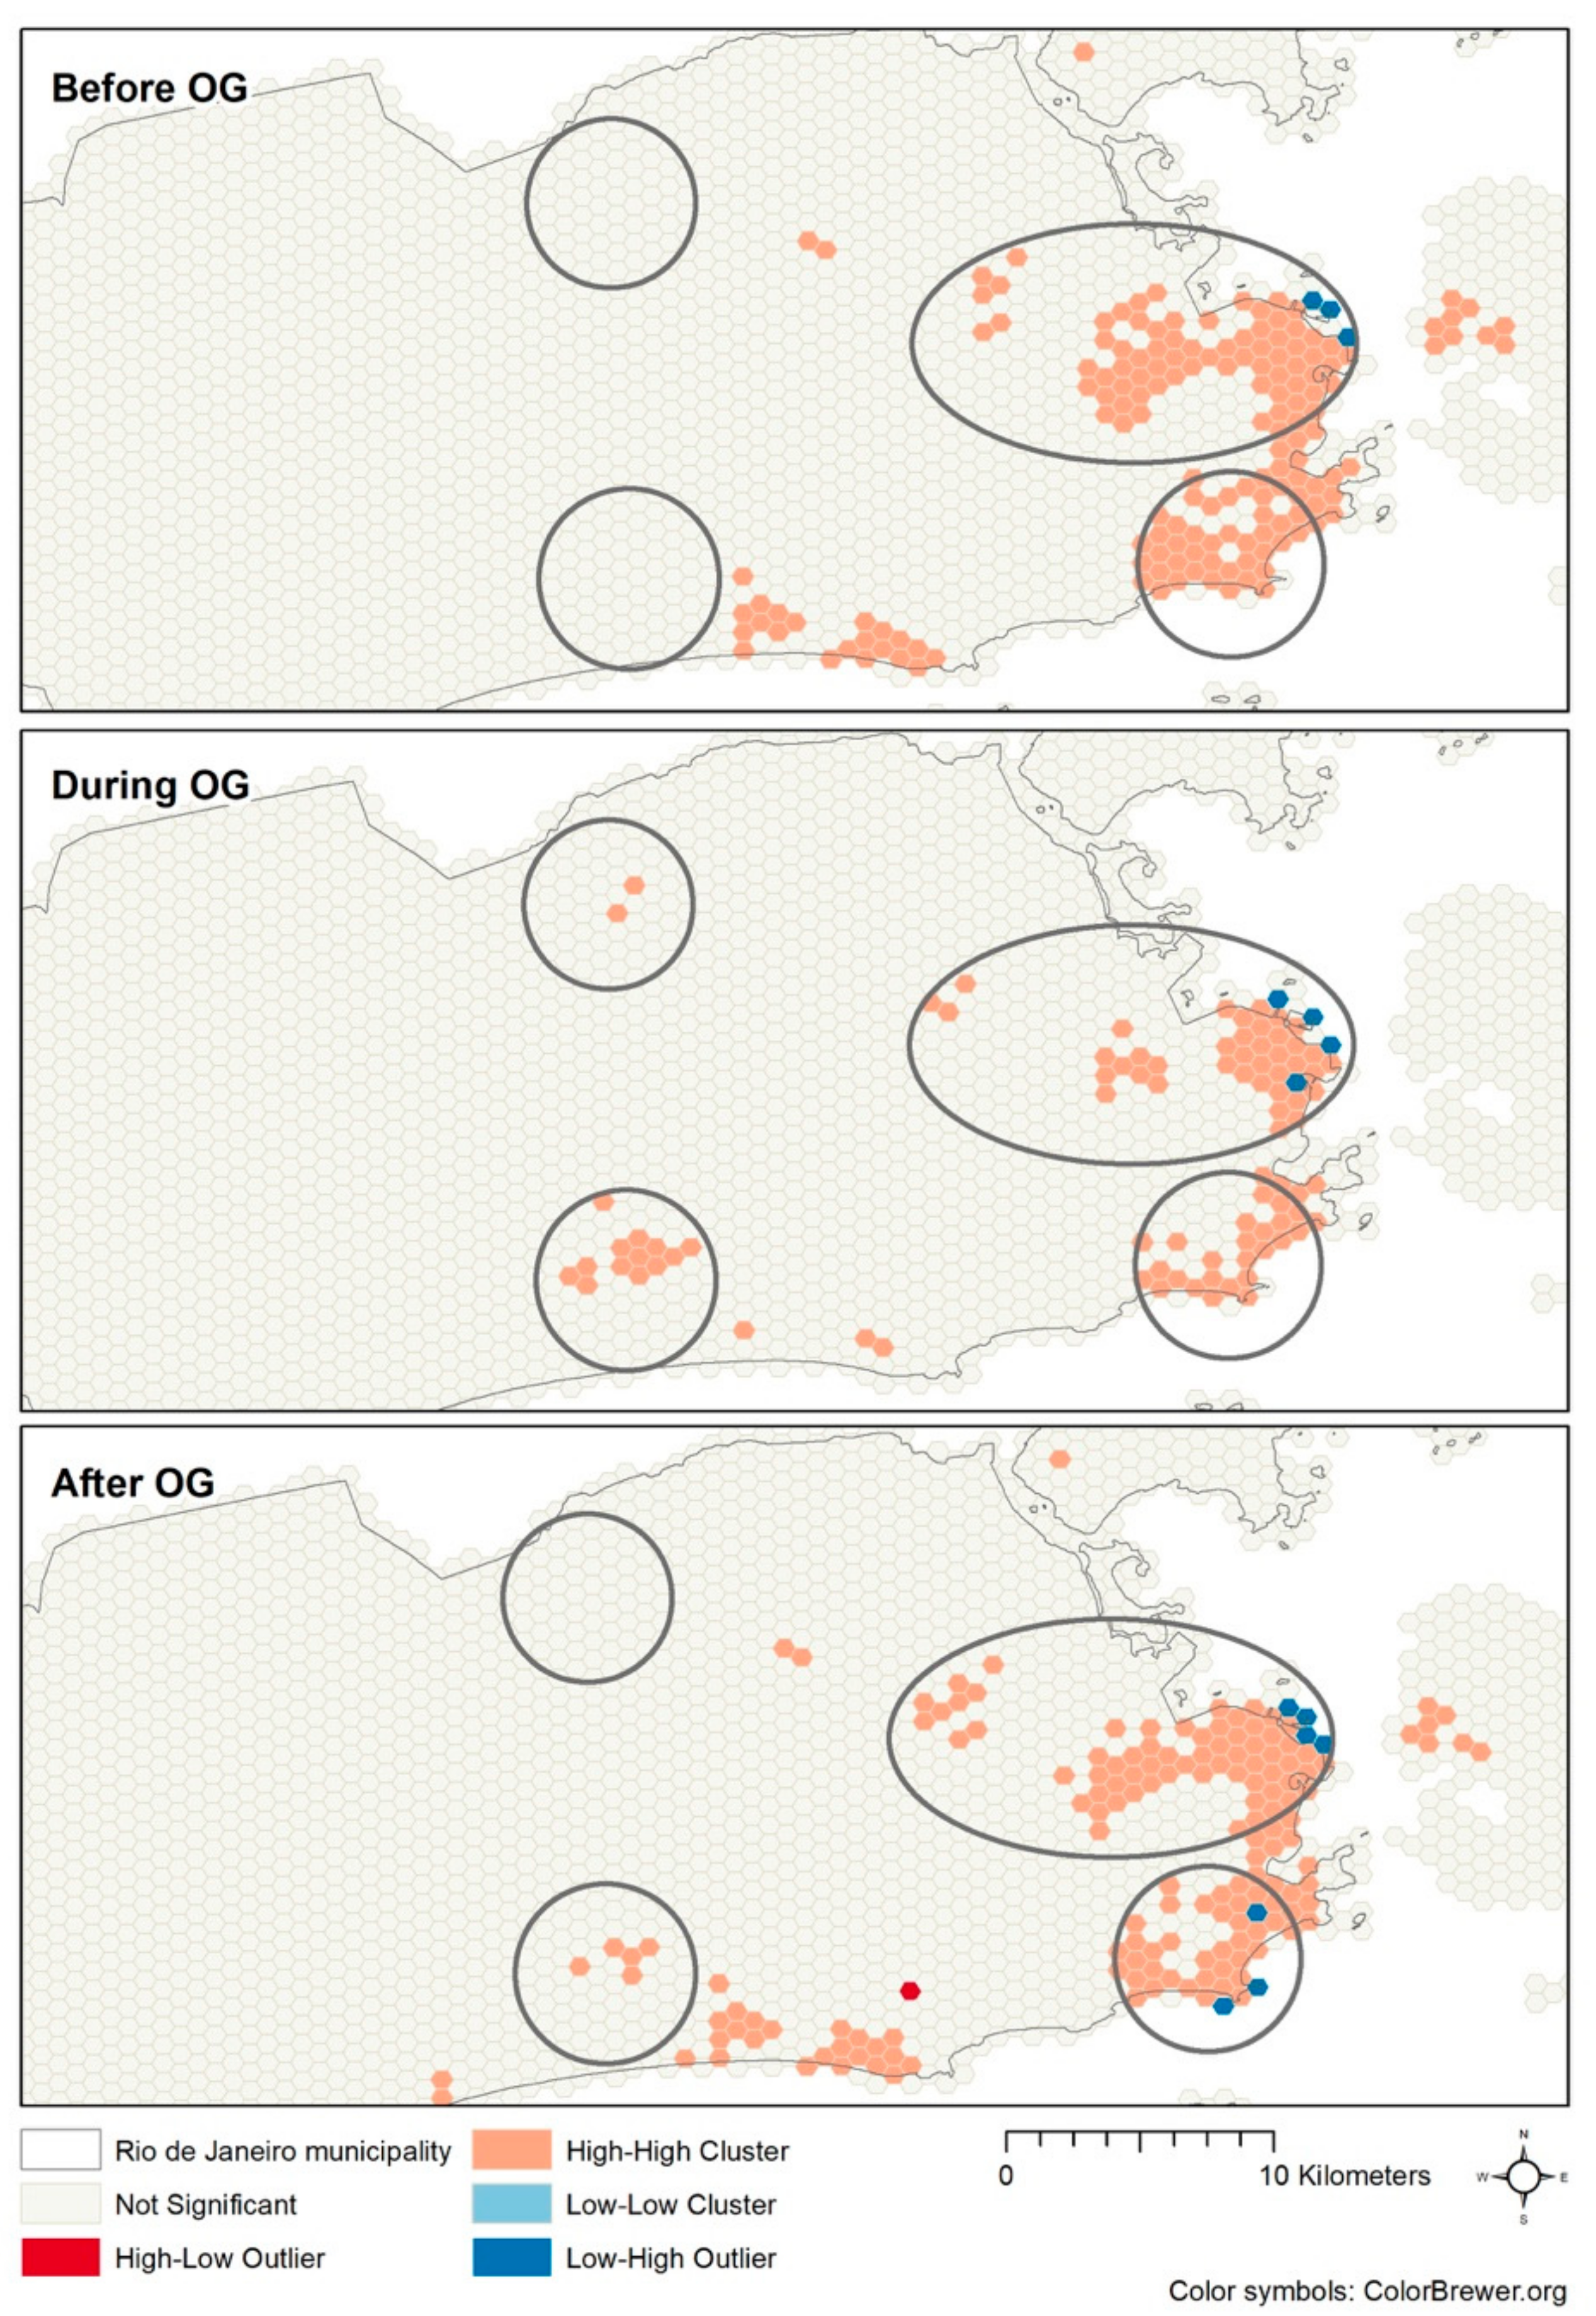
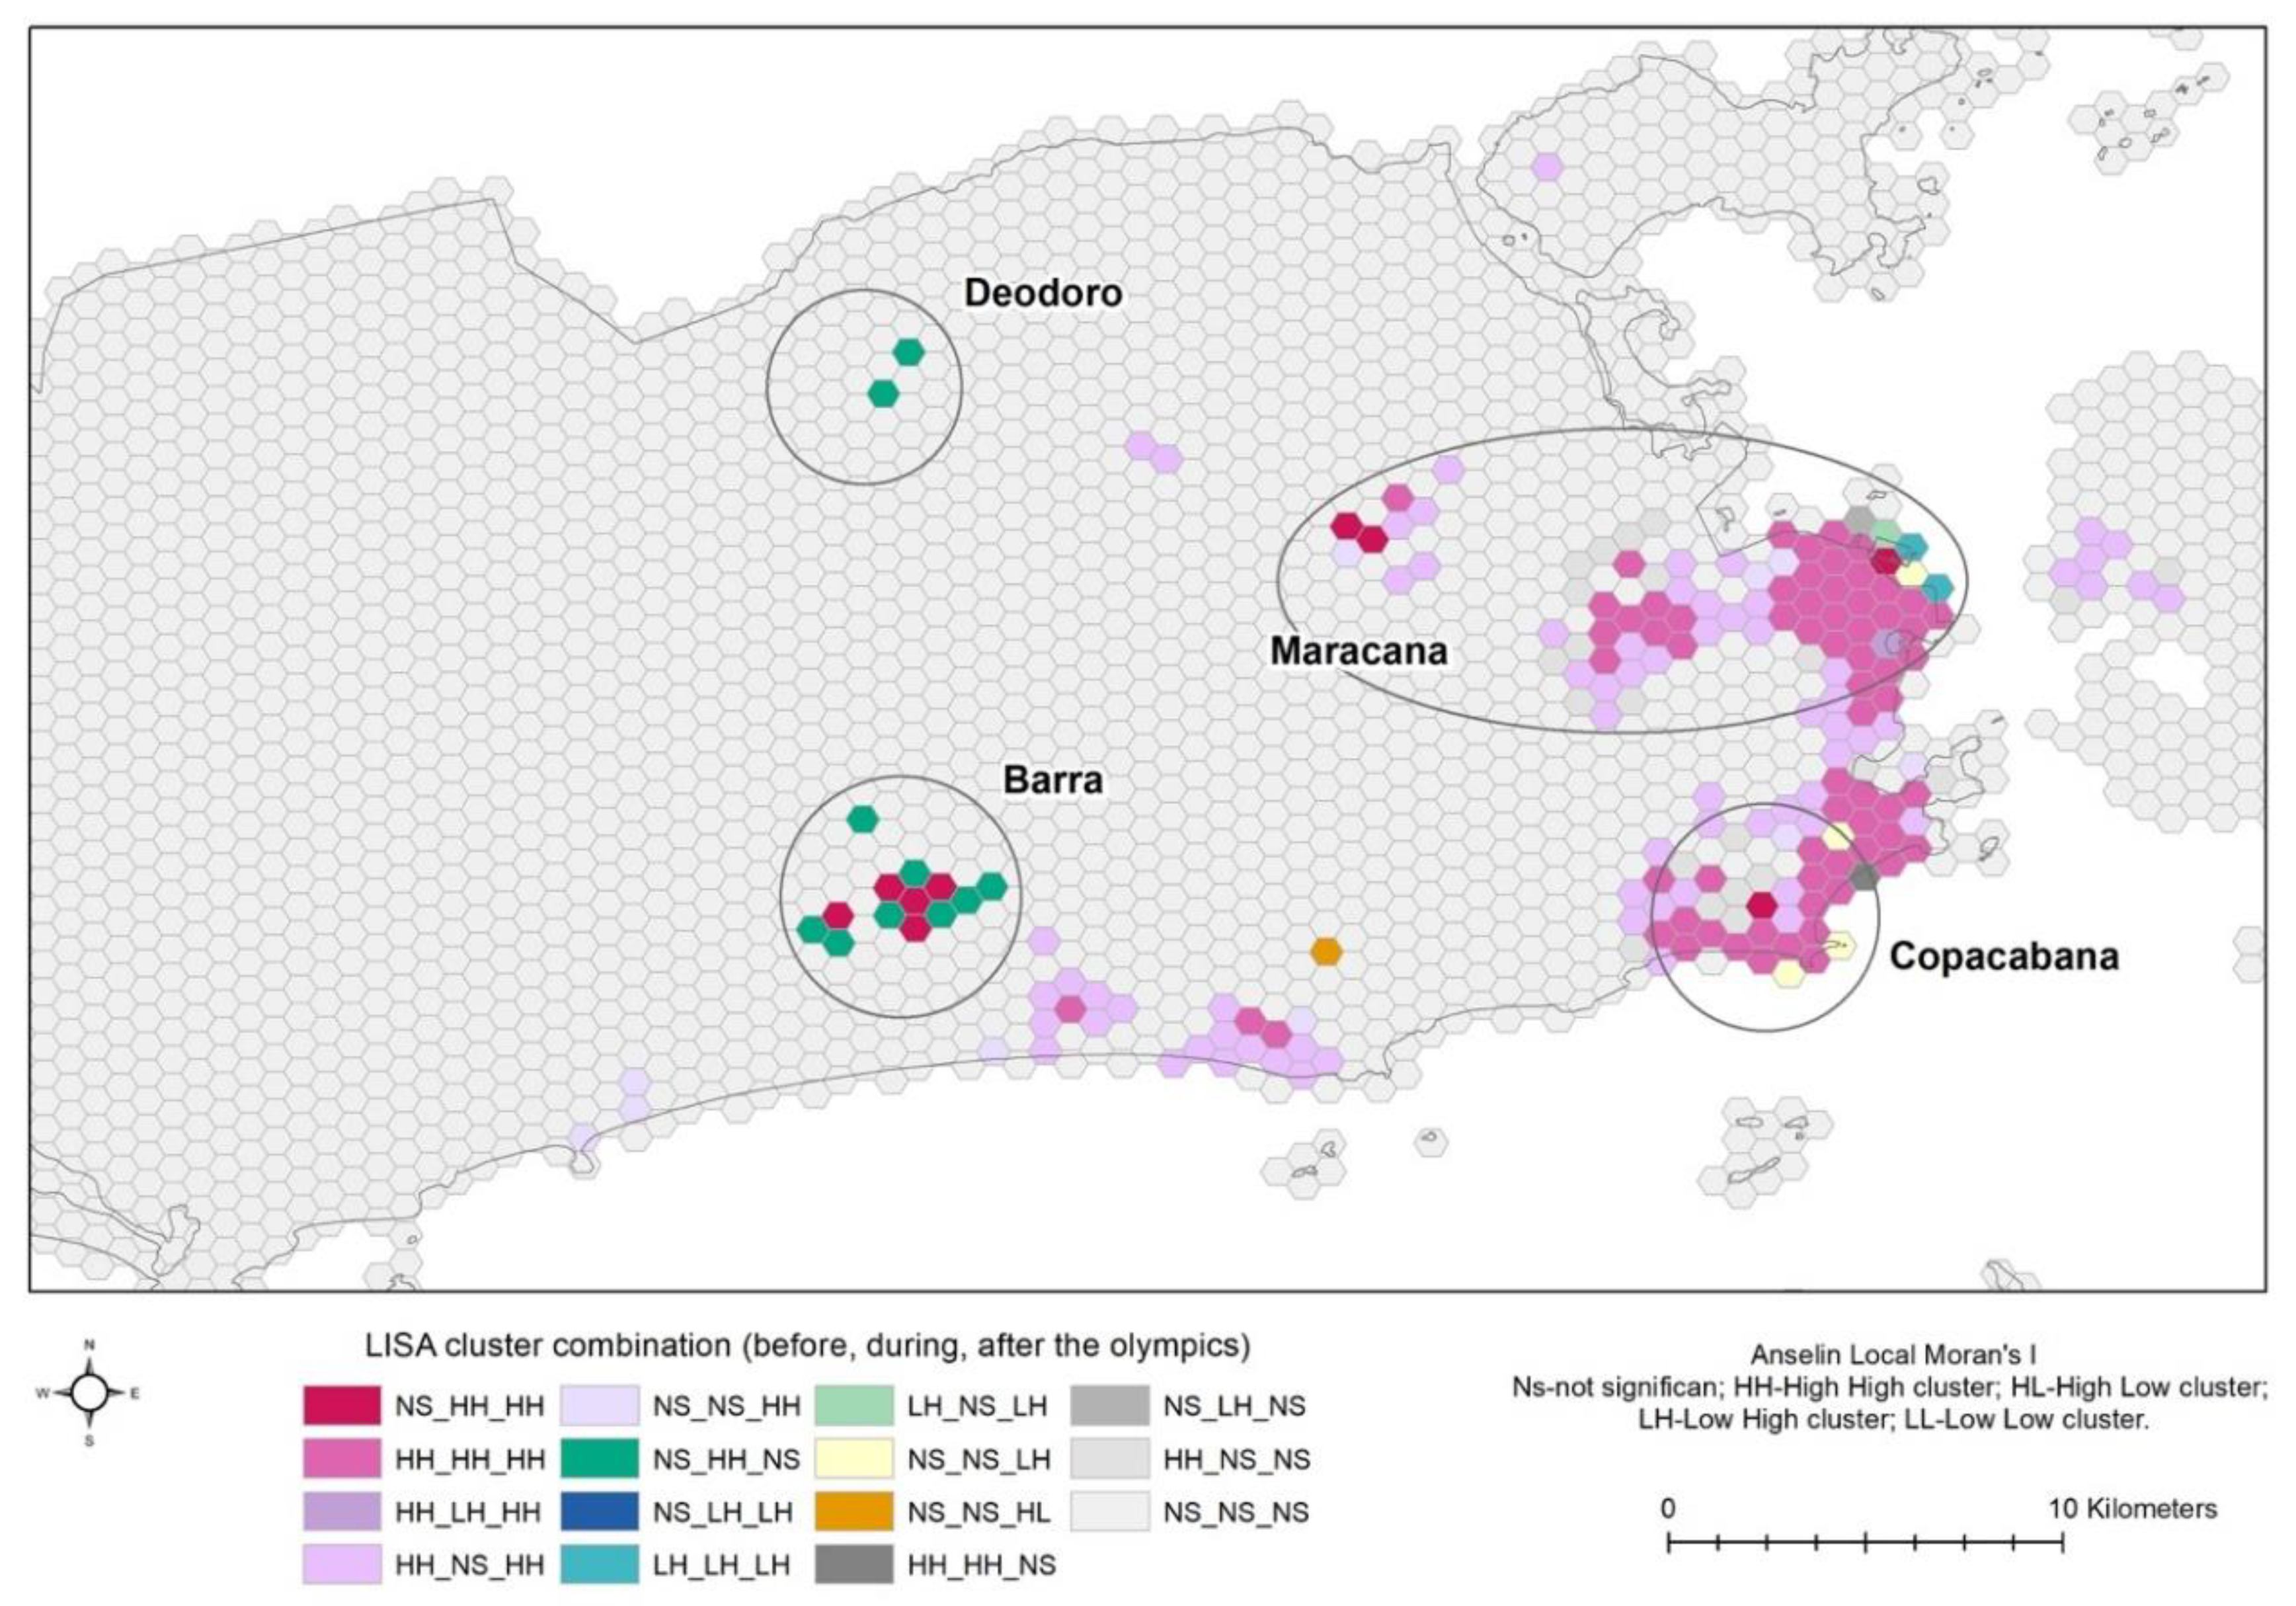
4.4. Changes on the Territorial Dynamic after the Olympic Games

By comparing the spatial distributions of Twitter users before, during, and after the Games, it is possible to analyze changes in the territorial dynamics of the city (Figure 6). Before the Olympic Games, the activity of users was concentrated in areas around the city center and Copacabana. During the Olympics, these areas remained active, but the greatest changes were found in the Barra and Deodoro areas, which showed an increase in the number of users. After the Olympics, users′ activity in the Deodoro area decreased to pre-Olympic levels, whereas high activity levels were retained in Barra.
Spatial autocorrelation was used to analyze the spatial concentration of Twitter users. LISA was calculated for the periods before, during, and after the Olympic Games. The index shows the spatial cluster distribution (significant at the 0.01 level), identifying those areas of high user concentration, surrounded by similar areas (High-High cluster or HH) (Figure 7). As expected, HH areas are mainly located in the most dynamic and touristic parts of the city, such as the city center, the Copacabana, and Barra. During the Olympic Games, HH clusters were more concentrated, and there were two new clusters: Barra and Deodoro. Part of the Barra Olympic area remained an HH cluster for Twitter users after the Olympic Games. Interestingly, the Deodoro area does not constitute a HH cluster after the Olympics, despite the leisure zones open to the public after the games. Notice that there was not any Low-Low cluster in the whole study area.
By combining the results of the LISA indicator for situations before, during, and after the Games, it is possible to identify three main types of areas (Figure 8):
  • Zones with a strong user presence before the Games that maintained this during the event and have continued to do so since (HH in the three situations: HH-HH-HH type). These are the most dynamic and touristic zones in the city center or around the beaches of Flamengo, Copacabana, and Ipanema.
  • Zones with less user presence before the Olympics, where sports events held during the Games made them into hot spots, and activity has subsequently been maintained (not significant-HH-HH type). These are areas that received investment and events during the Games that have generated new spaces of activity in the city. The most obvious example is a part of the Barra area.
  • Zones where there was no significant activity before the Games, where high activity levels took place during the Games, but which reverted to being unused afterward (not significant-HH-not significant type). These zones represent spaces that received investment, but this has not been able to attract enough people afterward. In the case of Rio, the neglect of many of the installations has led to substantial political repercussions in the city. The maps show situations of this type in the Deodoro area.

5. Discussion

Mega-events have a huge impact on host cities, and not surprisingly, there is an increasing interest in assessing both the way the city functions during the event and changes derived in the urban dynamic afterward. The Olympic Games are, without a doubt, the event that has one of the greatest repercussions on cities, owing to the enormous investment entailed in infrastructure.
To carry out this study, geolocalized data from the Twitter social network have been used as a source. Data were gathered between April 2016 and March 2017 in order to determine the spatial patterns of users before, during, and after the Games. Given its spatiotemporal disaggregation, it is possible to know the spaces where users carry out their activities throughout the day. An analysis of this type would be very costly, if not impossible, to do if traditional data sources were used.
The main contributions of this work to the existing literature of Twitter data applied to the Olympic Games are several. On the one hand, we assess the spatiotemporal dynamics of the Games, at an intraurban level and focus on the use of space made by residents and tourists. Other studies perform similar analyses with a broader scale (regional), focusing mainly on content and sentiment analysis [68,69].
The temporal analysis performed in this study accounts for Twitter users, instead of Twitter messages—which is an advance regarding other similar studies—correcting for users that post several messages at similar time and space. The data show a 70% increase in the number of Twitter users in the city during the third week of the event, which is a much higher amount than any other event held in Rio during the analyzed period. During the Olympic period, the number of tourist users detected was 30%. During the Games, a greater variety of users′ languages was observed and, unlike the periods outside the Games, in which Portuguese language users were predominant, English was the language most in evidence. Concerning the differences in the activity pattern of residents and tourists during the Games, it was found that in both cases, the most frequented places were the city center and the Olympic areas; the difference being that tourists were spatially less widely spread over other areas of the city. A similar outcome was obtained by Kovacs-Gyori et al. [74] when analyzing the London 2012 Olympic Games. Our main contribution in relation to this study is that we include an ampler period of analysis, in order to identify spatial patterns in the daily distribution of users and to analyze changes in the periods before, during the Games, and after them. We found that user activity increased significantly during the Games in the Olympic areas, with some differences where there was a greater mixture of land uses. Therefore, zones dominated by the presence of Olympic installations registered peaks of activity associated with sports events, while zones with a mix of residential use had a more regular activity pattern throughout the day. Finally, concerning the effect of the Games on users′ patterns of activity and the use of space, our analysis shows an increase in activity in some Olympic areas, as in the case of Barra, if we compare the situation before and after the Games. In other zones, like Deodoro, where there was a serious attempt at urban restructuring, with the demolition of parts of some favelas, the activity expected after the Games has not materialized at the end of the analyzed period.
Apart from the limitations of Twitter data already pointed out in Section 2.2, we are aware that our study only analyzes the short-term impacts of the Olympic Games. Long-term impacts would require data collected for a longer period, but we will leave this analysis for further study. Further analysis could extend this study, including sentiment analysis on Twitter messages in order to analyze the opinion of users about the urban restructuring that took place in certain areas. Nonetheless, we believe the outcomes of this paper provide very detailed information that cannot be extracted by other sources of data, such as traditional surveys and mobility statistics. Combining LBSN with more “traditional” surveys would unleash the full potential of mega-events impact analysis. However, such an extensive analysis goes beyond the scope of this study.

6. Conclusions

The methodology and outcomes presented here contribute useful information for urban planning. Firstly, it is possible to increase our understanding of urban dynamics during the holding of mega-events and to know not only the volume of the increase in visitors but also the use they make of the city during their stay—Even the use made by its residents during the event. This is of interest concerning the provision of public sector services (for example, risk assessment and evacuation plans for the population) and private sector business activities (potential demand according to areas and time of day). Moreover, an understanding of the impact of investments after the holding of the event makes it possible to predict and assess future patterns of activity for new urban developments.

Author Contributions

Conceptualization, J.C.G.-P., A.C.-M. and B.M.-G.; methodology, A.C.-M.; software A.C.-M. and B.M.-G.; validation, J.C.G.-P., A.C.-M., I.M. and B.M.-G.; formal analysis, J.C.G.-P. and A.C.-M.; investigation, J.C.G.-P., I.M. and A.C.-M.; resources, I.M. and A.C.-M.; data curation, A.C.-M. and B.M.-G.; writing—Original draft preparation, A.C.-M. and I.M.; writing—Review and editing, I.M. and A.C.-M.; visualization, A.C.-M.; supervision, A.C.-M.; funding acquisition J.C.G.-P. and B.M.-G. All authors have read and agreed to the published version of the manuscript.

Funding

This research was funded by the Spanish Ministry of Science and Innovation and the European Regional Development Fund (Project DynMobility, RTI2018-098402-B-I00).

Acknowledgments

Borja Moya-Gómez acknowledges to Juan de la Cierva–2018 Training Aids for Labour Contracts plan [Grant: FJC2018-036613-I] of the Spanish Ministry of Science and Innovation. Inmaculada Mohino acknowledges to Juan de la Cierva–2015 Training Aids for Labour Contracts plan [Grant: FJCI-2015-25826] of the Spanish Ministry of Science and Innovation.

Conflicts of Interest

The authors declare no conflict of interest.

References

  1. Müller, M. What makes an event a mega-event? Definitions and sizes. Leis. Stud. 2015, 34, 627–642. [Google Scholar] [CrossRef] [Green Version]
  2. Dansero, E.; Puttilli, M. Mega-events tourism legacies: The case of the Torino 2006 Winter Olympic Games—A territorialisation approach. Leis. Stud. 2010, 29, 321–341. [Google Scholar] [CrossRef]
  3. Preuss, H. Economics of the Olympic Games: Hosting the Games 1972–2000; Walla Walla Press–Centre for Olympic Studies, The University of South Wales: Sydney, Australia, 2000. [Google Scholar]
  4. Roche, M. Mega-Events and Modernity: Olympics and Expos in the Growth of Global Culture; Routledge: London, UK, 2000. [Google Scholar]
  5. Burbank, M.J.; Andranovich, G.; Heying, C.H. Olympic Dreams: The Impact of Mega-Events on Local Politics; Lynne Rienner: London, UK, 2001. [Google Scholar]
  6. Gratton, C.; Dobson, N.; Shibli, S. The economic importance of major sports events: A case-study of six events. Manag. Leis. 2000, 5, 17–28. [Google Scholar] [CrossRef]
  7. Kim, H.J.; Gursoy, D.; Lee, S.B. The impact of the 2002 World Cup on South Korea: Comparisons of pre- and post-games. Tour. Manag. 2006, 27, 86–96. [Google Scholar] [CrossRef]
  8. May, V. Environmental implications of the 1992 Winter Olympic Games. Tour. Manag. 1995, 16, 269–275. [Google Scholar] [CrossRef]
  9. Shoval, N. A new phase in the competition for the Olympic gold: The London and New York bids for the 2012 games. J. Urban Aff. 2002, 24, 583–599. [Google Scholar] [CrossRef]
  10. Humphreys, B.R.; Johnson, B.K.; Mason, D.S.; Whitehead, J.C. Estimating the Value of Medal Success at the 2010 Winter Olympic Games; Working Paper No. 2011–20; University of Alberta, Faculty of Art, Deparment of Economics: Edmonton, AL, Canada, 2011. [Google Scholar]
  11. Wicker, P.; Prinz, J.; Hanau, T. Estimating the value of national sporting success. Sport Manag. Rev. 2011, 15, 200–210. [Google Scholar] [CrossRef]
  12. Wang, M.; Bao, H.X.H.; Lin, P. Behavioural insights into housing relocation decisions: The effects of the Beijing Olympics. Habitat Int. 2015, 47, 20–28. [Google Scholar] [CrossRef] [Green Version]
  13. Hiller, H.H.; Address, C. Post-event outcomes and the post-modern turn: The Olympics and Urban Transformations. Eur. Sport Manag. Q. 2006, 6, 317–332. [Google Scholar] [CrossRef]
  14. Holguin-Veras, J.; Xu, N.; Levinson, H.S.; Paaswell, R.E.; Mcknight, C.E.; Weiner, R.D.; Ozbay, K.; Ozmen-Ertekin, D. An investigation on the Aggregate Behavior of Firm Relocation to New Jersey (1990–1999) and the Underlying Market Elasticities. Netw. Spat. Econ. 2005, 5, 293–331. [Google Scholar] [CrossRef]
  15. Essex, S.; Chalkley, B. Urban Transformation from Hosting the Olympic Games; CEO-UAB: Barcelona, Spain, 2010. [Google Scholar]
  16. Balsas, C.J.L. Country Marketing and Planning Implications of the European Soccer Championship EURO 2004. J. Urban Technol. 2018, 25, 29–46. [Google Scholar] [CrossRef]
  17. Chen, N. Branding national images: The 2008 Beijing Summer Olympics, 2010 Shanghai World Expo, and 2010 Guangzhou Asian Games. Public Relat. Rev. 2012, 38, 731–745. [Google Scholar] [CrossRef]
  18. Law, C.M. Urban Tourism, Attracting Visitors to Large Cities; Mansell: London, UK, 1993. [Google Scholar]
  19. Bramwell, B. Strategic planning before and after a mega-event. Tour. Manag. 1997, 18, 167–176. [Google Scholar] [CrossRef]
  20. Gaffney, C.; Robertson, C. Smarter than Smart: Rio de Janeiro’s Flawed Emergence as a Smart City. J. Urban Technol. 2018, 25, 47–64. [Google Scholar] [CrossRef]
  21. Kassens-Noor, E.; Fukushige, T. Olympic Technologies. J. Urban Technol. 2018, 25, 83–104. [Google Scholar] [CrossRef]
  22. Getz, D. Event tourism: Definition, evolution and research. Tour. Manag. 2008, 29, 403–428. [Google Scholar] [CrossRef]
  23. Singh, N.; Hu, C. Understanding strategic alignment for destination marketing and the 2004 Athens Olympic Games: Implications from extracted tacit knowledge. Tour. Manag. 2008, 29, 929–939. [Google Scholar] [CrossRef]
  24. Fourie, J. Santana-Gallego, M. The impact of mega-sports events on tourist arrivals. Tour. Manag. 2011, 32, 1364–1370. [Google Scholar] [CrossRef] [Green Version]
  25. Ritchie, J.R.B. Assessing the impact of hallmark events: Conceptual and research issues. J. Travel Res. 1984, 22, 2–11. [Google Scholar] [CrossRef]
  26. Ritchie, J.R.B.; Aitken, C.E. Assessing the impacts of the 1988 Olympic Winter Games: The research program and initial results. J. Travel Res. 1984, 22, 17–25. [Google Scholar] [CrossRef]
  27. Mihalik, B.J. Host population perception of the 1996 Atlanta Olympics: Support, benefits and liabilities. Tour. Anal. 2000, 5, 49–53. [Google Scholar]
  28. Deccio, C.; Baloglu, S. Nonhost community resident reactions to the 2002 Winter Olympics: The spillover impacts. J. Travel Res. 2002, 41, 46–56. [Google Scholar] [CrossRef]
  29. Zhou, Y.; Ap, J. Resident perceptions towards the impacts of the Beijing 2008 Olympic Games. J. Travel Res. 2009, 48, 78–91. [Google Scholar] [CrossRef]
  30. Kenyon, A.; Bodet, G. Exploring the domestic relationship between mega-events and destination image: The image impact of hosting the 2012 Olympic Games for the city of London. Sport Manag. Rev. 2017, 21, 232–249. [Google Scholar] [CrossRef] [Green Version]
  31. Xu, Y.; González, M.C. Collective benefits in traffic during mega events via the use of information technologies. J. R. Soc. Interface 2017, 14, 20161041. [Google Scholar] [CrossRef] [Green Version]
  32. Maiello, A.; Pasquinelli, C. Destruction or construction? A (counter) branding analysis of sport mega-events in Rio de Janeiro. Cities 2015, 48, 116–124. [Google Scholar] [CrossRef]
  33. Nilbe, K.; Ahas, R.; Silm, S. Evaluating the Travel Distances of Events Visitors and Regular Visitors Using Mobile Positioning Data: The Case of Estonia. J. Urban Technol. 2014, 21, 91–107. [Google Scholar] [CrossRef]
  34. Mihalik, B.; Simoneita, L. Resident perceptions of the 1996 Summer Olympic Games: Year II. Festiv. Manag. Event Tour. 1998, 5, 9–19. [Google Scholar] [CrossRef]
  35. Costa, G. Social impacts, pros and cons of hosting mega sporting events, focusing on a global south city: Rio de Janeiro. Territorio 2013, 64, 19–26. [Google Scholar]
  36. de Almeida, B.S.; Bolsmann, C.; Marchi-Júnior, W.; de Souza, J. Rationales, rhetoric and realities: FIFA’s World Cup in South Africa 2010 and Brazil 2014. Int. Rev. Sociol. Sport 2013, 50, 265–282. [Google Scholar] [CrossRef] [Green Version]
  37. Zhang, L.; Zhao, S.X. City branding and the Olympic effect: A case study of Beijing. Cities 2009, 26, 245–254. [Google Scholar] [CrossRef]
  38. Smith, A.; Stevenson, N. A review of tourism policy for the 2012 Olympics. Cult. Trends 2009, 18, 97–102. [Google Scholar] [CrossRef]
  39. Guala, C. Rebuilding Turin’s image. In Identity and social capital looking forward to 2006 Winter Olympics Games. In Proceedings of the 39th International Planning Congress, Planning in a More Globalised and Competitive World, Cairo, Egypt, 22 October 2003. [Google Scholar]
  40. Spilling, O.R. Mega-event as strategy for regional development: The case of the 1994 Lillehammer Winter Olympics. Entrep. Reg. Dev. 1996, 8, 321–343. [Google Scholar] [CrossRef]
  41. Calabrese, F.; Diao, M.; Lorenzo, G.D.; Ferreira, J., Jr.; Ratti, C. Understanding Individual Mobility Patterns from Urban Sensing Data: A Mobile Phone Trace Example. Transp. Res. Part C Emerg. Technol. 2013, 26, 301–313. [Google Scholar] [CrossRef]
  42. Chen, C.; Bian, L.; Ma, J. From traces to trajectories: How well can we guess activity locations from mobile phone traces? Transp. Res. Part C Emerg. Technolies 2014, 46, 326–337. [Google Scholar] [CrossRef]
  43. Krings, G.; Calabrese, F.; Ratti, C.; Blondel, V.D. Urban Gravity: A Model for Inter-City Telecommunication Flows. J. Stat. Mech. Theory Exp. 2009, 7. [Google Scholar] [CrossRef] [Green Version]
  44. Simini, F.; González, M.; Maritan, A.; Barabási, A.L. A universal model for mobility and migration patterns. Nature 2012, 484, 96–100. [Google Scholar]
  45. Wang, F.; Chen, C. On data processing required to derive mobility patterns from passively-generated mobile phone data. Transp. Res. Part CEmerg. Technol. 2018, 87, 58–74. [Google Scholar] [CrossRef]
  46. Hawelka, B.; Sitko, I.; Beinat, E.; Sobolevsky, S.; Kazakopoulos, P.; Ratti, C. Geo-located Twitter as proxy for global mobility patterns. Catogr. Geogr. Inf. Sci. 2014, 41, 260–271. [Google Scholar] [CrossRef] [Green Version]
  47. Lansley, G.; Longley, P.A. The geography of Twitter topics in London. Comput. Environ. Urban Syst. 2016, 58, 85–96. [Google Scholar] [CrossRef] [Green Version]
  48. Andrienko, G.; Andrienko, N.; Bosch, H.; Ertl, T.; Fuchs, G.; Jankowski, P.; Thom, D. Thematic patterns in georeferenced tweets through space-time visual analytics. Comput. Sci. Eng. 2013, 15, 72–82. [Google Scholar] [CrossRef]
  49. Jiang, B.; Ma, D.; Yin, J.; Sandberg, M. Spatial distribution of city tweets and their densities. Geogr. Anal. 2016, 48, 337–351. [Google Scholar] [CrossRef] [Green Version]
  50. Lin, J.; Cromley, R.G. Evaluating geolocated Twitter data as a control layer for areal interpolation of population. Appl. Geogr. 2015, 58, 41–47. [Google Scholar] [CrossRef]
  51. Lamanna, F.; Lenormand, M.; Salas-Olmedo, M.H.; Romanillos, G.; Gonçalves, B.; Ramasco, J.J. Immigrant community integration in world cities. PLoS ONE 2018, 13, e0191612. [Google Scholar] [CrossRef] [PubMed]
  52. Netto, V.M.; Pinheiro, M.; Meirelles, J.V.; Leite, H. Digital footprints in the cityscape. In Proceedings of the International Conference on Social Networks, Athens, GA, USA, 13–14 March 2015. [Google Scholar]
  53. Shelton, T.; Poorthuis, A.; Zook, M. Social media and the city: Rethinking urban socio-spatial inequality using user-generated geographic information. Landsc. Urban Plan. 2015, 142, 198–211. [Google Scholar] [CrossRef]
  54. Frias-Martinez, V.; Soto, V.; Hohwald, H.; Frias-Martinez, E. Characterizing urban landscapes using geolocated tweets. Privacy, security, risk and trust (PASSAT). In Proceedings of the 2012 International Conference on Social Computing (SocialCom), Washington, DC, USA, 3–5 September 2012; IEEE: New York, NY, USA; pp. 239–248.
  55. Frias-Martinez, V. Spectral clustering for sensing urban land use using Twitter activity. Eng. Appl. Artif. Intell. 2014, 35, 237–245. [Google Scholar] [CrossRef] [Green Version]
  56. Lee, R.; Sumiya, K. Measuring geographical regularities of crowd behaviors for Twitter-based geo-social event detection. In LBSN ’10, Proceedings of the 2nd ACM SIGSPATIAL International Workshop on Location Based Social Networks, San Jose, California, CA, USA, 2–5 November 2010; Association for Computing Machinery Press: New York, NY, USA, 2020. [Google Scholar]
  57. Liu, Y.; Liu, X.; Gao, S.; Gong, L.; Kang, C.; Zhi, Y.; Chi, G.; Shi, L. Social sensing: A new approach to understanding our socioeconomic environments. Ann. Assoc. Am. Geogr. 2015, 105, 512–530. [Google Scholar] [CrossRef]
  58. Longley, P.A.; Adnan, M.; Lansley, G. The geotemporal demographics of Twitter usage. Environ. Plan. A 2015, 47, 465–484. [Google Scholar] [CrossRef]
  59. González, M.C.; Hidalgo, C.A.; Barabási, A.L. Understanding Individual Human Mobility Patterns. Nature 2008, 453, 779–782. [Google Scholar] [CrossRef]
  60. Noulas, A.; Scellato, S.; Lambiotte, R.; Pontil, M.; Mascolo, C. A Tale of Many Cities: Universal Patterns in Human Urban Mobility. PLoS ONE 2012, 7, e37027. [Google Scholar] [CrossRef]
  61. Lenormand, M.; Picornell, M.; Cantú-Ros, O.; Tugores, A.; Louail, T.; Herranz, R.; Ramasco, J.J. Cross-checking different sources of mobility information. PLoS ONE 2014, 9, e105184. [Google Scholar] [CrossRef] [PubMed]
  62. Salas-Olmedo, M.H.; García-Palomares, J.C.; Gutiérrez, J. Tourists’ digital footprint in cities: Comparing big data sources. Tour. Manag. 2018, 66, 13–25. [Google Scholar] [CrossRef] [Green Version]
  63. Luo, F.; Cao, G.; Mulligan, K.; Li, X. Explore spatiotemporal and demographic characteristics of human mobility via Twitter: A case study of Chicago. Appl. Geogr. 2016, 70, 11–25. [Google Scholar] [CrossRef] [Green Version]
  64. Bassolas, A.; Lenormand, M.; Tugores, A.; Gonçalves, B.; Ramasco, J.J. Touristic site attractiveness seen through Twitter. EPJ Data Sci. 2016, 5, 12. [Google Scholar] [CrossRef] [Green Version]
  65. Chua, A.; Servillo, L.; Marcheggiani, E.; Vande Moere, A. Mapping Cilento: Using geotagged social media data to characterize tourist flows in southern Italy. Tour. Manag. 2016, 57, 295–310. [Google Scholar] [CrossRef]
  66. Comito, C.; Falcone, D.; Talia, D. Mining human mobility patterns from social geotagged data. Pervasive Mob. Comput. 2016, 33, 91–107. [Google Scholar] [CrossRef]
  67. Fuchs, G.; Andrienko, G.; Andrienko, N.; Jankowski, P. Extracting Personal Behavioral Patterns from Geo-Referenced Tweets. In Proceedings of the 16th AGILE Conference on Geographic Information Science, Leuven, Belgium, 14–17 May 2013. [Google Scholar]
  68. Kirilenko, A.P.; Stepchenkova, S.O. Sochi 2014 Olympics on Twitter: Perspectives of hosts and guests. Tour. Manag. 2017, 63, 54–65. [Google Scholar] [CrossRef]
  69. Kirilenko, A.P.; Stepchenkova, S.O. Sochi Olympics on Twitter: Topics, Geographical Landscape, and Temporal Dynamics; Xiang, Z., Fesenmaier, D., Eds.; Analytics in Smart Tourism Design, Tourism on the Verge; Springer: Cham, Switzerland, 2017. [Google Scholar] [CrossRef]
  70. Manca, M.; Boratto, L.; Morell-Roman, V.; Martori-Gallissà, O.I.; Kaltenbrunner, A. Using social media to characterize urban mobility patterns: State-of-the-art survey and case study. Online Soc. Netw. Media 2017, 1, 56–69. [Google Scholar] [CrossRef]
  71. Sakaki, T.; Okazaki, M.; Matsuo, Y. Earthquake shakes Twitter users. In WWW ’10, Proceedings of the 19th International Conference on World Wide Web,, Raleigh, North Carolina, USA, 26–30 April 2010; ACM Press: New York, NY, USA, 2010; p. 851. [Google Scholar]
  72. Pak, A.; Paroubek, P. Twitter as a Corpus for Sentiment Analysis and Opinion Mining. In Proceedings of the LREC, Valletta, European Language Resources Association (ELRA), Valletta, Malta, 17–23 May 2010; pp. 436–439. [Google Scholar]
  73. Thelwall, M.; Buckley, K.; Paltoglou, G. Sentiment in Twitter events. J. Am. Soc Inf. Sci. Technol. 2011, 62, 406–418. [Google Scholar] [CrossRef] [Green Version]
  74. Kovacs-Gyori, A.; Ristea, A.; Havas, C.; Resch, B.; Cabrera-Barona, P. #London2012: Towards Citizen-Contributed Urban Planning Through Sentiment Analysis of Twitter Data. Urban Plan. 2018, 3, 75–99. [Google Scholar]
  75. Jiao, J.; Holmes, M.; Griffin, G.P. Revisiting Image of the City in Cyberspace: Analysis of Spatial Twitter Messages During a Special Event. J. Urban Technol. 2018, 25, 65–82. [Google Scholar] [CrossRef]
  76. Abdelhap, H.; Sengstock, C.; Gertz, M. EvenTweet: Online localized event detection from Twitter. Proc. VLDB Endow. 2013, 6, 1326–1329. [Google Scholar] [CrossRef]
  77. He, Q.; Chang, K.; Lim, E.-P. Analyzing feature trajectories for event detection. In SIGIR; Kraaij, W., de Vries, A.P., Clarke, C.L.A., Fuhr, N., Kando, N., Eds.; ACM: New York, NY, USA, 2007; pp. 207–214. [Google Scholar]
  78. Petrovic, S.; Osborne, M.; Lavrenko, V. Streaming first story detection with application to twitter. In Proceedings of the 2010 Annual Conference of the North American Chapter of the Association for Computational Linguistics (HLT ‘10), Los Angeles, CA, USA, 2–4 June 2010; pp. 181–189. [Google Scholar]
  79. Ritter, A.; Mausam-Clark, S.; Etzioni, O. Open domain event extraction from Twitter. In Proceedings of the 18th ACM SIGKDD International Conference on Knowledge Discovery and Data Mining, Beijing, China, 12–16 August 2012.
  80. Weng, J.; Lee, B.-S. Event detection in twitter. In Proceedings of the Fifth International Conference on Weblogs and Social Media, Barcelona, Catalonia, Spain, 17–21 July 2011. [Google Scholar]
  81. Becker, H.; Naaman, M.; Gravano, L. Beyond trending topics: Realworld event identification on twitter. In Proceedings of the Fifth International Conference on Weblogs and Social Media, Barcelona, Catalonia, Spain, 17–21 July 2011. [Google Scholar]
  82. McCreadie, R.; Macdonald, C.; Ounis, I.; Osborne, M.; Petrovic, S. Scalable distributed event detection for twitter. In Proceedings of the 2013 IEEE International Conference on Big Data, Santa Clara, CA, USA, 6–9 October 2013; pp. 543–549. [Google Scholar] [CrossRef] [Green Version]
  83. Li, H.; Ji, H.; Zhao, L. Social Event Extraction: Task, Challenges and Techniques. In Proceedings of the 2015 IEEE/ACM International Conference on Advances in Social Networks Analysis and Mining, Paris, France, 25–28 August 2015. [Google Scholar]
  84. Zhou, X.; Xu, C. Tracing the spatial-temporal evolution of events based on social media data. Int. J. Geo-Inf. 2017, 6, 88. [Google Scholar] [CrossRef]
  85. Blanford, J.I.; Huang, Z.; Savelyev, A.; MacEachren, A.M. Geolocated tweets, enhancing mobility maps and capturing cross-border movement. PLoS ONE 2015, 10, e0129202. [Google Scholar] [CrossRef] [Green Version]
  86. Sloan, L.; Morgan, J.; Burnap, P.; Williams, M. Who Tweets? Deriving the Demographic Characteristics of Age, Occupation and Social Class from Twitter User Meta-Data. PLoS ONE 2015, 10, e0115545. [Google Scholar] [CrossRef] [Green Version]
  87. Brasileiro, C.O. Dossiê de Candidatura do Rio de Janeiro a sede dos Jogos Olímpicos de 2016; Ministério do Esporte, Governo Federal: Rio de Janeiro, Brazil, 2009; Volume 1–3. [Google Scholar]
  88. Pereira, R.H.M. Future accessibility impacts of transport policy scenarios: Equity and sensitivity to travel time thresholds for Bus Rapid Transit expansion in Rio de Janeiro. J. Transp. Geogr. 2019, 74, 321–332. [Google Scholar] [CrossRef] [Green Version]
  89. Pereira, R.H.M.; Banister, D.; Schwanen, T.; Wessel, N. Distributional effects of transport policies on inequalities in access to opportunities in Rio de Janeiro. J. Transp. Land Use 2019, 12, 741–764. [Google Scholar] [CrossRef] [Green Version]
  90. Chu, Z.; Gianvecchio, S.; Wang, H.; Jajodia, S. Detecting automation of Twitter accounts: Are you a human, bot, or cyborg? IEEE Trans. Dependable Secur. Comput. 2012, 9, 811–824. [Google Scholar] [CrossRef]
  91. Openshaw, S. The Modifiable Areal Unit Problem; Geo Books: Norwich, UK, 1984. [Google Scholar]
  92. Anselin, L. Local Indicators of Spatial Association—LISA. Geogr. Anal. 1995, 27, 93–115. [Google Scholar] [CrossRef]
  93. Tobler, W. A computer movie simulating urban growth in the Detroit region. Econ. Geogr. 1970, 46, 234–240. [Google Scholar] [CrossRef]
  94. García-Palomares, J.C.; Salas-Olmedo, M.H.; Moya-Gómez, B.; Condeço-Melhorado, A.; Gutiérrez, J. City dynamics through Twitter: Relationships between land use and spatiotemporal demographics. Cities 2018, 72, 310–319. [Google Scholar] [CrossRef]
Figure 1. Main Olympic areas in Rio de Janeiro; circles represent the Olympic areas.
Sustainability 12 07003 g001
Figure 2. Distribution of the number of Twitter users by weeks in the analyzed period (before the Games: yellow; during the Games: green; after the Games: blue).
Sustainability 12 07003 g002
Figure 3. Languages of tourists (Twitter users) weekly, from 24 July 2016 to 27 August 2016 (pt: Portuguese; en: English; es: Spanish; id: Indonesian; ru: Russian; it: Italian; fr: French; nl: Dutch; ja: Japanese; de: German; sv: Swedish; tr: Turkish).
Sustainability 12 07003 g003
Figure 4. Daily distribution (hours) of Twitter users in different Olympic areas.
Sustainability 12 07003 g004
Figure 5. Distribution of Twitter users by residents and tourists during the Olympic Games, and LISA results.
Sustainability 12 07003 g005
Figure 6. Daily pattern of Twitter users, comparing before, during and after the Olympic Games.
Sustainability 12 07003 g006
Figure 7. Results of the LISA analysis before, during and after the Olympic Games.
Sustainability 12 07003 g007
Figure 8. LISA cluster combination (before, during, and after the Olympics).
Sustainability 12 07003 g008
Table 1. Number of Twitter users during the weeks 1 of the Olympic Games.
WeekTouristsResidentsTotal
24 July 2016–30 July 20161690 (11.2%)13,42915,119
31 July 2016–6 August 20164103 (21.3%)15,15519,258
7 August 2016–13 August 20165316 (24.2%)16,62421,940
14 August 2016–20 August 20166121 (24.3%)19,08725,208
21 August 2016–27 August 20163124 (17.1%)15,13218,256
Total OG period15,235 (29.5%)36,37351,608
1 These weeks correspond to the Olympic Games period, including one week before and after the Games, as explained in Section 3.2.3.

