Article

Sustainable Development and Technological Impact on CO2 Reducing Conditions in Romania

by
Lucian-Ionel Cioca
1,
Larisa Ivascu
2,*,
Elena Cristina Rada
3,4,
Vincenzo Torretta
5 and
Gabriela Ionescu
6
1
Department of Industrial Engineering and Management, Faculty of Engineering, “Lucian Blaga” University of Sibiu, Bd. Victoriei No.10, 550024 Sibiu, Romania
2
Department of Management, Faculty of Management in Production and Transportation, Politehnica University of Timisoara, Piata Victoria No.2, 300006 Timisoara, Romania
3
Department of Biotechnologies and Life Sciences, Insubria University of Varese, via G.B. Vico 46, I-21100 Varese, Italy
4
Department of Civil Environmental and Mechanical Engineering, Italy & University of Trento, via Mesiano 77, 38123 Trento, Italy
5
Department of Biotechnologies and Life Sciences, Insubria University of Varese, via G.B. Vico 46, I-21100 Varese, Italy
6
Department of Energy Production and Use, Politehnica University of Bucharest, Splaiul Independentei 313, Sector 6, 060042 Bucharest, Romania
*
Author to whom correspondence should be addressed.
Sustainability 2015, 7(2), 1637-1650; https://0-doi-org.brum.beds.ac.uk/10.3390/su7021637
Submission received: 3 January 2015 / Accepted: 22 January 2015 / Published: 3 February 2015
(This article belongs to the Special Issue Sustainability of Resources)

Abstract

:
Climate change is a reality all over the world, and its complexity is increasing. Therefore, sustainability has become a national and international concern, ingrained in many organizational processes. The ability of organizations to respond to sustainability concerns is sometimes hindered by the complexity of integrating sustainability into business models and by the need to rethink their strategic directions. In Romania, sustainable development has become a priority for businesses, but even though companies are showing some concern, there are yet to demonstrate any full commitment (they are mainly concerned with areas such as society and the environment). This paper assesses Romania’s involvement in the adoption of actions directed toward the reduction of pollutants and greenhouse gases, namely actions focused on reducing the main causes of pollution. This analysis compares the situation in Romania with that of the European Union. The main concerns can be categorized according to four sectors, which produce the highest quantity of carbon dioxide emissions in the world: the energy sector, the transport sector, the waste sector and the industry sector. The last section of this paper deals with the carbon footprint of Romania and its implications.

1. Introduction

Sustainable development is a major concern as countries attempt to implement strategies to reduce greenhouse gas emissions. This involves reducing environmental pollution and the use of resources, eventually contributing to the welfare of society, i.e., to the improvement of the social conditions of the population. Sustainable development relies on the contribution each country worldwide. This encourages creative thinking in putting forward strategies and in the planning and development of cities and communities. The idea of sustainable development materialized at the Rio summit. Agenda 21 was established in Rio in 1992, which integrates the principles and imperatives worldwide for sustainable development [1]. As shown by Häikiö [2], sustainable development implies the idea of a situation/world which is better than the current one, the direction towards a society based on reuse and reduction.
Because there is a need to develop a benchmark for assessing sustainable development, the European Commission substantiates the requirements of this concept. In 2000, the European Commission launched the tool of “triple base line” based on the requirements of sustainable development. It integrates three major subordinates:
  • Social: organizational impact on employees, community, customers, suppliers, stakeholders, the public, media;
  • Economic: financial performance development based on the principles and laws in business;
  • Environment: it refers to the organization’s impact on the environment through the processes and activities that they perform [3].
In the context of real energy challenges, both in terms of sustainable use of resources and emissions of CO2 and the security of energy supply, Romania has achieved a balance in this regard. Climate change affects all of Europe, with a wide range of effects on society and the environment. Other impacts are expected in the future that may lead to significant damage, according to the most recent estimates published by the European Environment Agency. “Climate changes are a reality throughout the world, and their scale and rapidity are becoming more evident. This means that each component of the economy, including households, must adapt and reduce emissions—Jacqueline McGlade (Executive Director of the European Environment Agency) [4]”.
Extreme weather phenomena in most regions, such as climate change, heat waves, flooding and droughts have triggered, in recent years, increased environmental damage throughout Europe. Although more evidence is required to discern the role of anthropic activities in climate change, increasing human activity in areas prone to hazards has been a key factor. It is expected that future climate change will increase this vulnerability because extreme weather events may become more intense and frequent. Romania’s National Strategy on Climate Change 2013–2020 (SNSC) aims at reducing emissions of greenhouse gases and adapting to the inevitable negative effects of climate change on natural and anthropic systems. Greenhouse gas emissions are those stipulated in the Kyoto Protocol of the six gases responsible for the greenhouse effect. This indicator measures the greenhouse gas emissions: carbon dioxide (CO2), nitrous oxide (N2O), methane (CH4) and three halocarbons (hydrofluorocarbons-HFCs, perfluorocarbons-PFCs, sulphur hexafluoride-SF6) measured by the global warming potential [5]. Of all the items on the list, CO2 is considered to be the most significant contributor to climate change. Each of the six gases listed above has its own global warming potential based on its radioactive capacity compared to CO2. Second and third, in terms of importance, are CH4 and N2O with a considerable contribution to global warming and environmental change.
Figure 1a shows the total emissions of greenhouse gases in Romania, including land use, land-use change and forestry (LULUCF), CO2 equivalent, and the total emission of greenhouse gases, but excluding LULUCF CO2 equivalent [5] between 2000 and 2011. The analysis of these values shows that the total GHG emission level has had a downward evolution since 2006 in Romania, which has been an improvement. Figure 1b shows the situation of Romania’s GHG emission by sector of activity. The energy sector is thus developing the largest quantity of GHG per year, with a slight decrease since 2006. In Romania, the data related to the years 2000–2011 are presented by the National Institute of Statistics (NIS). For the years 2012–2014, NIS does not present the data on GHG emissions.
Figure 1. (a) Total greenhouse gas (GHG) emission including Land use, Land Use Change and Forestry (LULUCF) and exclusive LULUCF in Romania; (b) GHG emission by sector of activity in Romania (in thousand tons) [6].
Sustainability 07 01637 g001
This study is based on the systematization of information on the directives of the European Commission concerning the reduction in the use of natural resources, the processing of sets of relevant statistical indicators, and the analysis and identification of solutions suitable to mitigate the impact of these carbon dioxide emissions through use of renewable resources. Figure 1b shows that GHG started to decline in 2009 because all organizations in all activity sectors began using renewable resources and began to take on board the concept of sustainable development. The emission level decreased as a result of economic instability which had impacted transport, various branches of production and other related activities. Romania was also affected by economic instability [6]. Since 2011, Romania has experienced economic growth, with an increase in labour productivity/employment (a growth rate of 7.1% in 2006, 5.9% in 2007, 5.3% in 2008, and decreased rate of 4.7% in 2009, 0.9% in 2010 and a growth rate of 2.9% in 2011). The Romanian Government supports the use of renewable sources through several legal norms: the green certificates system (the producer receives from the national energy organization a number of free green certificates for the energy it produces and delivers to the network) and the subsidies granted to the producers and users of renewable sources. This sustainable behaviour in Romania is aligned with EU requirements on the use of renewable resources.

2. CO2 Emissions in Romania and the EU Today

Scientific studies [7,8] show that the greatest amount of CO2 emissions, in the European Union, results from the production of electricity and heat (for example, the production of coal-based energy in the EU Member States generated approximately 950 million tons of CO2 emissions in 2005, equivalent to 24% of total CO2 emissions in the EU). Cities and urban agglomerations in each country have an essential role to play in mitigating climate change, given the fact that they consume three-quarters of the energy produced in the EU and are responsible for a similar percentage of CO2 emissions.
Under the Kyoto Protocol, Romania was obligated to reduce emissions of greenhouse gases by 8% between 2008 and 2012 as compared with 1989. Romania’s objective is to double its energy production to about 100 TWh before 2020 [5]. Moreover, there also exists the International Municipalities Convention signed by 6160 cities [9]. This Convention is one of the most important European actions involving regional and local authorities that commit themselves voluntarily to increase energy efficiency and the use of renewable energy sources in their territories. Through their commitment, signatories of the Convention aim at achieving and surpassing the EU objective of reducing CO2 emissions by 20% before 2020, in every city which adhered to the Convention. In Romania, 83 towns/cities from a total of 320 cities have acceded to this Convention. Across Europe there are 6149 signatories and 11 signatories in Asia. Romania is constantly trying to reduce environmental pollution by reducing greenhouse gas emissions. The political commitment assumed by signing the Covenant of Mayors is transposed into the development of directions and strategies for attaining the 20% reduction in CO2 emissions, and the use of renewable energy sources.
By analysing the amount of CO2 in the European Union, it was found that the transportation sector is the second heaviest polluter, after the electrical and thermal energy sector. The graphical representation is showed in Figure 2a for the situation in the European Union and in Figure 2b for the situation in Romania. As shown in Figure 2, Romania’s situation has improved by 1.2%, as progress has been made in reducing emissions from the transportation sector. This improvement was the effect of introducing an expensive tax for cars non-compliant with the Euro4 emission standard (the Euro4 emission standard specifies a maximum limit of 25 mg/kg particulate matters (PM) and 250 mg/kg of nitrogen oxides (NOx)). Thus, the population shifted their preference towards vehicles compliant with the Euro5 and Euro6 standards. The rules related to the pollution standard are set by the regulation of the European Parliament and Council on the approval of road vehicles. The Euro5 emission standard requires reducing emissions by 80% compared to the Euro4 emission standard, allowing 5 mg/km of PM and 160–180 mg/km of NOx. The Euro6 emission standard reduces the values of PM and NOx, in comparison with Euro5, to 1 mg/km of PM and 40 mg/km of NOx.
Figure 2. (a) The CO2 emissions of different business sectors in the EU. (b) The CO2 emissions of different business sectors in Romania.
Sustainability 07 01637 g002
Figure 2a,b shows that CO2 emissions are produced mainly by electricity and heat production, transportation, and the industrial sector. For each sector, the situation in Romania is presented and the renewable resources that can be used to alleviate the current situation are evaluated. The waste sector is also represented as well as Romania’s involvement in recycling waste in comparison with the EU.

2.1. The Energy Sector

The energy sector is the basis of development of a country as part of the economic infrastructure. In the current context, sustainable development involves meeting the energy demand, not by increasing energy supply (except for the provision of renewable energy), but through reducing energy consumption by improving technologies, by restructuring the economy and by changing attitudes concerning the efficient use of energy. The intensity of CO2 emissions between 2000 and 2011 is shown in Figure 3. The intensity value for each year was calculated as the ratio between CO2 emissions from energy consumption in the year and the Gross Domestic Product (GDP) in that year.
Figure 3. CO2 emission intensity of energy in Romania between 2000 and 2011.
Sustainability 07 01637 g003
According to Figure 3, the reduction of CO2 impact on the environment for the energy sector was achieved through the use of renewable energy sources (RES). These sources include forms of energy derived from renewable, natural processes, in which the production cycle takes place in periods that are directly proportional to their consumption periods. Thus, the energy of sunlight, winds, flowing water, biomass and geothermal heat may be captured by using different technologies [10,11,12,13]. Renewable energy is extremely important today, being considered to play a crucial role in increasing the security of energy resources by reducing dependence on fossil fuels and reducing greenhouse gas emissions. Several researchers have focused on the analysis of renewable energy resources in the European Union [14,15,16,17,18]. The proposed RES measures have brought considerable improvement, but have not shown evidence of full involvement in sustainable development.
The consumption of energy from RES in the year 2011 and target in 2020 for Romania and for EU-29 (European Union with 27 members plus Switzerland and Norway) is shown in Figure 4. In 2011, the RES share in the final energy consumption of the EU was 13.0% compared to 8.5% in 2005 [19].
Figure 4. Member States progress towards 2020 targets in renewable energy, % [19].
Sustainability 07 01637 g004
Figure 5. Share of electricity from renewable sources of total electric power [6].
Sustainability 07 01637 g005
In recent years, the production of renewable energy has shifted from being viewed as a possible alternative into an obligatory alternative. Romania’s potential in relation to renewable energy resources in the total electrical energy is shown in Figure 5. Renewable energy sources taken into consideration in this analysis are: bioenergy, geothermal energy, wind energy and solar energy. It show a decrease of about 7% in 2011 compared to 2010 as wind and solar power intensity decreased. As shown in Figure 5, the year 2006 was less favourable to hydropower production, because it was drier than 2005. The low rainfall in the coming years led to a decrease in the yearly energy production from renewable sources.
In terms of solar radiation in Romania, the monthly spread of the values on the Romanian territory reaches maximum values in June (1.49 kWh m−2 day−1) and minimum values in February (0.34 kWh m−2 day−1). Most solar-thermal systems are made with flat or vacuum-tube solar collectors, especially in areas with low solar radiation in Europe. In the national strategy on the use of renewable energy sources, the stated wind potential is 14,000 MW (installed capacity), which can provide a quantity of energy of approximately 23,000 GWh year−1. These values are an estimate of the achievable potential. With respect to the energy potential of the biomass, the Romanian territory was divided into eight regions, accumulating in the year 2011 around 3.618 million tonnes, thus having the largest share of the total renewable energy resources in Romania. Water resources of developed inland rivers are valued at about 42 billion cubic metres per year, but because they are undeveloped, Romania can rely on having approximately 19 million m3/year due to fluctuations in the flow of rivers. The synthesis of the achievable RES potential of Romania is analysed in Table 1 [20]. For “tonne” we have used the abbreviation “toe” throughout the entire paper.
Table 1. Potential of Romania for renewable energy sources.
Renewable Energy SourceTechnical Potential [GWh]Technical Potential [thousand toe]
Wind409,73135,231
Solar thermal14,9321284
Solar photovoltaic161,92913,923
Biodiesel6084523
Bioethanol45,4613909
Solid fuel71,9666188
Micro hydro14,7241266
Geothermal27924
Total710,10361,058

2.2. The Transportation Sector

Rules and policies in energy and the environment highlight the considerable environmental impact of urban agglomerations and increase in the number of motor vehicles. According to the latest studies, urban traffic generates 40% of CO2 emissions and 70% of other pollutant emissions [21,22,23,24,25].
At the EU level, transportation is responsible for about 28% of GHG emissions, and 84% of these are caused by road transport. The high level of emissions from road transport (CO2, CO, NOx, SO2, NH3, and volatile organic compounds, particles loaded with heavy metals, i.e., lead, cadmium, copper, chromium, nickel, selenium, and zinc) has a considerable effect on the environment, human health and on local and national sustainable development.
Eurostat highlights that, between 2011 and 2012, CO2 emissions decreased in nearly all Member States, except Malta (+6.3%), the United Kingdom (+3.9%), Lithuania (+1.7%) and Germany (+0.9%). The most significant decreases were those in Belgium and Finland (both −11.8%), Sweden (−10.1%), Denmark (−9.4%), Cyprus (−8.5%), Bulgaria (−6.9%), Slovakia (−6.5%), the Czech Republic (−5.2%), Italy and Poland (both −5.1%).
In Romania, in 2010, there were 32,897 (thousand tons CO2) going down in 2012 and reaching 30,758 (thousand tons of CO2). Thus, there is an improvement of 6.5%, i.e., a decrease in CO2 emissions of 2140 (thousand tons CO2) [26]. This CO2 decrease is due primarily to the legislative environment by introducing the environment tax for aggressive polluting cars and due to investments in educating people about the use of renewable resources at an industrial and domestic level (by total or partial funding of using these emerging technologies). EU reports that, in terms of fuel consumption, the 2015 target is approximately equivalent to 5.6 L per 100 km of petrol or 4.9 L per 100 km of diesel. The 2021 target equates approximately to 4.1 of petrol or 3.6 L/100 of diesel litres per 100 km [20,26].
Transport systems used in Romania are freight and passenger transport. Within these systems, the following networks operate: road transport, rail transport (maritime and inland waterways), air transport, non-motorized and special (through pipes and electric air transport).
Energy consumption for every mode of transport in Romania is shown in Figure 6a [6]. Thus, road transport has the greatest share, around 89% of the total energy consumption in transportation, in 2011.
Figure 6. (a) Energy consumption by transport mode (national/modes of transport/1000 toe). (b) Biofuel consumption in the transport sector (%/national/1000 toe) [6].
Sustainability 07 01637 g006
To improve the current situation, efforts are being made for reducing the number of and retiring the old, highly-polluting vehicles from the roads and for developing strategies to encourage the population to purchase hybrid cars.
As seen from the evolution presented in Figure 6, steps are being taken to support the use of bio-fuels and hybrid cars in transportation, which lead to a value of 3.55% in 2011 as shown in Figure 6b. The European Union Directive 2003/30/EC presents the objective of reaching a 5.75% share of renewable energy as a proportion of the total energy consumption of the transport sector by 2010 [27].
It should also be mentioned—even though it is not within the scope of this paper—it has been argued that the 2030s will bring about transport technologies (with low or zero emissions) that will be implemented on a large scale, and the following decade (the 2040s) will call on major and complex decisions to be made on energy technologies and on the structure of the EU economies.

2.3. The Waste Sector

Good waste management based on waste selective collection and recycling can decrease the carbon dioxide [28,29,30,31]. In Romania, the municipal solid waste (MSW) recycling rate reached its highest value in 2011, i.e., 7% of the total collected waste. The evolution of MSW collection and recycling are shown in Table 2. The quantity of MSW collected per capita, in the year 2011, in Romania was 239 kg, 22% less than in 2008. In Romania, waste is mostly stored in locations specifically designated for this operation, but which are not managed properly. However, some pilot experiences on composting, thermal treatment or co-combustion of some fraction of MSW as they are or pre-treated were developed or are in progress [32,33].
Table 2. Municipal waste collection and recycling rate [6].
MSW (tons)200620072008200920102011
Collected 6,334,4916,187,9436,558,3426,264,7785,325,8084,553,300
Recycled 40,94565,74172,110100,455296,342331,622
MSW recycling rate0.65%1.06%1.10%2%6%7%

2.4. The Industrial Sector

The industrial sector is a major polluter in Romania, among the top three sectors that emit CO2 into the atmosphere, contributing to environmental pollution. In Romania, according to public reports, in 2010, there were 491,805 active companies, significantly less than in 2008 (Figure 7a). Currently, the number of active companies is in a slight decline, which is the main cause of the reduction of waste generated by economic activity. In the current situation of economic instability, there is a downward evolution in the number of active companies as reported by the national statistics [34]. The first waste generator is mining, but the quantity has decreased since 2007 (Figure 7b).
Figure 7. (a) Romanian active companies (b) Generated waste by economic activity (tons).
Sustainability 07 01637 g007

3. Results and Discussion

The above data may be useful in performing an assessment of the trends in the use of renewable resources in Europe and Romania. Thus, in the EU, considerable increase in the use of RES is expected, in order to mitigate the environmental impact of greenhouse gases, and in particular of carbon dioxide. Figure 8 shows the evolution of RES in the analysed sectors in accordance with EU strategies: renewable energy sources for electricity (RES-E), renewable energy sources for heating and cooling (RES-H&C), renewable energy sources for transport (RES-T), renewable energy sources for industry (RES-I) and renewable energy sources for residential (RES-R). RES-E is clearly the most important with an expected value of 50% until 2050 and an increase of 35% until 2020 [34,35]. Assessing Romania in terms of the use of RES and the alignment with the EU strategies and policies, the situation is shown in Figure 8b.
Figure 8. (a) Renewable energy resources (RES) indicators at the EU level. (b) RES indicators at the Romanian level.
Sustainability 07 01637 g008
Analysed data related to GHG emissions proves that there will be a difference of at least 50 million tons of CO2 equivalent annually, as difference between the target value laid down in the Kyoto Protocol and the total emissions in the commitment period of the 2020 convention, even considering the possible uncertainties related to inventories and projections of GHG emissions. The economic crisis of the recent years has reduced these levels even further [35]. The total GHG emissions of Romania in 1990 were 253.3 (million tons), being reduced by 52.1% in 2010, i.e., 121.4 (million tons).
According to the Kyoto Protocol, average 2008–2011 emissions in Romania were 53% lower than the base-year level, well below the Kyoto target of −8% for the period 2008–2012. LULUCF activities are expected to decrease net emissions by an annual amount equivalent to 1.1% of base-year level emissions.
In the second part of this section, Romania’s carbon footprint is to be shown. Thus, CO2 emissions in Romania highlights the environmental impacts associated with energy use in various sectors of activity listed at the beginning of this study. The total CO2 emissions in Romania is divided by the total number of citizens and the thus the carbon footprint indicator is obtained; it represents virtually the total amount of greenhouse gases (expressed in CO2) we produce per year through the burning of fossil fuels for heat or electricity we consume, as shown in Figure 9.
Figure 9. Carbon Footprint.
Sustainability 07 01637 g009

4. A Summary of Findings

A number of considerations may be made on the basis of available data, starting from the situation of Romania’s in comparison with that of the EU and considering the participation in the Kyoto Protocol and the Covenant of Mayors-EU:
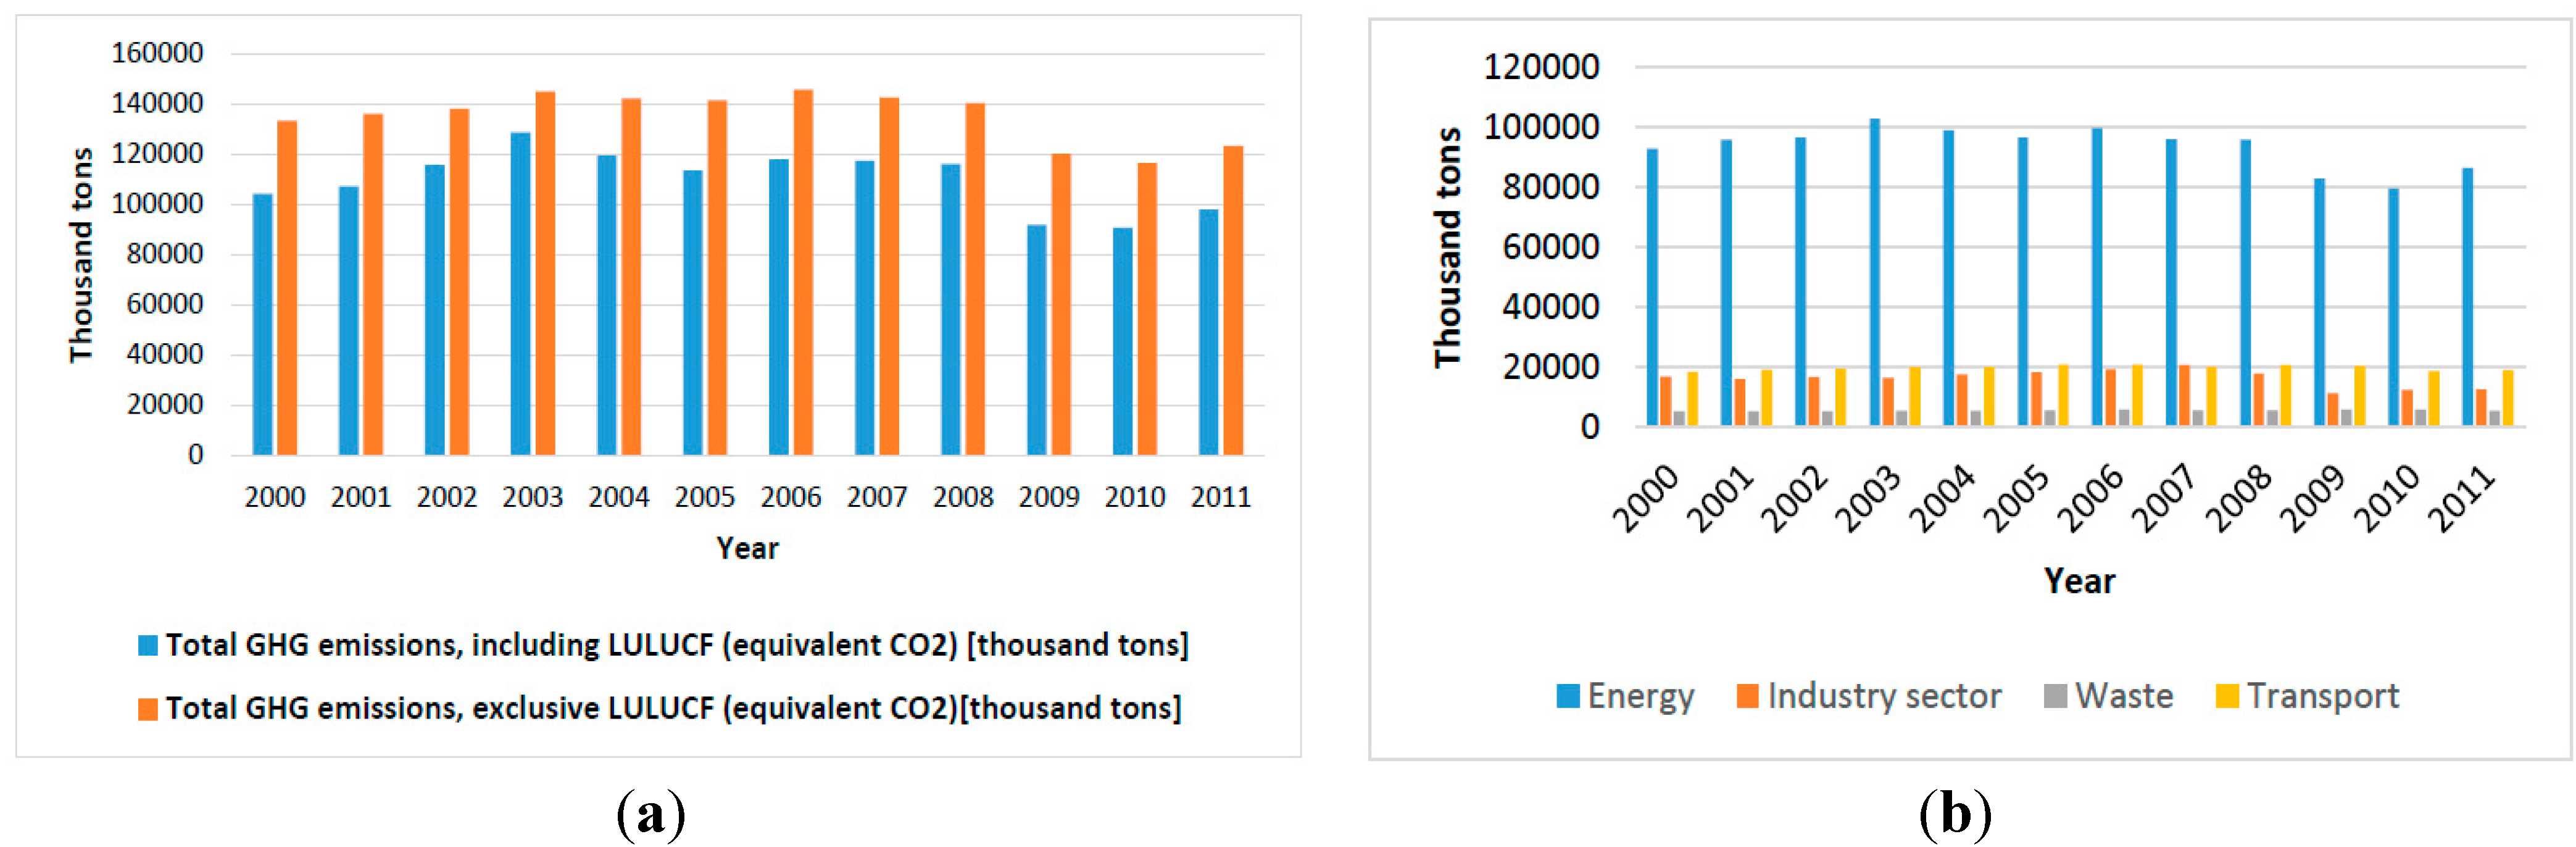
  • Level of total GHG emissions is lower compared to 2008, but there was a small increase in 2011 (according to Figure 1a);
  • The emissions decreased mainly in public electricity and heat production and road transport (according to Figure 1b and Figure 2) ;
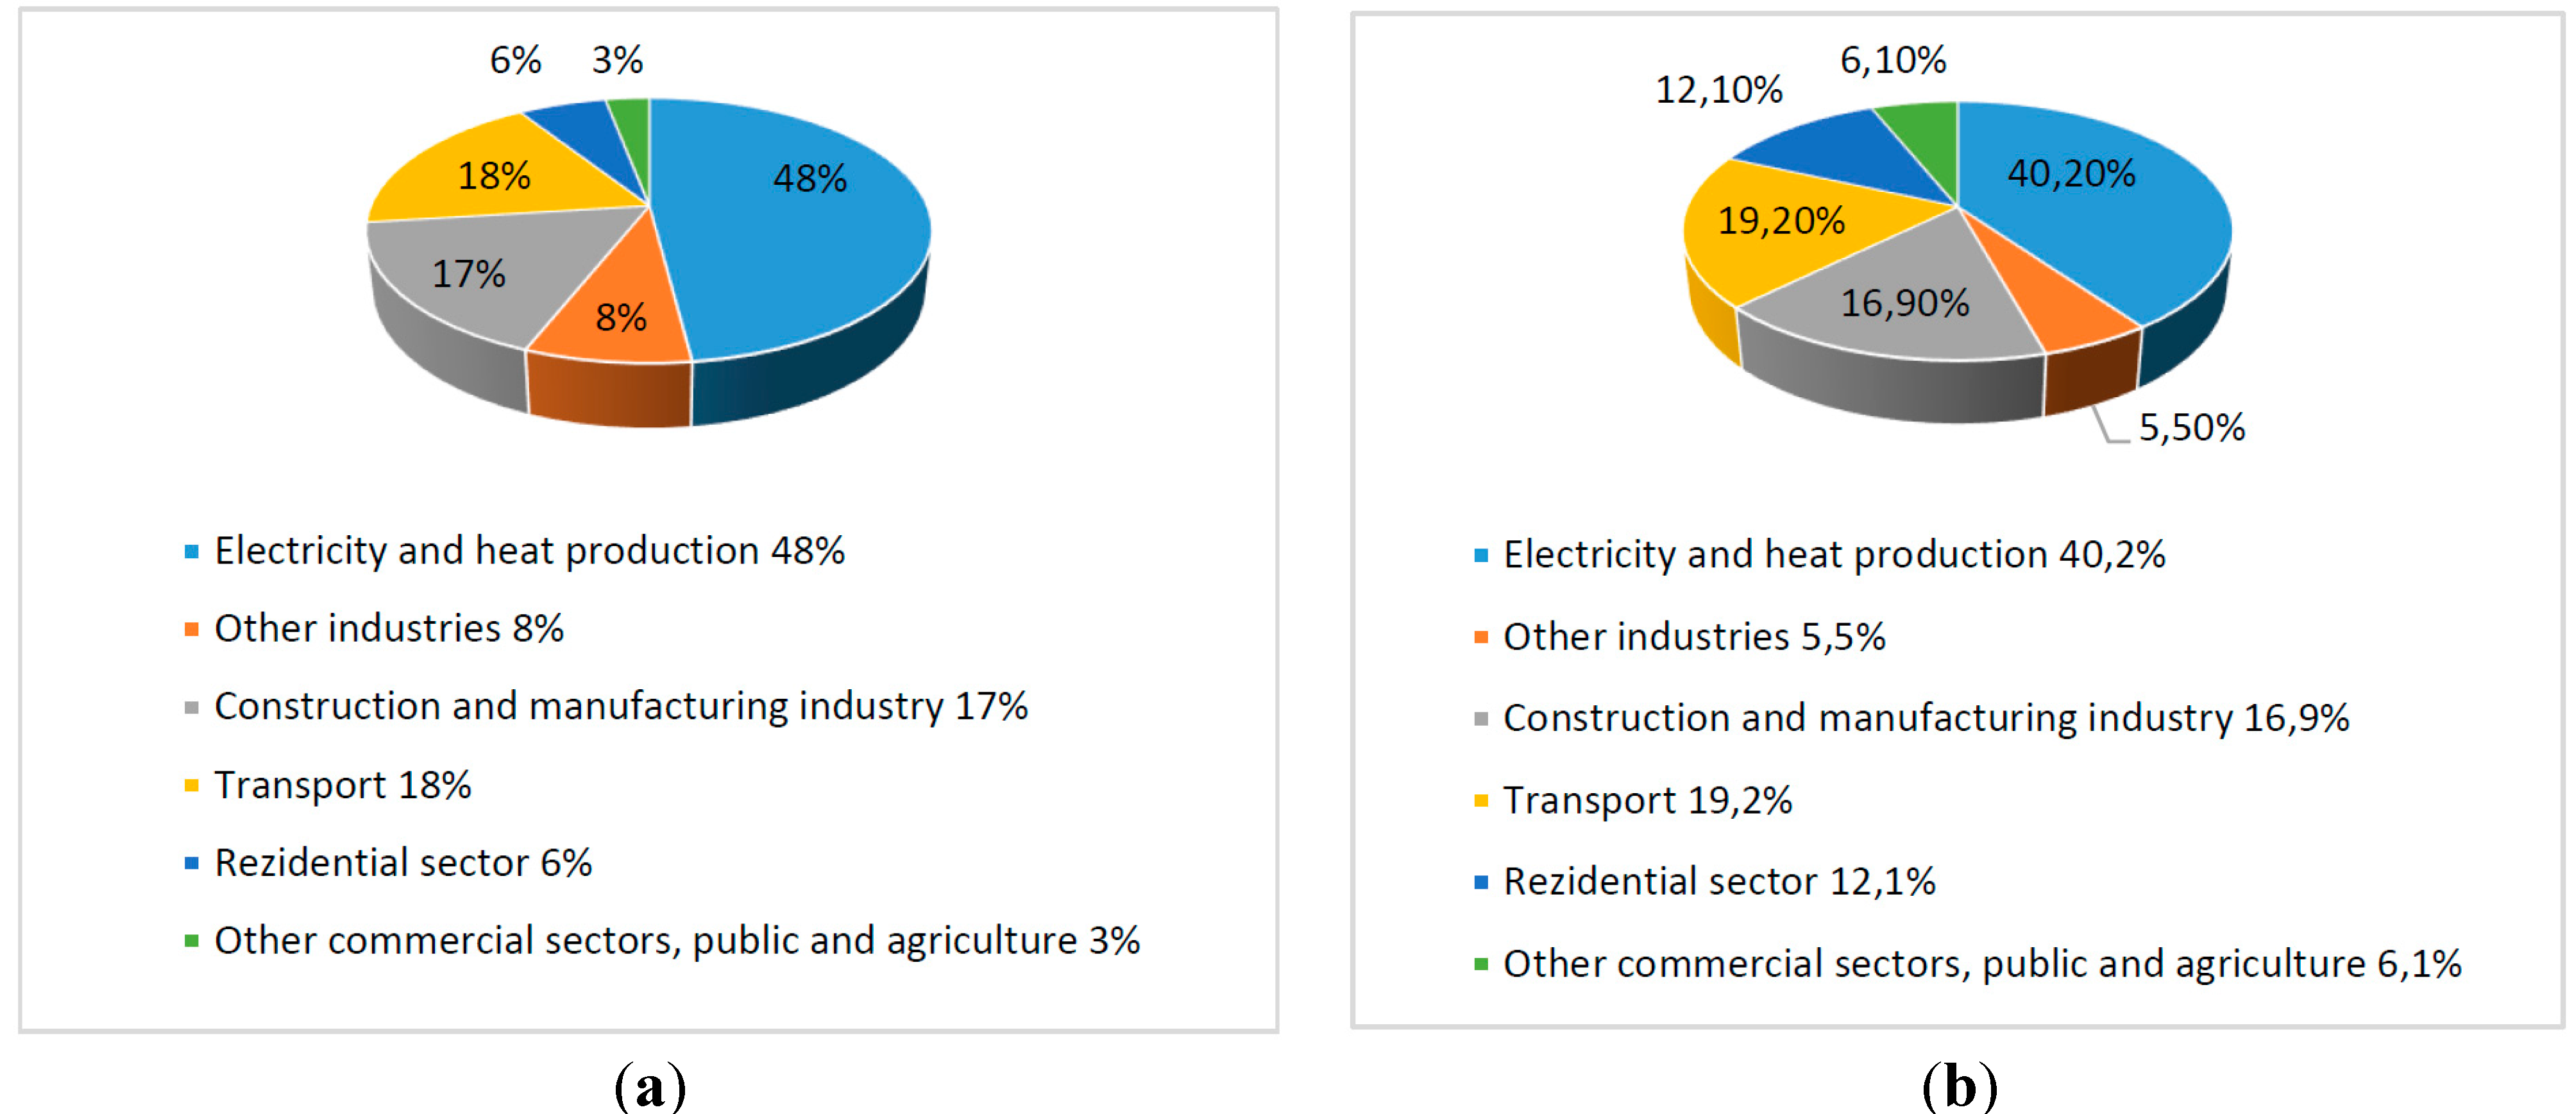
  • In terms of the CO2 emissions in Romania, there are actions to monitor and reduce pollution in excessively polluting sectors (the first three sectors): electricity and heat production, manufacturing industry and transport. For example, Romania’s energy sector emits 8% more CO2, i.e., 48% (According to Figure 2). These actions and strategies mainly refer to the use of renewable sources (subsidized by the government) and to the reduction of polluting factors and their replacement with innovative elements;
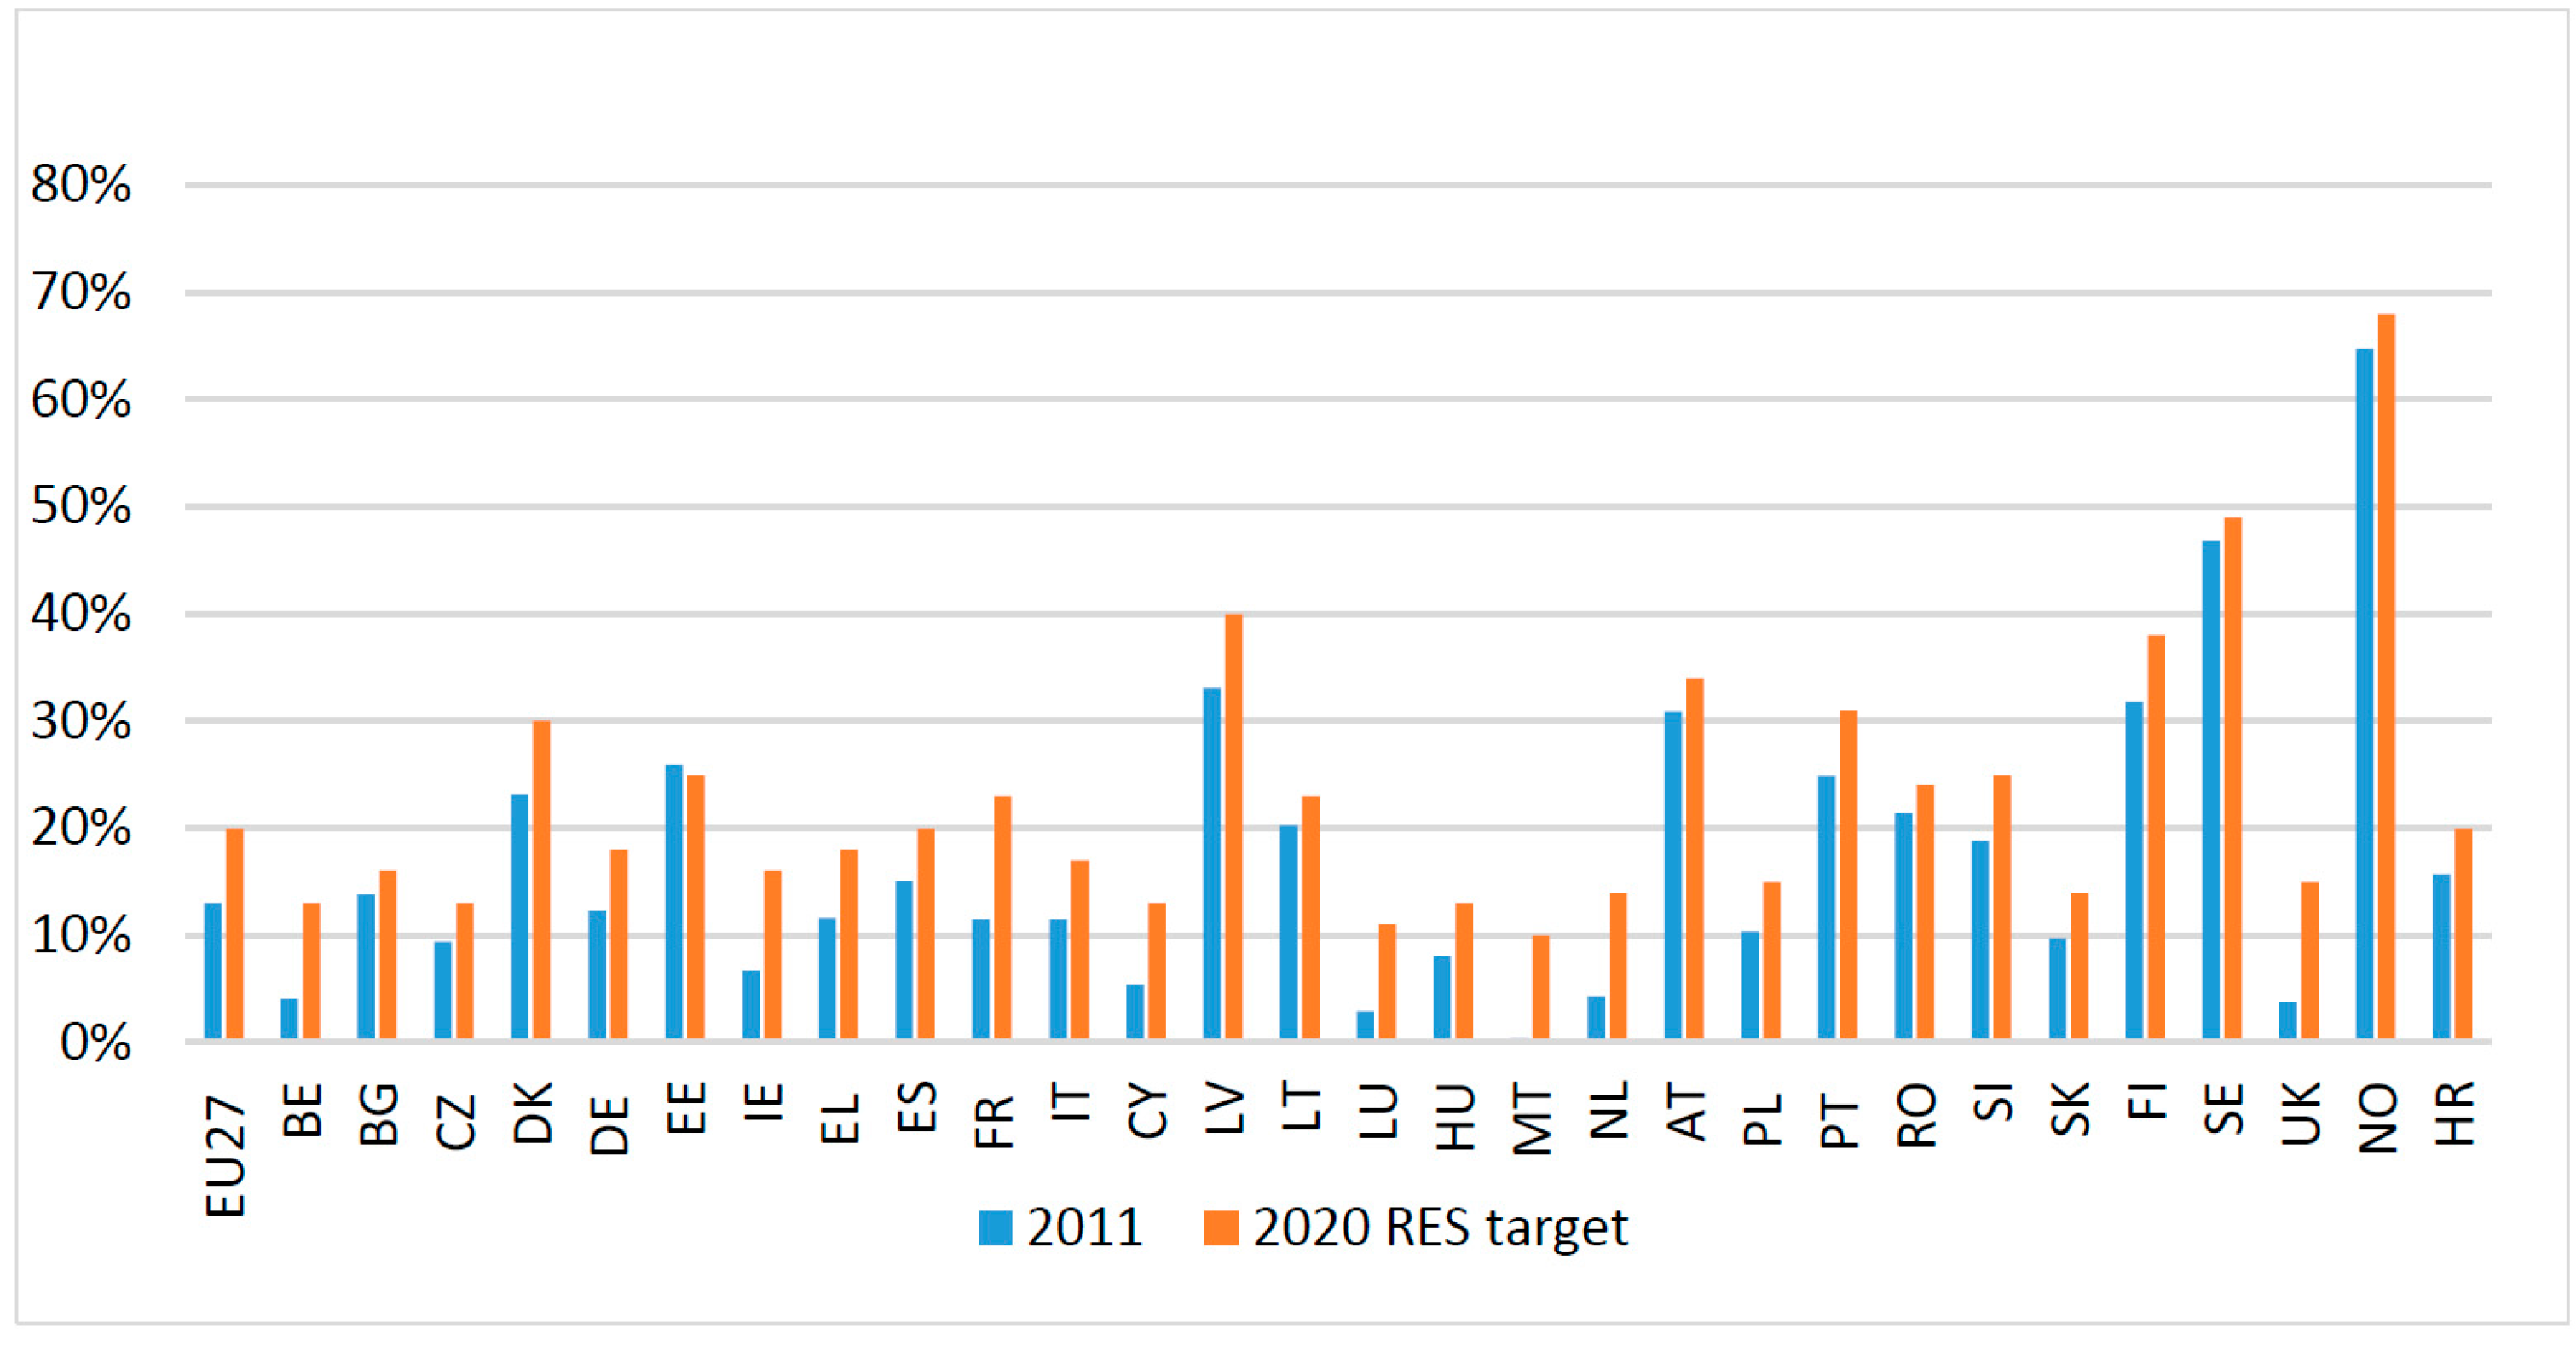
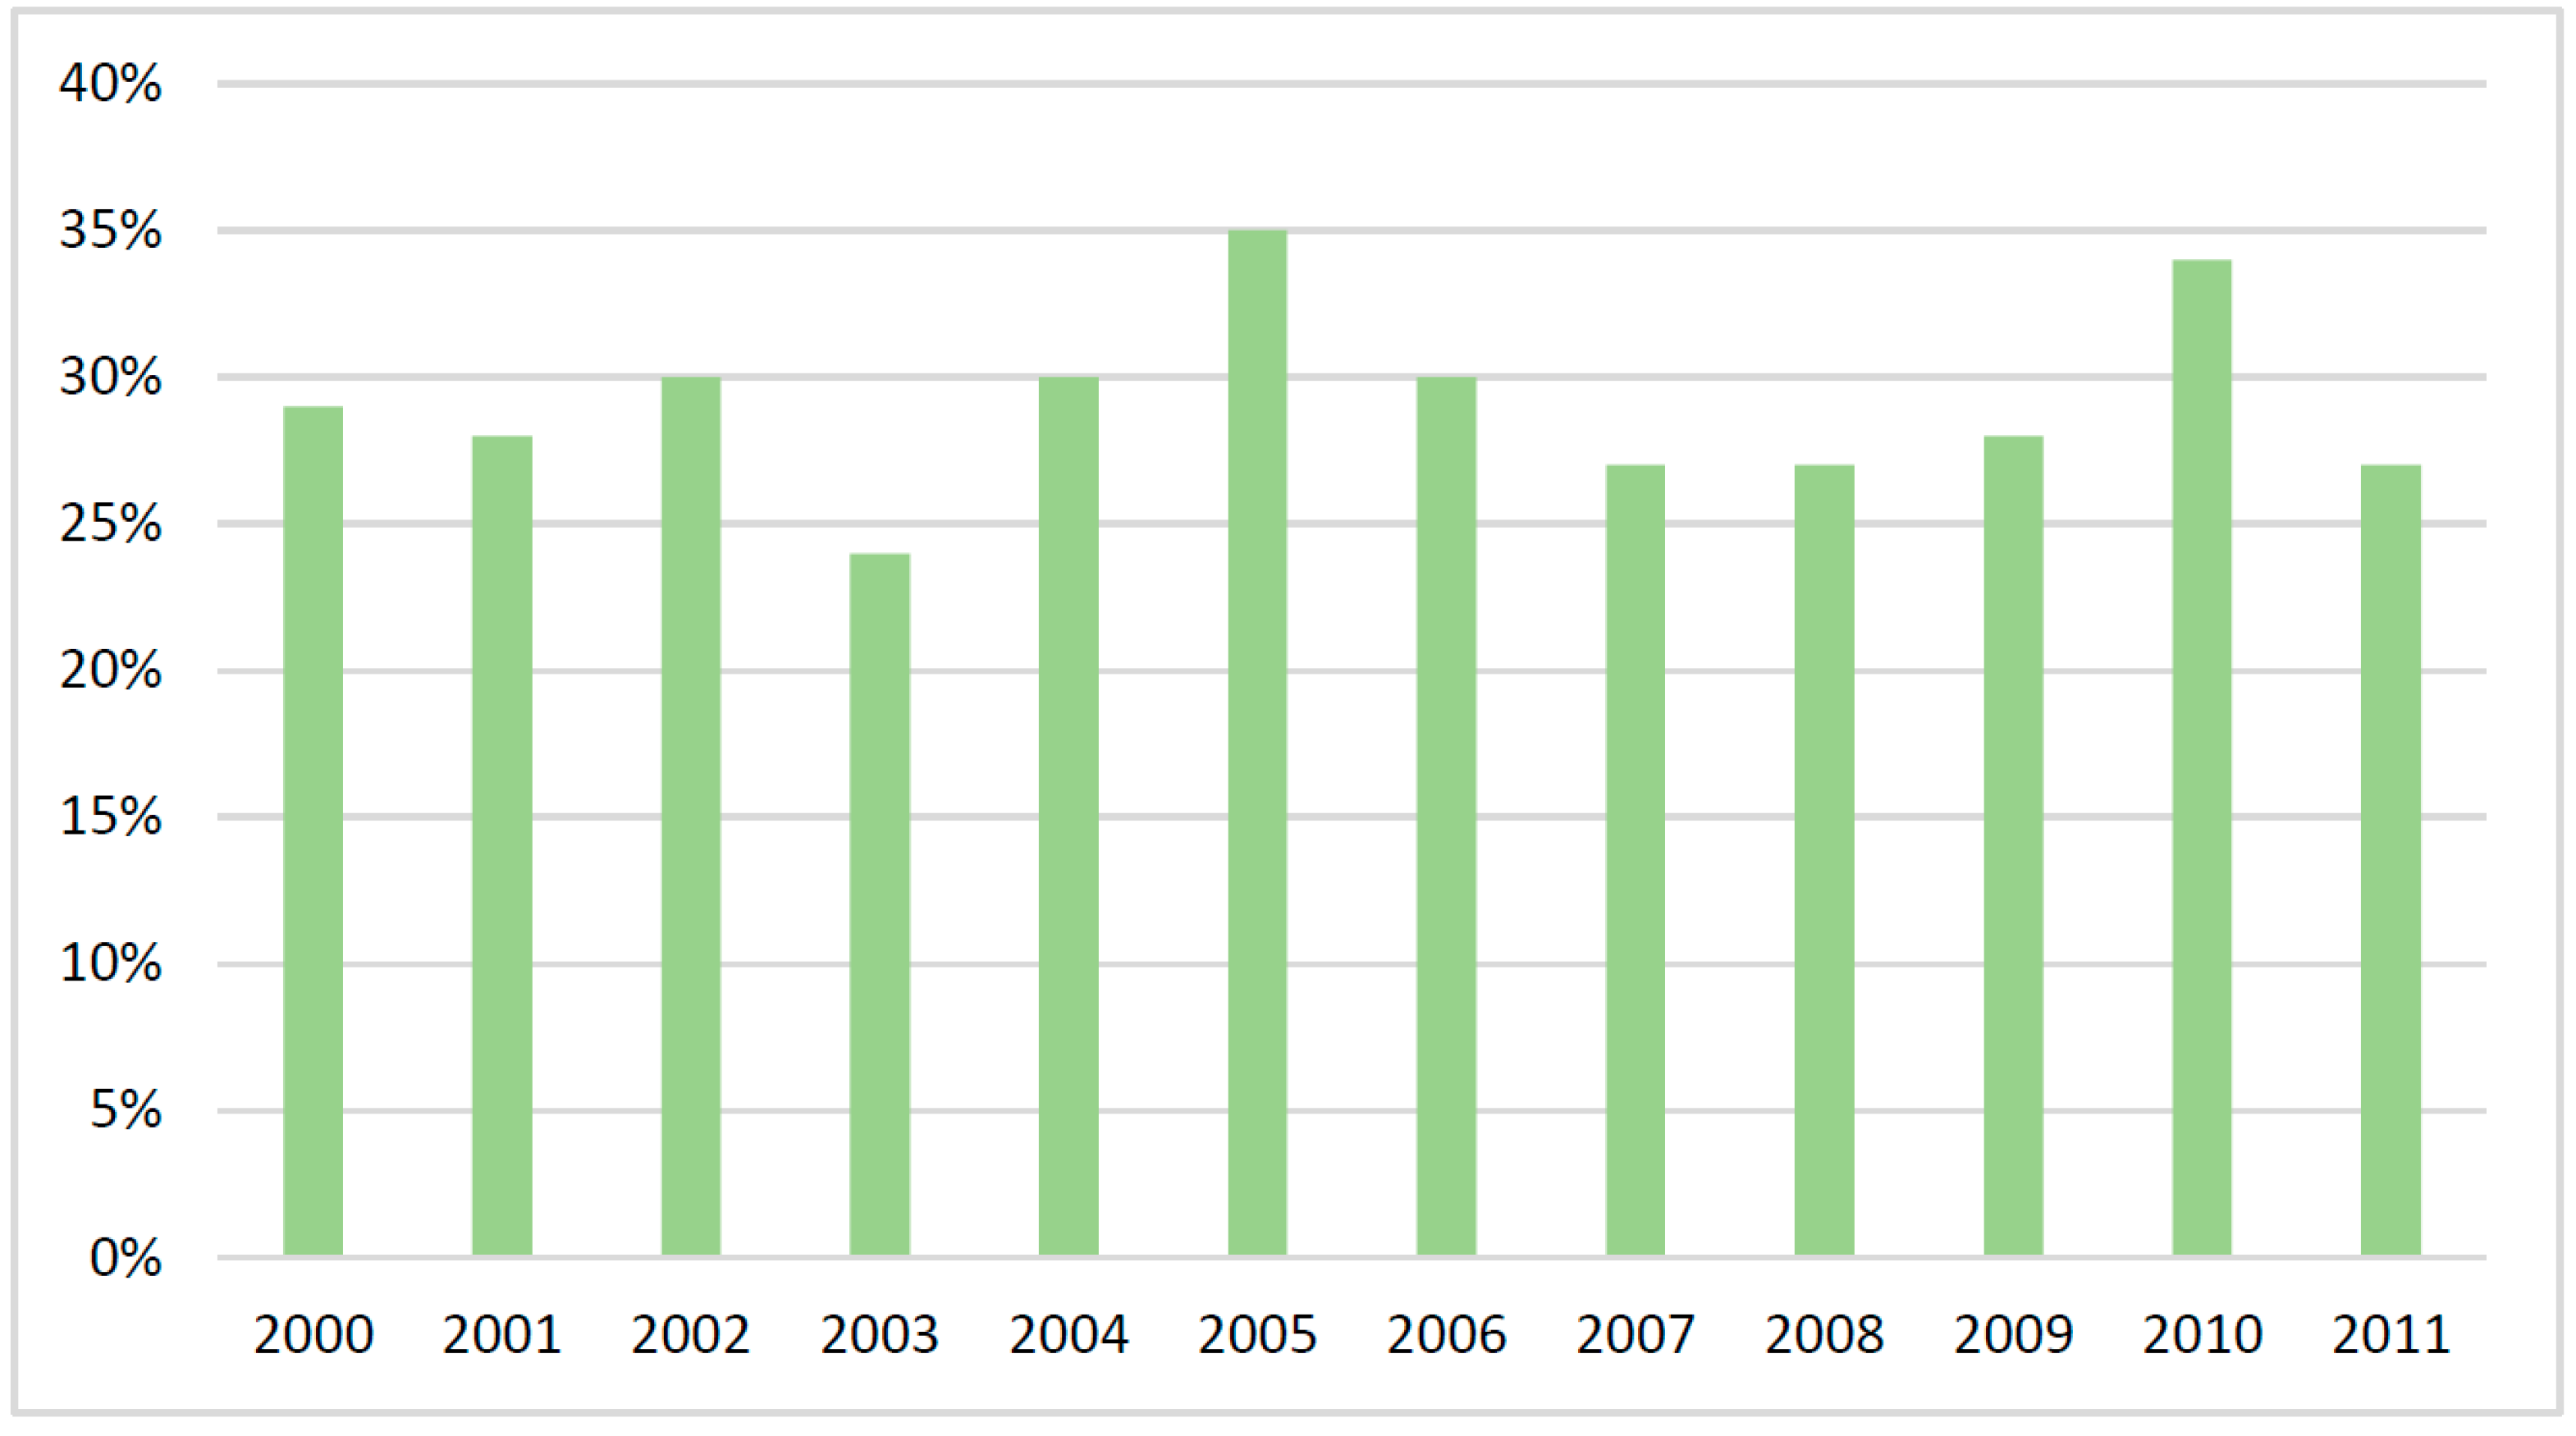
  • Due to the intensity of rainfall and climate change, the share of electricity from renewable sources of the total electric sector was 27% in 2011, i.e., a lower value than in 2010 when it was 34% (according to Figure 5);
  • In terms of transport, both in Romania and the EU, road transport has the largest share of modes of transport. It consumes the greatest amount of energy, surpassing by far air, rail or inland waterway transport (according to Figure 6a and [6]);
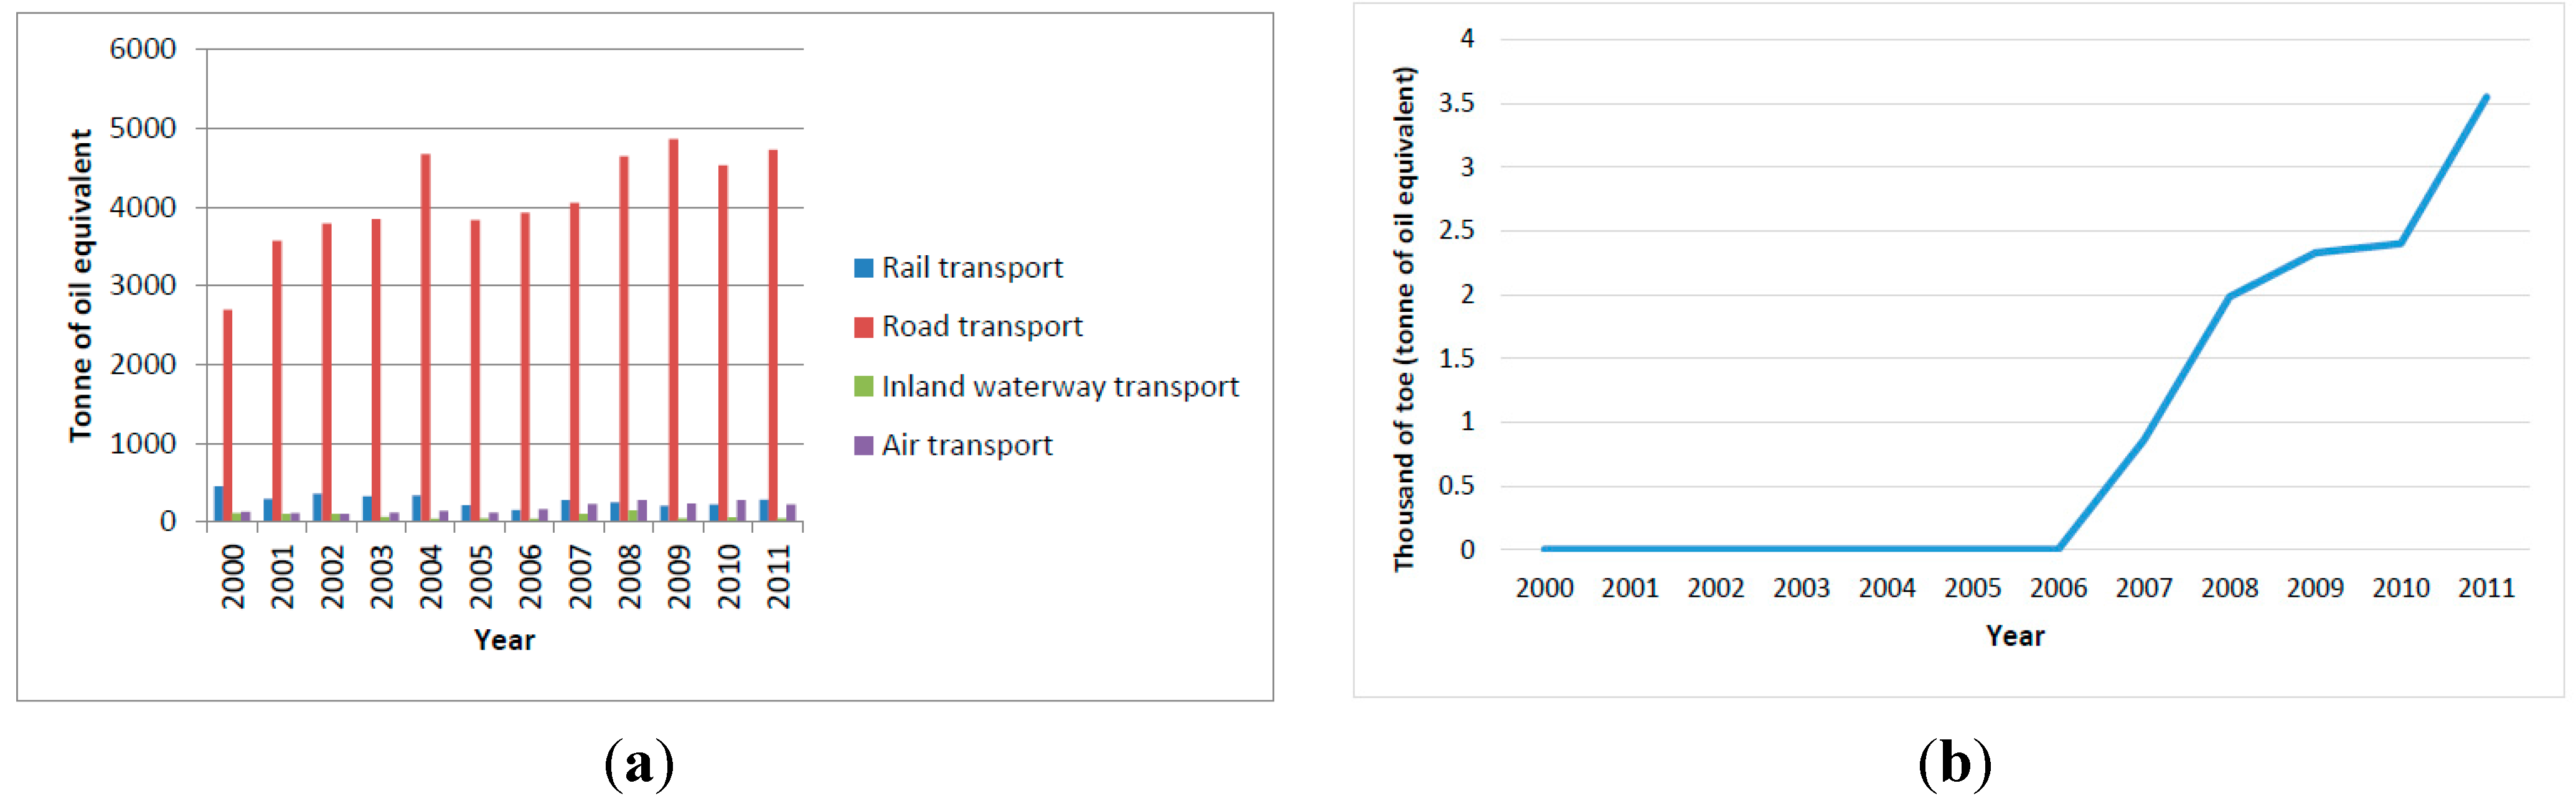
  • There are efforts to use bio-fuels and hybrid cars in transportation, reaching a value of 3.55% in 2011, which was a major breakthrough compared to 2006 (according to Figure 6b);
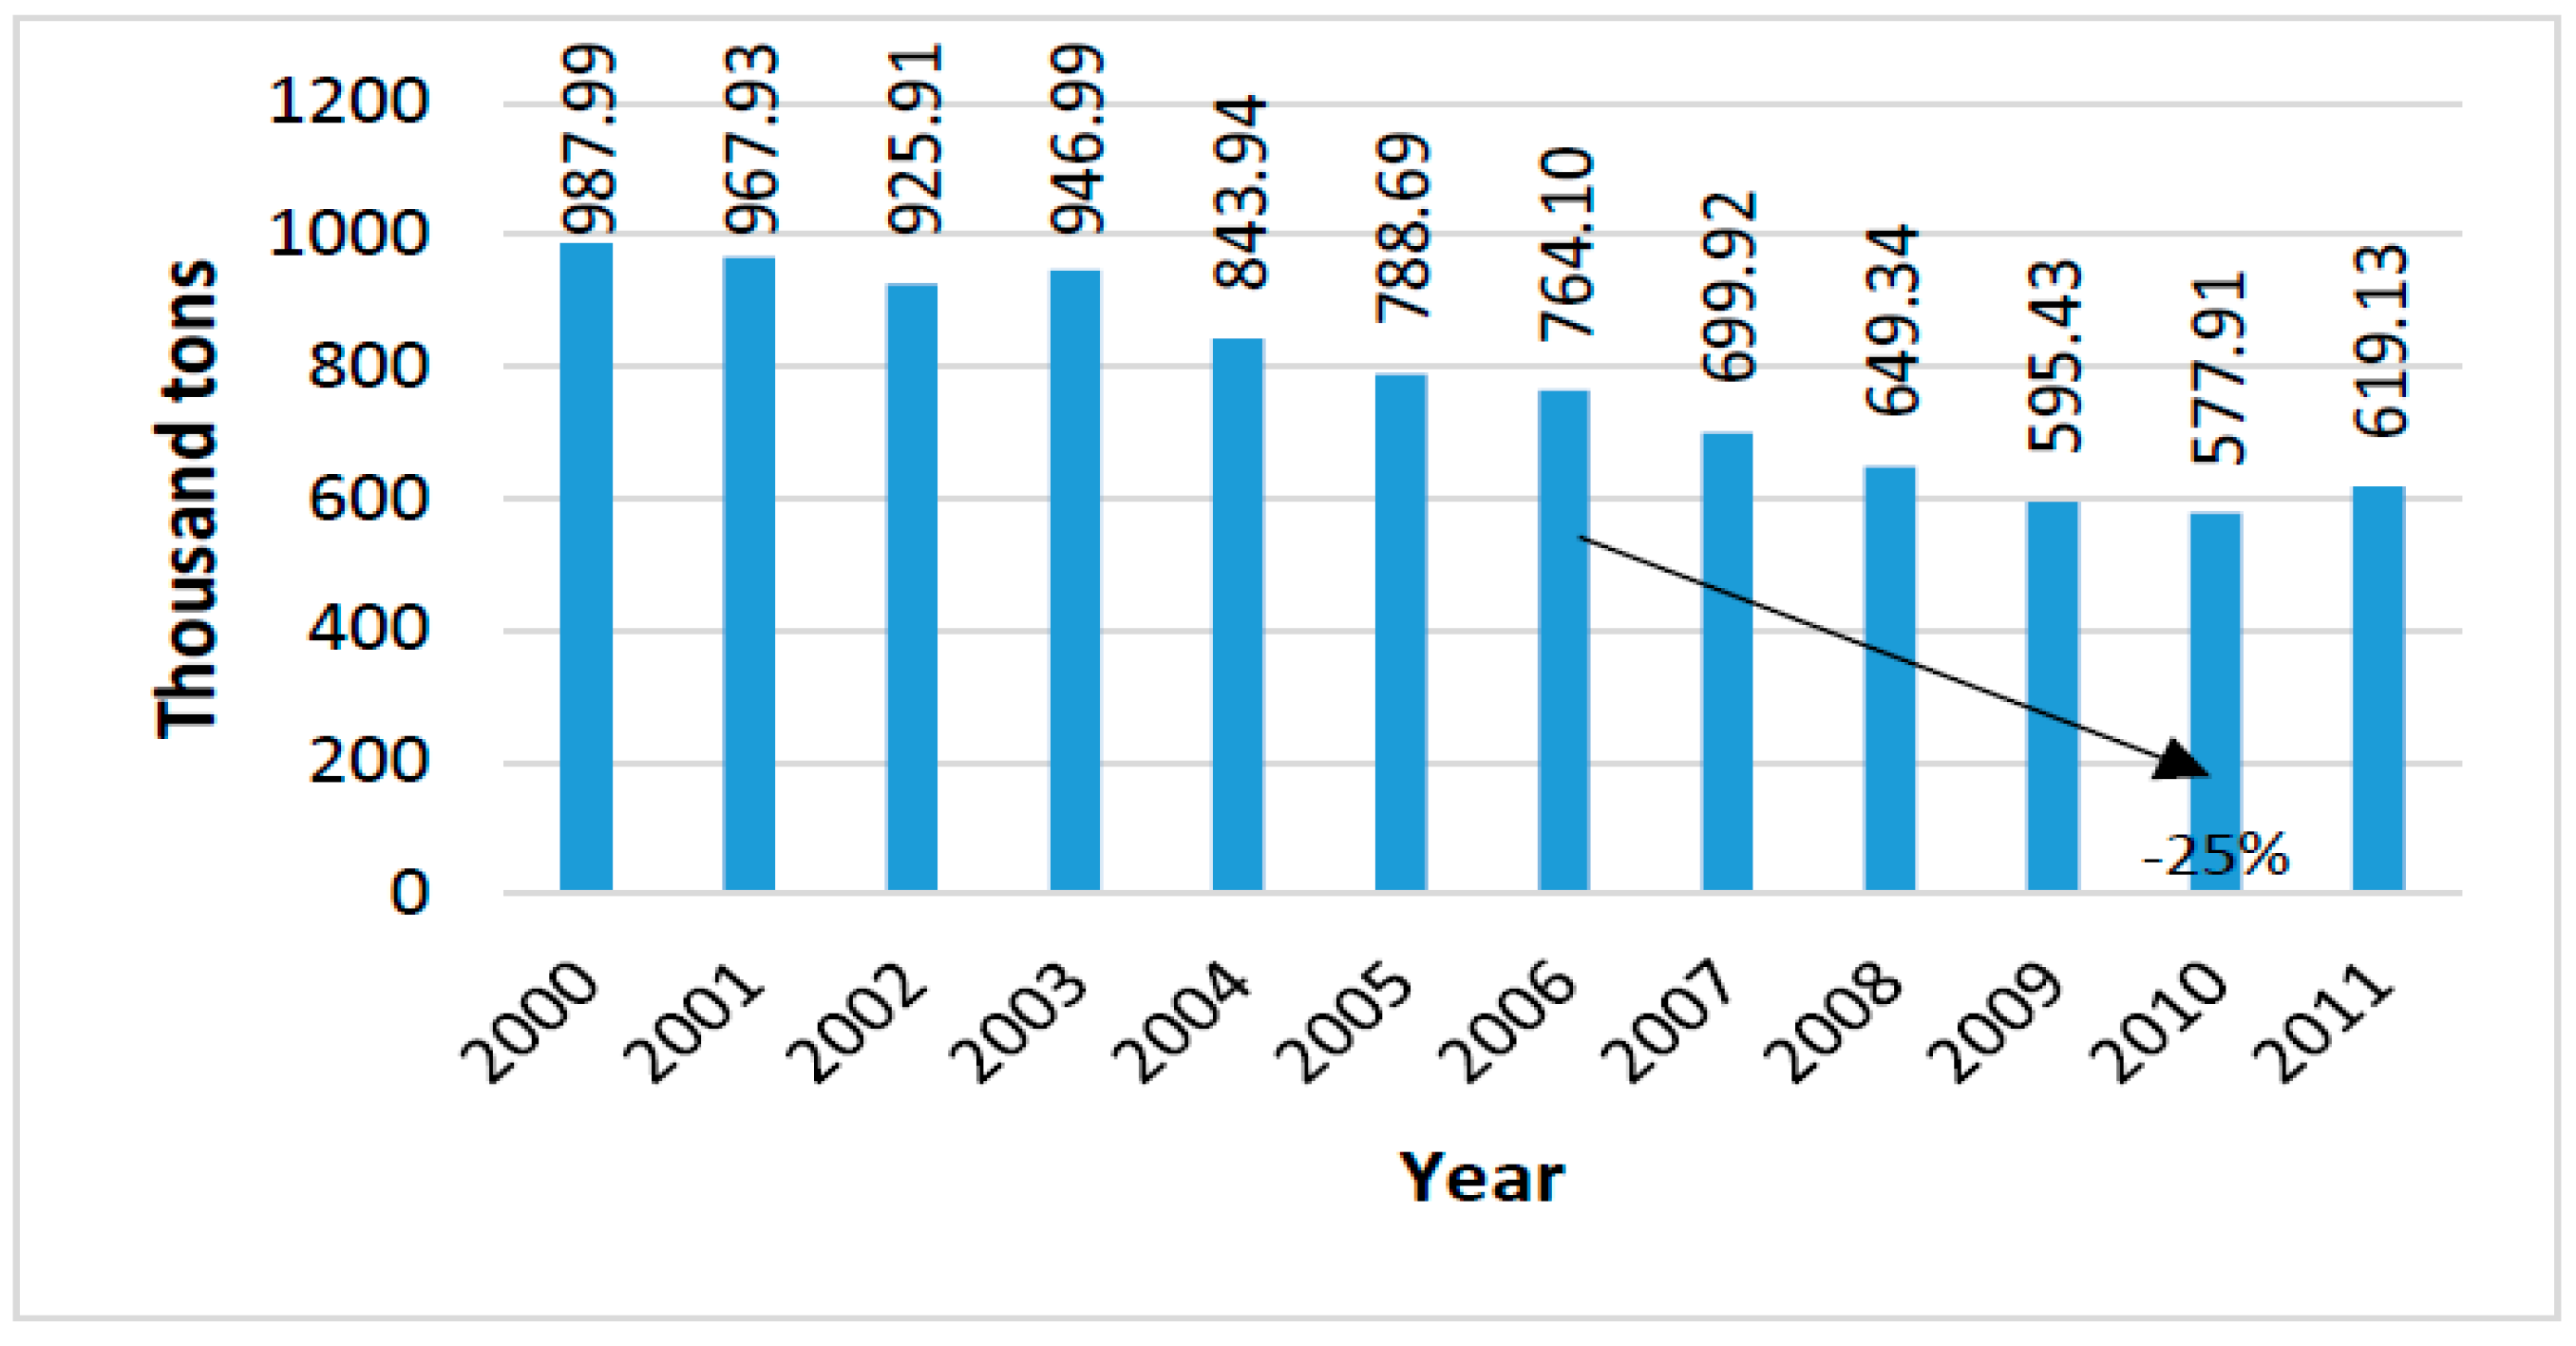
  • The waste sector is in an unacceptable situation in comparison with the EU. The expected reduction of landfilling will positively affect the role of MSW sector in the balances of GHG thanks to the decrease of fugitive emissions of methane (according to Figure 7a,b);
  • Romania is situated below the EU per capita average amount of MSW generation;
  • The industrial sector shows a slight decrease in the number of active companies, and thus there was a slight decrease in the amount of waste generated.
Considering the above, Romania is making substantial efforts to reduce CO2 emissions by adopting nationwide the necessary directions and strategies (for example, subsidies granted to producers of renewable energy, reducing national taxes for cars that do not pollute excessively, by purchasing vehicles for public transport that run on renewable energy, and others), thus aligning to European directions for the use of renewable energy and adoption of effective waste management policies.

5. Conclusions

The effectiveness of resources must be examined in the context of sustainable development. There is a strong connection between the quality of life and the way countries manage their natural available resources. Resource-efficient countries have a higher degree of innovation, productivity at lower cost and low impact on the environment, while providing multiple opportunities for improving emissions and sustainable life styles. Therefore, the efficient use of resources is based on a number of factors, such as redefining the way in which urban systems are globally understood, developing a common language for the assessment of sustainability indicators, reviewing the indicators which constitute the sustainability of cities and the financial support of the entities.
The main greenhouse gas produced by human activities is carbon dioxide (CO2). It represents over 80% of the total emissions of greenhouse gases in EU Member States. The presentation of Romania’s situation globally represented the starting point for future research: evaluation of CO2 emissions for each mode of transport, the investigation of waste management technologies and their impact on Romania, the assessment of the types of industries and amounts of greenhouse gas emissions and the modelling of renewable resources at a national level.

Author Contributions

All the authors designed the research and performed some the research and preliminary analyzed; Lucian-Ionel Cioca and Larisa Ivascu wrote the paper. All authors contributed to a deeper data analysis, read and approved the final manuscript.

Conflicts of Interest

The authors declare no conflict of interest.

References

  1. United Nations Conference on Environment and Development—UNCED. Agenda 21. Available online: http://www.un.org/esa/dsd/agenda21/ (accessed on 2 November 2014).
  2. Häikiö, L. Institutionalization of Sustainable Development in Decision-Making and Everyday Life Practices: A Critical View on the Finnish Case. Sustainability 2014, 6, 5639–5654. [Google Scholar] [CrossRef]
  3. European Commission. Available online: http://ec.europa.eu/ (accessed on 10 May 2013).
  4. McGlade, J.M. State of the Water Environment. In Proceedings of the Informal meeting of Ministers of Environment and Climate Change, Nicosia, Cyprus, 7–8 July 2012.
  5. Varga, B.O. Electric vehicles, primary energy sources and CO2 emissions: Romanian case study. Energy 2013, 49, 61–70. [Google Scholar] [CrossRef]
  6. National Institute of Statistics. National Statistical System. Available online: http://www.insse.ro/cms/en (accessed on 2 November 2014).
  7. International Energy Agency. IEA Statistics. CO2 Emissions from Fuel Combustion, 2013 Edition. Available online: http://www.iea.org/publications/freepublications/publication/co2emissionsfromfuelcombustionhighlights2013.pdf (accessed on 2 November 2014).
  8. Regional Development Agency. Statistical communications. Available online: http://www.adrcentru.ro/ (accessed on 2 December 2014).
  9. Covenant of Mayors. Sustainable energy action plans. Available online: http://www.covenantofmayors.eu/ (accessed on 2 December 2014).
  10. Duflou, J.R.; Sutherland, J.W.; Dornfeld, D.; Hermann, C.; Jeswiet, J.; Kara, S.; Hauschild, M.; Kellens, K. Towards energy and resource efficient manufacturing: A processes and systems approach. CIRP Ann.–Manuf. Technol. 2012, 61, 587–609. [Google Scholar] [CrossRef]
  11. Yuan, C.; Zhai, Q.; Dornfeld, D. A three dimensional system approach for environmentally sustainable manufacturing. CIRP Ann.–Manuf. Technol. 2012, 61, 39–42. [Google Scholar] [CrossRef]
  12. MoosaviRad, S.H.; Kara, S.; Hauschild, Z. Long term impacts of international outsourcing of manufacturing on sustainability. CIRP Ann.–Manuf. Technol. 2014, 63, 41–44. [Google Scholar] [CrossRef]
  13. Paska, J.; Surma, T. Electricity generation from renewable energy sources in Poland. Renew. Energy 2014, 71, 286–294. [Google Scholar] [CrossRef]
  14. Swider, D.J.; Beurskens, L.; Davidson, S.; Twidell, J.; Pyrko, J.; Pruggler, W.; Auer, H.; Skema, R. Conditions and costs for renewable electricity grid connection: Examples in Europe. Renew. Energy 2008, 33, 1832–1842. [Google Scholar] [CrossRef]
  15. Ostergaard, P.A. Reviewing optimization criteria for energy systems analyses of renewable energy integration. Energy 2009, 34, 1236–1245. [Google Scholar] [CrossRef]
  16. Lund, H.; Mathiesen, B.V. Energy system analysis of 100% renewable energy systems—The case of Denmark in years 2030 and 2050. Energy 2009, 34, 524–531. [Google Scholar] [CrossRef]
  17. Ban, M.; Perkovic, L.; Duic, N.; Penedo, R. Estimating the spatial distribution of high altitude wind energy potential in Southeast Europe. Energy 2013, 57, 24–29. [Google Scholar] [CrossRef]
  18. Gaigalis, V.; Markevicius, A.; Katinas, V.; Skema, R. Analysis of the renewable energy promotion in Lithuanian compliance with the European Union strategy and policy. Renew. Sust. Energ. Rev. 2014, 35, 422–435. [Google Scholar] [CrossRef]
  19. European Commission. Europe 2020 Indicators—Climate Change and Energy; The Commission to the European Parliament and the Council: Bruxelles, Belgium, 2014. [Google Scholar]
  20. Dusmanescu, D.; Andrei, J.; Subic, J. Scenario for implementation of renewable energy sources in Romania. Procedia Econ. Financ. 2014, 8, 300–305. [Google Scholar] [CrossRef]
  21. Ryu, B.Y.; Jung, H.J.; Bae, S.H. Development of a corrected average speed model for calculating carbon dioxide emissions per link unit on urban roads. Transp. Res. Part D Transp. Environ. 2015, 34, 245–254. [Google Scholar] [CrossRef]
  22. Park, M.S.; Joo, S.J.; Park, S.U. Carbon dioxide concentration and flux in an urban residential area in Seoul, Korea. Adv. Atmos. Sci. 2014, 31, 1101–1112. [Google Scholar] [CrossRef]
  23. Rada, E.C. Sustainable city and urban air pollution. WIT Trans. Ecol. Environ. 2014, 191, 1369–1380. [Google Scholar]
  24. Kheirbek, I.; Ito, K.; Neitzel, R.; Kim, J.; Johnson, S.; Ross, Z.; Eisl, H.; Matte, T. Spatial variation in environmental noise and air pollution in New York City. J. Urban Health 2014, 91, 415–431. [Google Scholar] [CrossRef] [PubMed]
  25. Istrate, I.A.; Oprea, T.; Rada, E.C.; Torretta, V. Noise and air pollution from urban traffic. WIT Trans. Ecol. Environ. 2014, 191, 1381–1389. [Google Scholar]
  26. Eurostat Statistics. Available online: http://epp.eurostat.ec.europa.eu/ (accessed on 2 December 2014).
  27. Eurostat Statistics. Available online: http://ec.europa.eu/energy/observatory/trends_2030/doc/trends_to_2050_update_2013.pdf (accessed on 2 December 2014).
  28. Fujii, M.; Fujita, T.; Ohnishi, S.; Yamaguchi, N.; Yong, G.; Park, H.S. Regional and temporal simulation of a smart recycling system for municipal organic solid wastes. J. Clean Prod. 2014, 78, 208–215. [Google Scholar] [CrossRef]
  29. Ionescu, G.; Stefani, P. Environmental assessment of waste transport and treatment: A case study. WIT Trans. Ecol. Environ. 2014, 180, 175–185. [Google Scholar]
  30. Panepinto, D.; Genon, G. Carbon dioxide balance and cost analysis for different solid waste management scenarios. Waste Biomass Valoriz. 2012, 3, 249–257. [Google Scholar] [CrossRef]
  31. Rada, E.C.; Squazardo, L.; Ionescu, G.; Badea, A. Economic viability of SRF co-combustion in cement factory. UPB Sci. Bull. Serie D 2014, 76, 199–206. [Google Scholar]
  32. Ghinea, C.; Petraru, M.; Bressers, H.T.A.; Gavrilescu, M. Environmental evaluation of waste management scenarios—Significance of the boundaries. J. Environ. Eng. Landsc. 2012, 20, 76–85. [Google Scholar] [CrossRef]
  33. Negoi, R.M.; Ragazzi, M.; Apostol, T.; Rada, E.C.; Marculescu, C. Bio-drying of Romanian Municipal Solid Waste: An analysis of its viability. UPB Sci. Bull. Serie C 2009, 71, 193–204. [Google Scholar]
  34. Government of Romania—Ministry of Foreign Affairs. National Report 2013. Evaluation of the impact of reducing emissions of greenhouse gases on the Romanian economy. Available online: http://ec.europa.eu/europe2020/pdf/nd/nrp2012_romania_en.pdf (accessed on 2 December 2014).
  35. Wadim, S.; Štepán, K.; Evgeny, L. Energy Economics and Policy of Renewable Energy Sources in the European Union. Int. J. Energy Econ. Policy 2013, 3, 333–340. [Google Scholar]

