1. Introduction
Technology development is important for many companies, and is often based on previous technologies. As such, the competitive power of a company is dependent on technology [
1]. Most R&D (research and development) results for a technology are published and registered in papers, articles, or patents [
2]. Of these, patents provide exclusive rights to a developed technology, and thus, developers apply for their technologies to be patented around the world [
3]. The exclusive rights offered by a registered patent mean that patent management is an important issue within the Management of Technology (MOT) field. Companies need to avoid patent infringements when planning their R&D, or they could face possible patent lawsuits or be required to pay a legal cost for the infringement. It is possible to use a patented technology owned by someone else, but to do so, the company must either buy the patent or enter into a contract, such as a cross-licensing agreement. Thus, we need a method for determining the technologies required in a given technological field. Here, we propose a sustainable technology selection model to find the necessary technologies for a target domain. Our model is based on a Social Network Analysis (SNA), which is used for technology forecasting in diverse MOT fields [
4,
5,
6,
7]. Forecasting models exist for finding future technologies in a target domain [
8,
9]. Based on previous works [
10,
11], we build a model to select sustainable technologies for MOT areas such as R&D planning or new product development. A technology is represented by a vertex in an SNA graph, and edges between the vertices represent technological relations. The representative or central node of an SNA graph can be the sustainable technology in the technology network, being included in all technologies. Lastly, to illustrate how our study can be applied to a real-world problem, we perform a case study using patent documents retrieved from actual patent databases around the world.
3. Network Model for Selecting Sustainable Technology
In this study, we propose a network analysis model with which to extract sustainable technologies for IP mining. Our model is based on SNA measures and visualizations. SNA is one of many network models based on graph theory. A graph is a data structure found in computer science [
12] and data science [
26]. Our graph structure is defined as follows:
where
n is the number of IPC codes, and IPC codes are used as the elements of vertices. The proposed network model has edges with a maximum of
from
) to (
) possible edges. We select sustainable technologies from the network structure based on vertices and edges. For example,
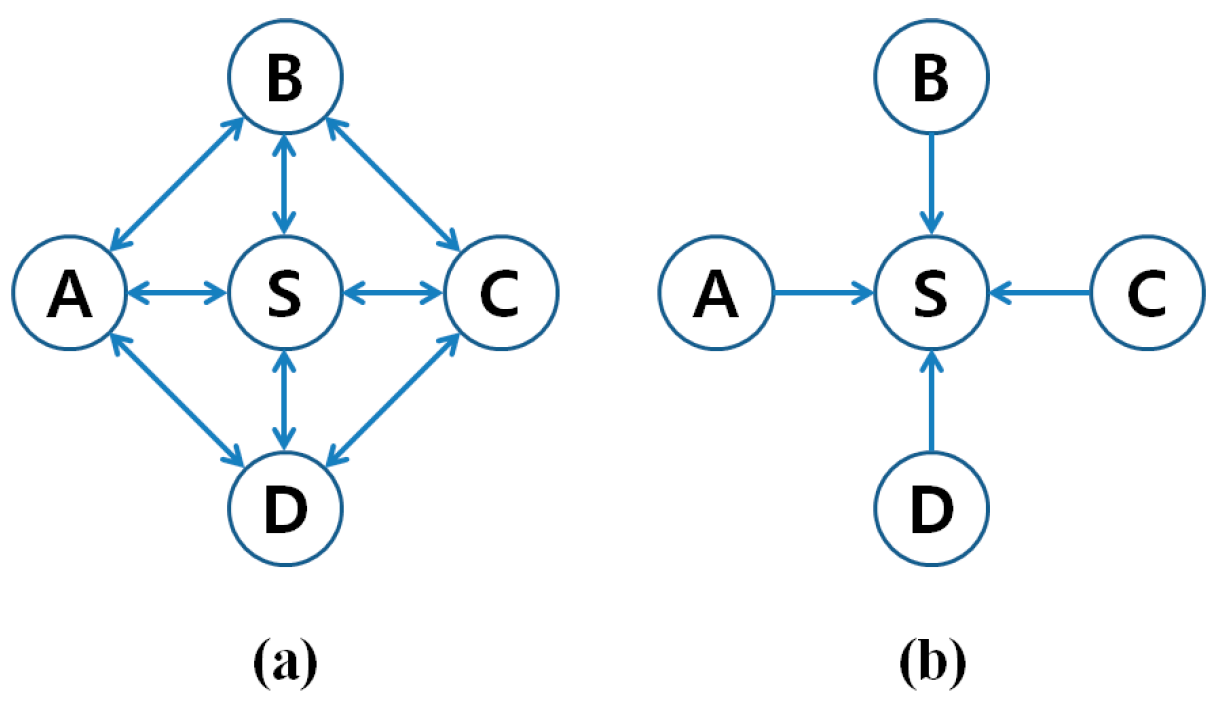
Figure 4 shows a graph structure that includes a sustainable technology node.
Figure 4.
Sustainable technology in a graph structure: A, B, C, and D are defined as Sub-technologies, S is defined as Sustainable technology in (a) in-directed and (b) directed networks.
Figure 4.
Sustainable technology in a graph structure: A, B, C, and D are defined as Sub-technologies, S is defined as Sustainable technology in (a) in-directed and (b) directed networks.
Nodes A, B, C, and D represent the holding sub-technologies of a company and node S is our sustainable technology. Note that S is located at the center of the nodes in
Figure 4a, and S is related to all other nodes. Thus, the technology of S affects the development of the technologies of A, B, C, or D. Of course, the technologies of A, B, C, and D can also influence each other’s development. Therefore, we determine node S to be the sustainable technology. The graph structure in
Figure 4b shows another case of sustainable technology. In this case, the sub-technologies are only dependent on the technology of S. Therefore, based on graph structure in
Figure 4, a company would develop its technology with node S as the core technology.
Figure 5 shows the sustainable technology management proposed in this study.
Figure 5.
Sustainable technology management.
Figure 5.
Sustainable technology management.
We can select the sustainable technology from the technology network structure. Using the sustainable technology, we develop new products or services and plan the R&D strategies for emerging and future technologies. This will improve the technological competitiveness of a company. In addition, the development of new and innovative technologies is based on R&D planning that uses the sustainable technology. We can select core technologies from the new and innovative technologies. These core technologies become candidates for the sustainable technology of a company.
Sustainable technologies can be used for diverse MOT works, such as intellectual property (IP) R&D or new product development [
6]. Based on the knowledge of the sustainable technology in a given field, we can manage the technologies of the corresponding fields. In addition, we can effectively develop new products by first determining the sustainable technology. Our model for choosing sustainable technology was constructed using social network mining [
20], which is based on SNA. SNA is composed of two components, namely a vertex (or node) and an edge (or connection), and we can explain the relationships between vertices by analyzing their edges [
26]. Here, we consider a vertex and edge as a technology and a technological connection, respectively. We use the degree, closeness centrality, betweenness centrality, graph centrality, shortest distance, and egocentric measure as evaluation criteria when choosing the sustainable technology. For
n vertices, the closeness centrality (CC) of vertex
i is defined as follows [
4,
26,
27]:
where
sdist (
i,
j) is the shortest distance between vertices
i and
j. We select the vertex with the largest CC value as the sustainable technology. We define the betweenness centrality (BC) of vertex
i as follows [
4,
26,
27]:
where
sdist(
i,
k,
j) is the shortest distance from
i to
j through
k. As in the CC case, we select the vertex with the largest BC value as the sustainable technology. The graph centrality (GC) of vertex
i is defined as follows [
4,
26,
27]:
Here, we select the vertex with the largest GC value as the sustainable technology. In this study, we use a degree measure to select the sustainable technology, as follows (see
Figure 6).
Figure 6.
SNA graph including four vertices.
Figure 6.
SNA graph including four vertices.
Figure 6 shows an SNA graph including four vertices and four edges. We know that the degree of T1 is 3, T2 and T4 have degree 2, and finally, T3 has degree 1. Therefore, T1 is determined as the most important vertex in the SNA graph. Similarly, we can select the sustainable technology (vertex) with the largest degree value. We also consider an egocentric network and neighborhood measures when selecting sustainable technologies. The egocentric network of vertex
i is defined as follows [
26]:
This is the subgraph (SG) induced by the union of i and the neighborhood of i. The egocentric network shows the incoming, outgoing, and combined specifications in the neighborhood structure of SG. This is a useful tool for evaluating local structural associations in social networks. We select the IPC codes (vertices) with larger egocentric values as sustainable technologies. The following explains the proposed process for selecting a sustainable technology.
Input: Retrieved patent data related to the target technology.
Output: Extracted sustainable technology.
Step 1: Selection of IPC codes
- (1.1)
Extract all IPC codes from retrieved patent data
- (1.2)
Select IPC codes with a frequency greater than the threshold value
Step 2: Descriptive statistics of patent data
- (2.1)
Frequency distribution of patents by IPC codes
- (2.2)
Yearly trend of the numbers of applied patents
- (2.3)
Yearly trend of the Numbers of IPC codes included in applied patents
Step 3: Social network mining
- (3.1)
Visualize technology networking using social network graph
- (3.2)
Count the degree of top-ranked IPC codes
- (3.3)
Calculating the closeness centrality of top-ranked IPC codes
- (3.4)
Calculate the betweenness centrality of top-ranked IPC codes
- (3.5)
Calculate the graph centrality of top-ranked IPC codes
- (3.6)
Calculate the shortest distance between top-ranked IPC codes
Step 4: Determine the sustainable technologies based on the results of Step 3
Step 5: Apply to practical domain
- (5.1)
R&D planning
- (5.2)
Technology management
Our model contributes to the R&D planning and technology management of a company.
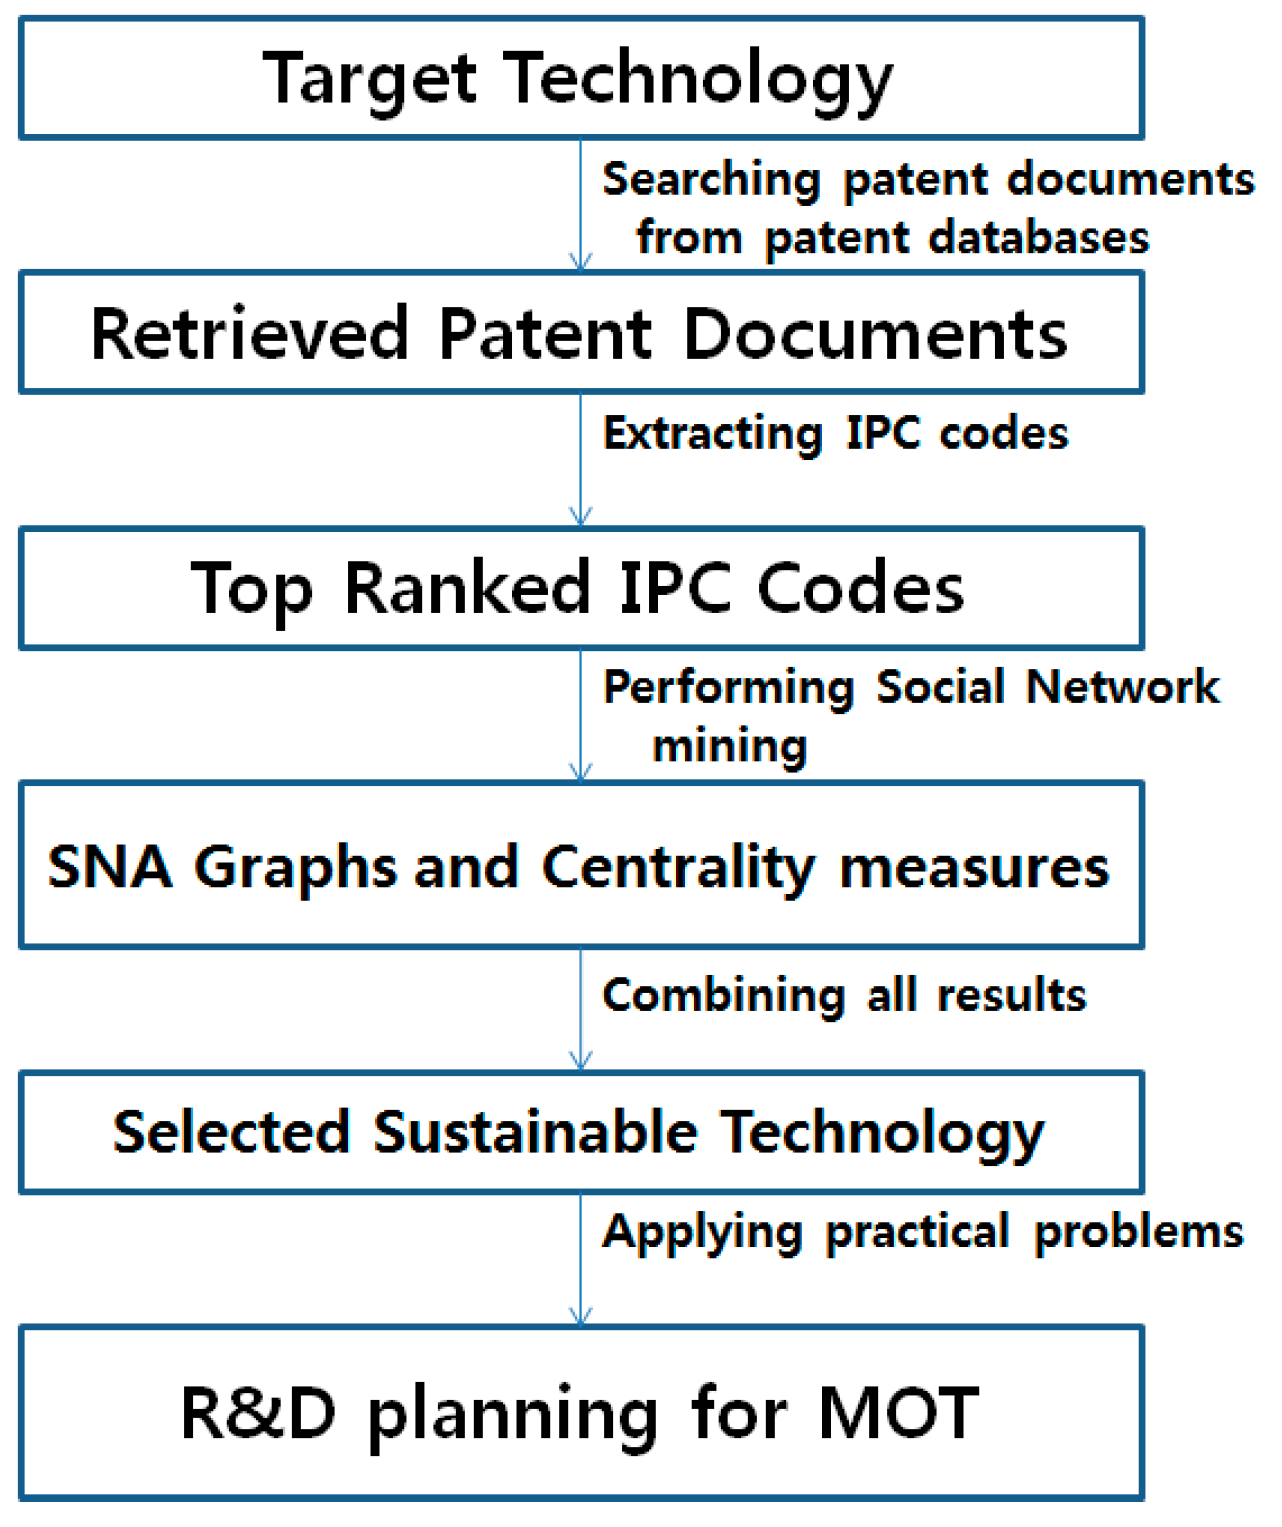
Figure 7 shows the proposed process for choosing sustainable technology, as well as its applications.
Figure 7.
Proposed process for choosing sustainable technology.
Figure 7.
Proposed process for choosing sustainable technology.
Therefore, we propose a methodology for selecting sustainable technologies for R&D planning in MOT. In the next section, we present a case study to illustrate how this research can be applied to a real-world scenario.
4. Experimental Result
We used patent documents applied for by the Ford Motor Company to illustrate the practical application of our research. We extract the IPC codes from the company’s patent data [
28,
29,
30]. The hierarchical structure [
17] of the IPC codes is shown in
Figure 8.
Figure 8.
Hierarchical structure of IPC code.
Figure 8.
Hierarchical structure of IPC code.
Figure 8 is the IPC code of F02M. The section level represents the overall body of the technological domain. This consists of eight levels, from A (human necessities) to H (electricity). The class level shows more detailed technologies than does the section level. In this study, we used the subclass level of the IPC code because in the previous studies, this level provided better results than did other levels [
6,
7,
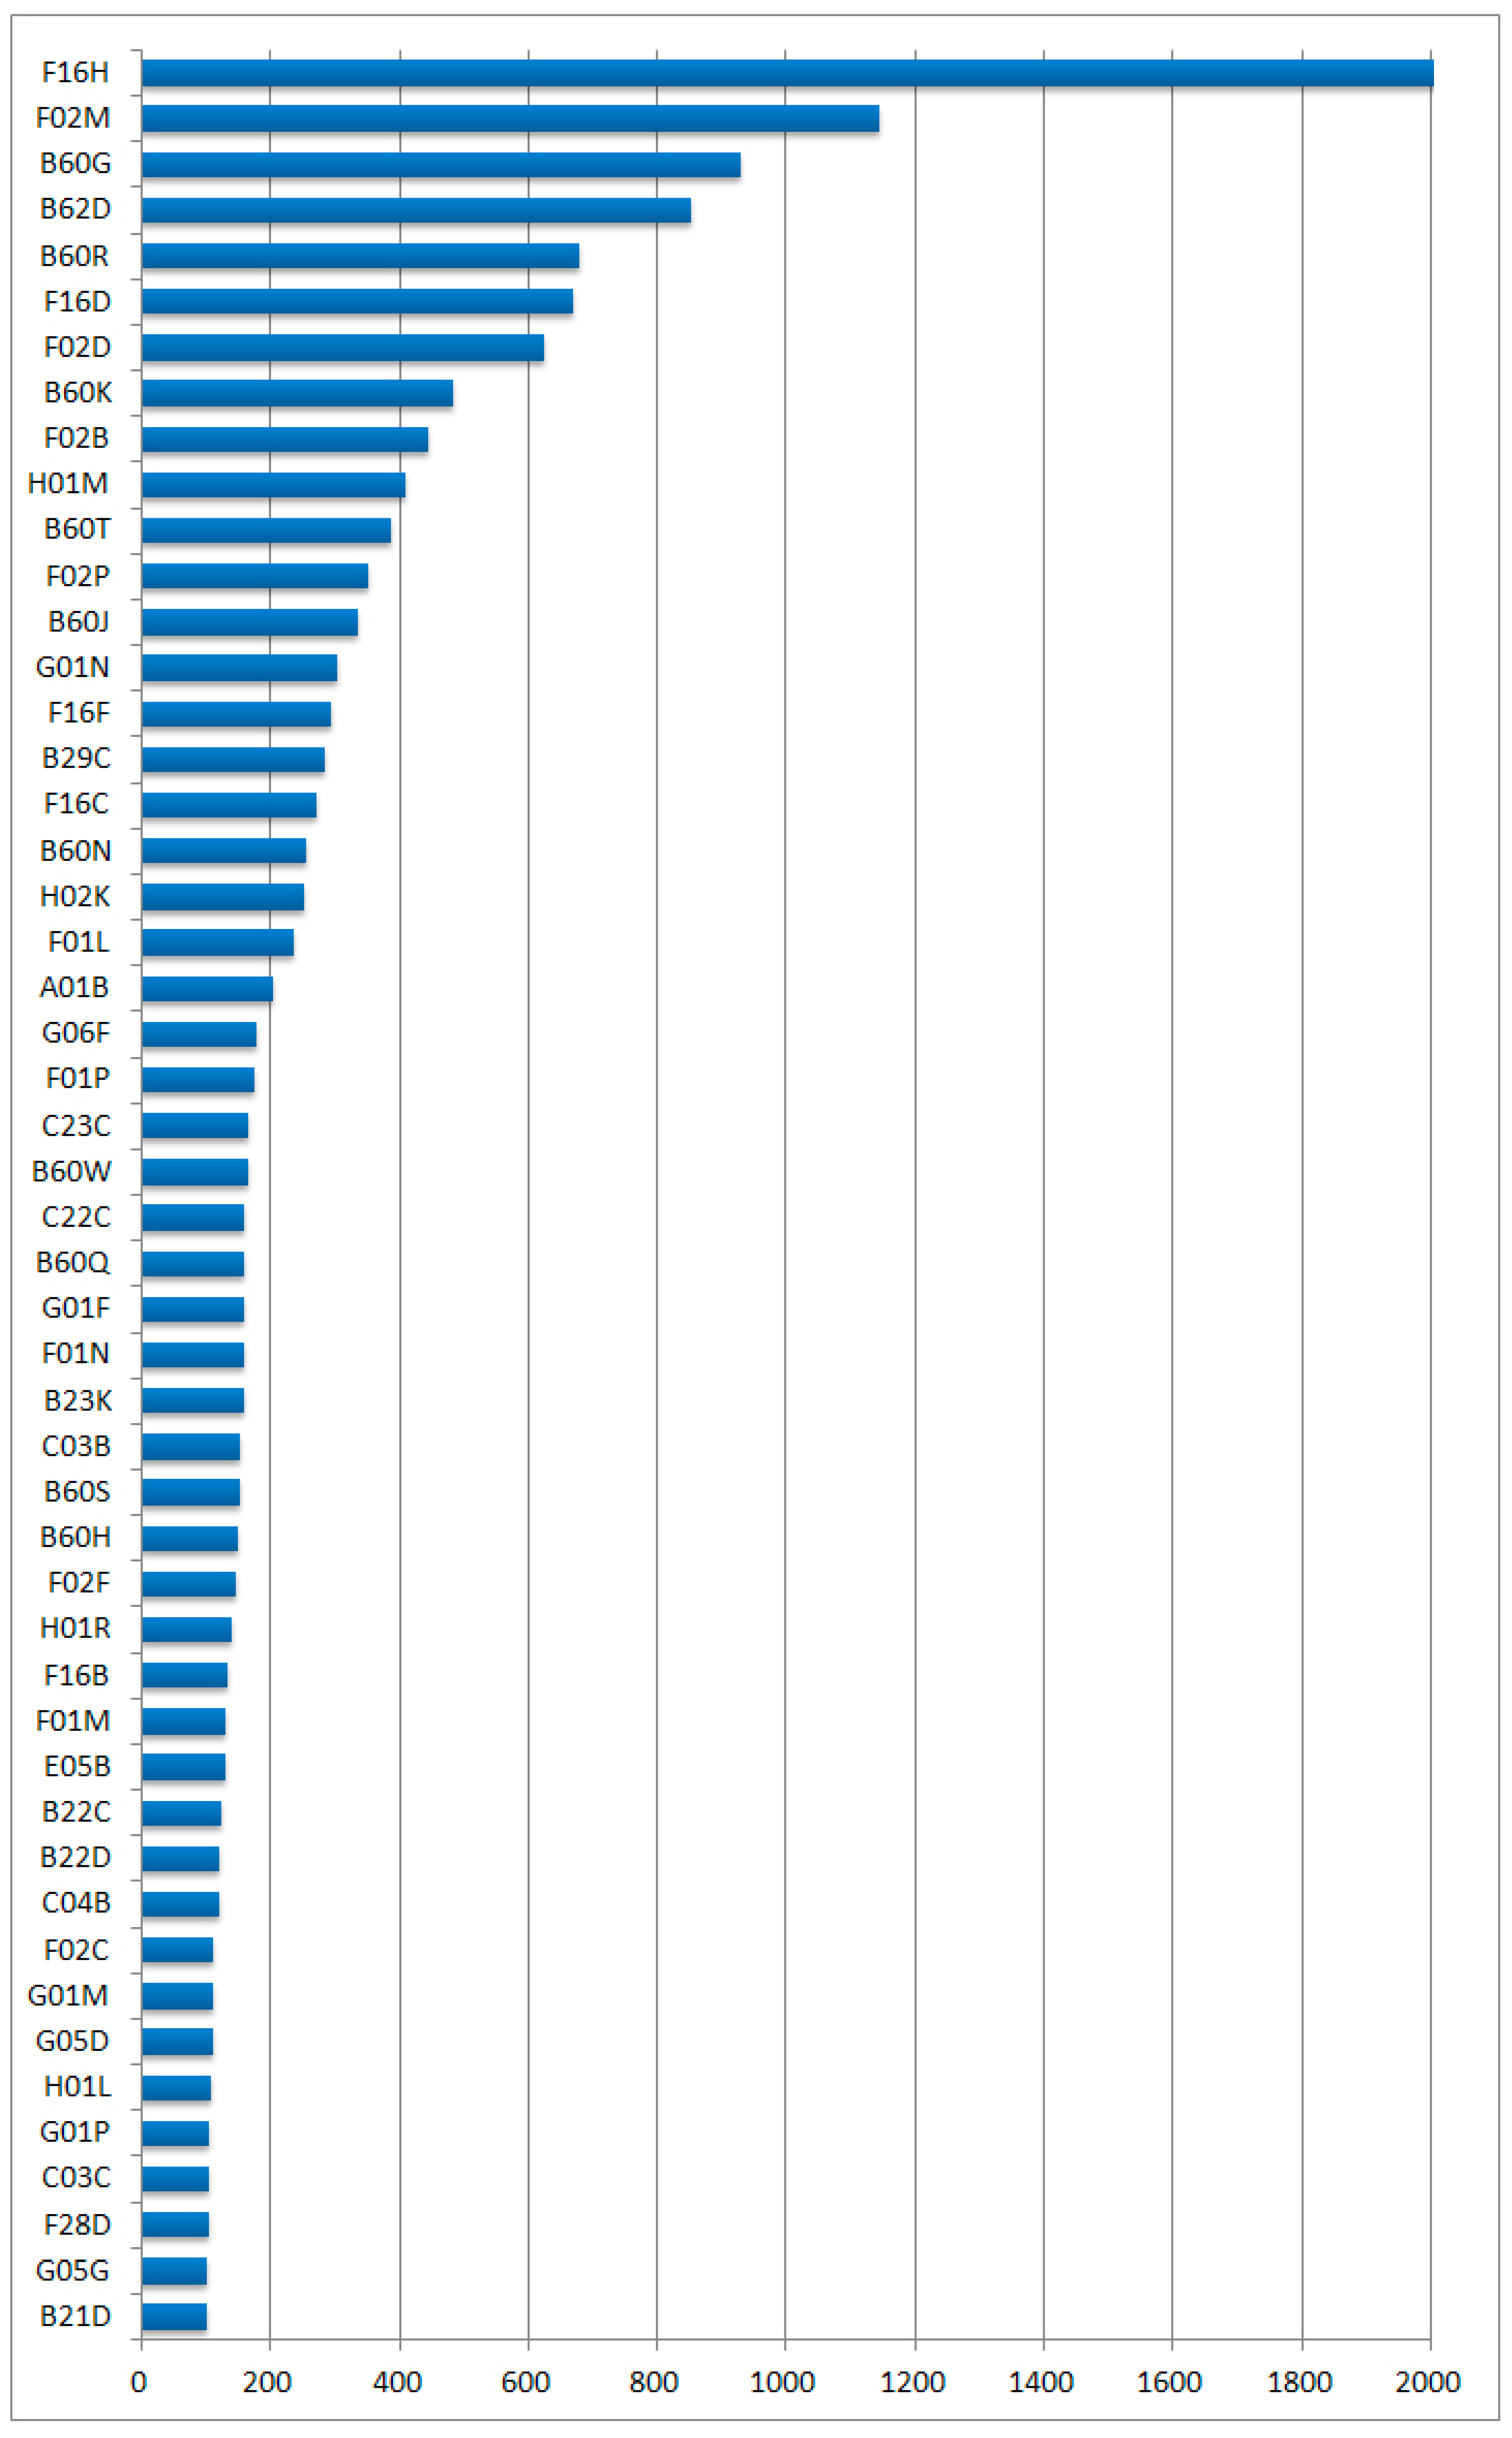
18]. In
Figure 9, we show the 49 IPC codes with frequencies above 100. These are the IPC codes we use in this experiment. In our case study, we used the “sna” and “igraph” packages, as well as the statistical functions provided by the R-Project [
26,
27,
28,
29]. R is a free data language and provides software for statistical computing. Since R is also an object oriented programming language, it has been used in many studies on statistical analysis and visualization. Most jobs in our experiments were performed using the R package and functions. When R is first installed, it includes only the basic functions for statistical computing. Thus, to add more functions for advanced statistical analyses, we install additional packages. In this study, we installed the “sna” and “igraph” packages for SNA and social network mining. The most frequent IPC code in Ford is F16H, which represents a “gearing” technology. We can obtain the technological definition of each IPC code from the World Intellectual Property Organization (WIPO) [
17]. Therefore, we know that the gearing technology is a basic vehicle technology of Ford.
The second most common IPC code is F02M. This code is related to a technology for “supplying combustion engines in general with combustible mixtures or constituents thereof”. These two are followed by B60G, B62D, and B60R explain, which describe the technologies of “vehicle suspension arrangements”, “motor vehicles; trailers”, and “vehicles, vehicle fittings, as well as other vehicle parts, not otherwise provided for”, respectively.
Figure 10 shows the frequency distribution of patents according to the number of included IPC codes.
Figure 9.
IPC codes with frequency greater than 100.
Figure 9.
IPC codes with frequency greater than 100.
Figure 10.
Frequency distribution of patents according to the number of included IPC codes.
Figure 10.
Frequency distribution of patents according to the number of included IPC codes.
We observe that most of the patents have a frequency distribution of less than 10. In particular, the largest number of IPC codes included in a single patent is two. Thus, most technologies of Ford are related to a few sub technologies with fewer than four IPC codes. Based on the previous two figures, we determined that the highest number of IPC codes was 10. Therefore, we selected the following 10 IPC codes for our case study: F16H, F02M, B60G, B62D, B60R, F16D, F02D, B60K, F02B, and H01M.
Figure 11 summarizes the numbers of patents and IPC codes, by year.
Figure 11.
Numbers of patents and IPC codes by year.
Figure 11.
Numbers of patents and IPC codes by year.
First, the number of applied patents was larger in the 1970s and 1980s, but this has decreased more recently. Second, the trend in IPC codes is similar to that of the patent behavior. Therefore, we know that the technological development of Ford occurred in the 1970s and 1980s. That is, Ford’s R&D results have decreased. To understand the technologies of Ford, we performed an SNA using the top 10 IPC codes (see
Figure 12).
Figure 12.
Social graph of 10 IPC codes.
Figure 12.
Social graph of 10 IPC codes.
We can see that F02M is connected with most of the IPC codes. Therefore, the F02M technology can be considered a sustainable technology of Ford. Next, F16H is the second IPC code to be a candidate for sustainable technology because of its large number of connections, as shown in
Figure 12. On the other hand, B60K is the least likely candidate IPC for a sustainable technology code, because it is connected to only one IPC code, namely F16H. The top 10 IPC codes based on their degree are shown in
Table 1.
Table 1.
Top 10 IPC codes by degree.
Table 1.
Top 10 IPC codes by degree.
| Rank | Degree | IPC | Defined Technology |
|---|
| 1 | 16 | F02M | Supplying general combustion engines with combustible mixtures, or constituents thereof |
| 2 | 14 | F16H | Gearing |
| 3 | 12 | B62D | Motor vehicles; trailers |
| 4 | 10 | B60G | Vehicle suspension arrangements |
| 4 | 10 | F16D | Controlling combustion engines |
| 6 | 8 | B60R | Vehicles, vehicle fittings, or vehicle parts, not otherwise provided for |
| 6 | 8 | F02D | Controlling combustion engines |
| 8 | 6 | F02B | Internal combustion piston engines; combustion engines in general |
| 8 | 6 | H01M | Processes or means, including batteries, for the direct conversion of chemical energy into electrical energy |
| 10 | 2 | B60K | Arrangement or mounting of propulsion units or of transmissions in vehicles; arrangement or mounting of plural diverse prime-movers in vehicles; auxiliary drives for vehicles; instrumentation or dashboards for vehicles; arrangements in connection with cooling, air intake, gas exhaust or fuel supply of propulsion units in vehicles |
We can see that the vertex of F02M is connected to the eight vertices of B60R, B60G, F02D, F16D, F02B, F16H, B62D, and H01M. Next, F16H has degree seven, and B62D has degree six. The IPC codes of B60G and F16D are both of degree values.
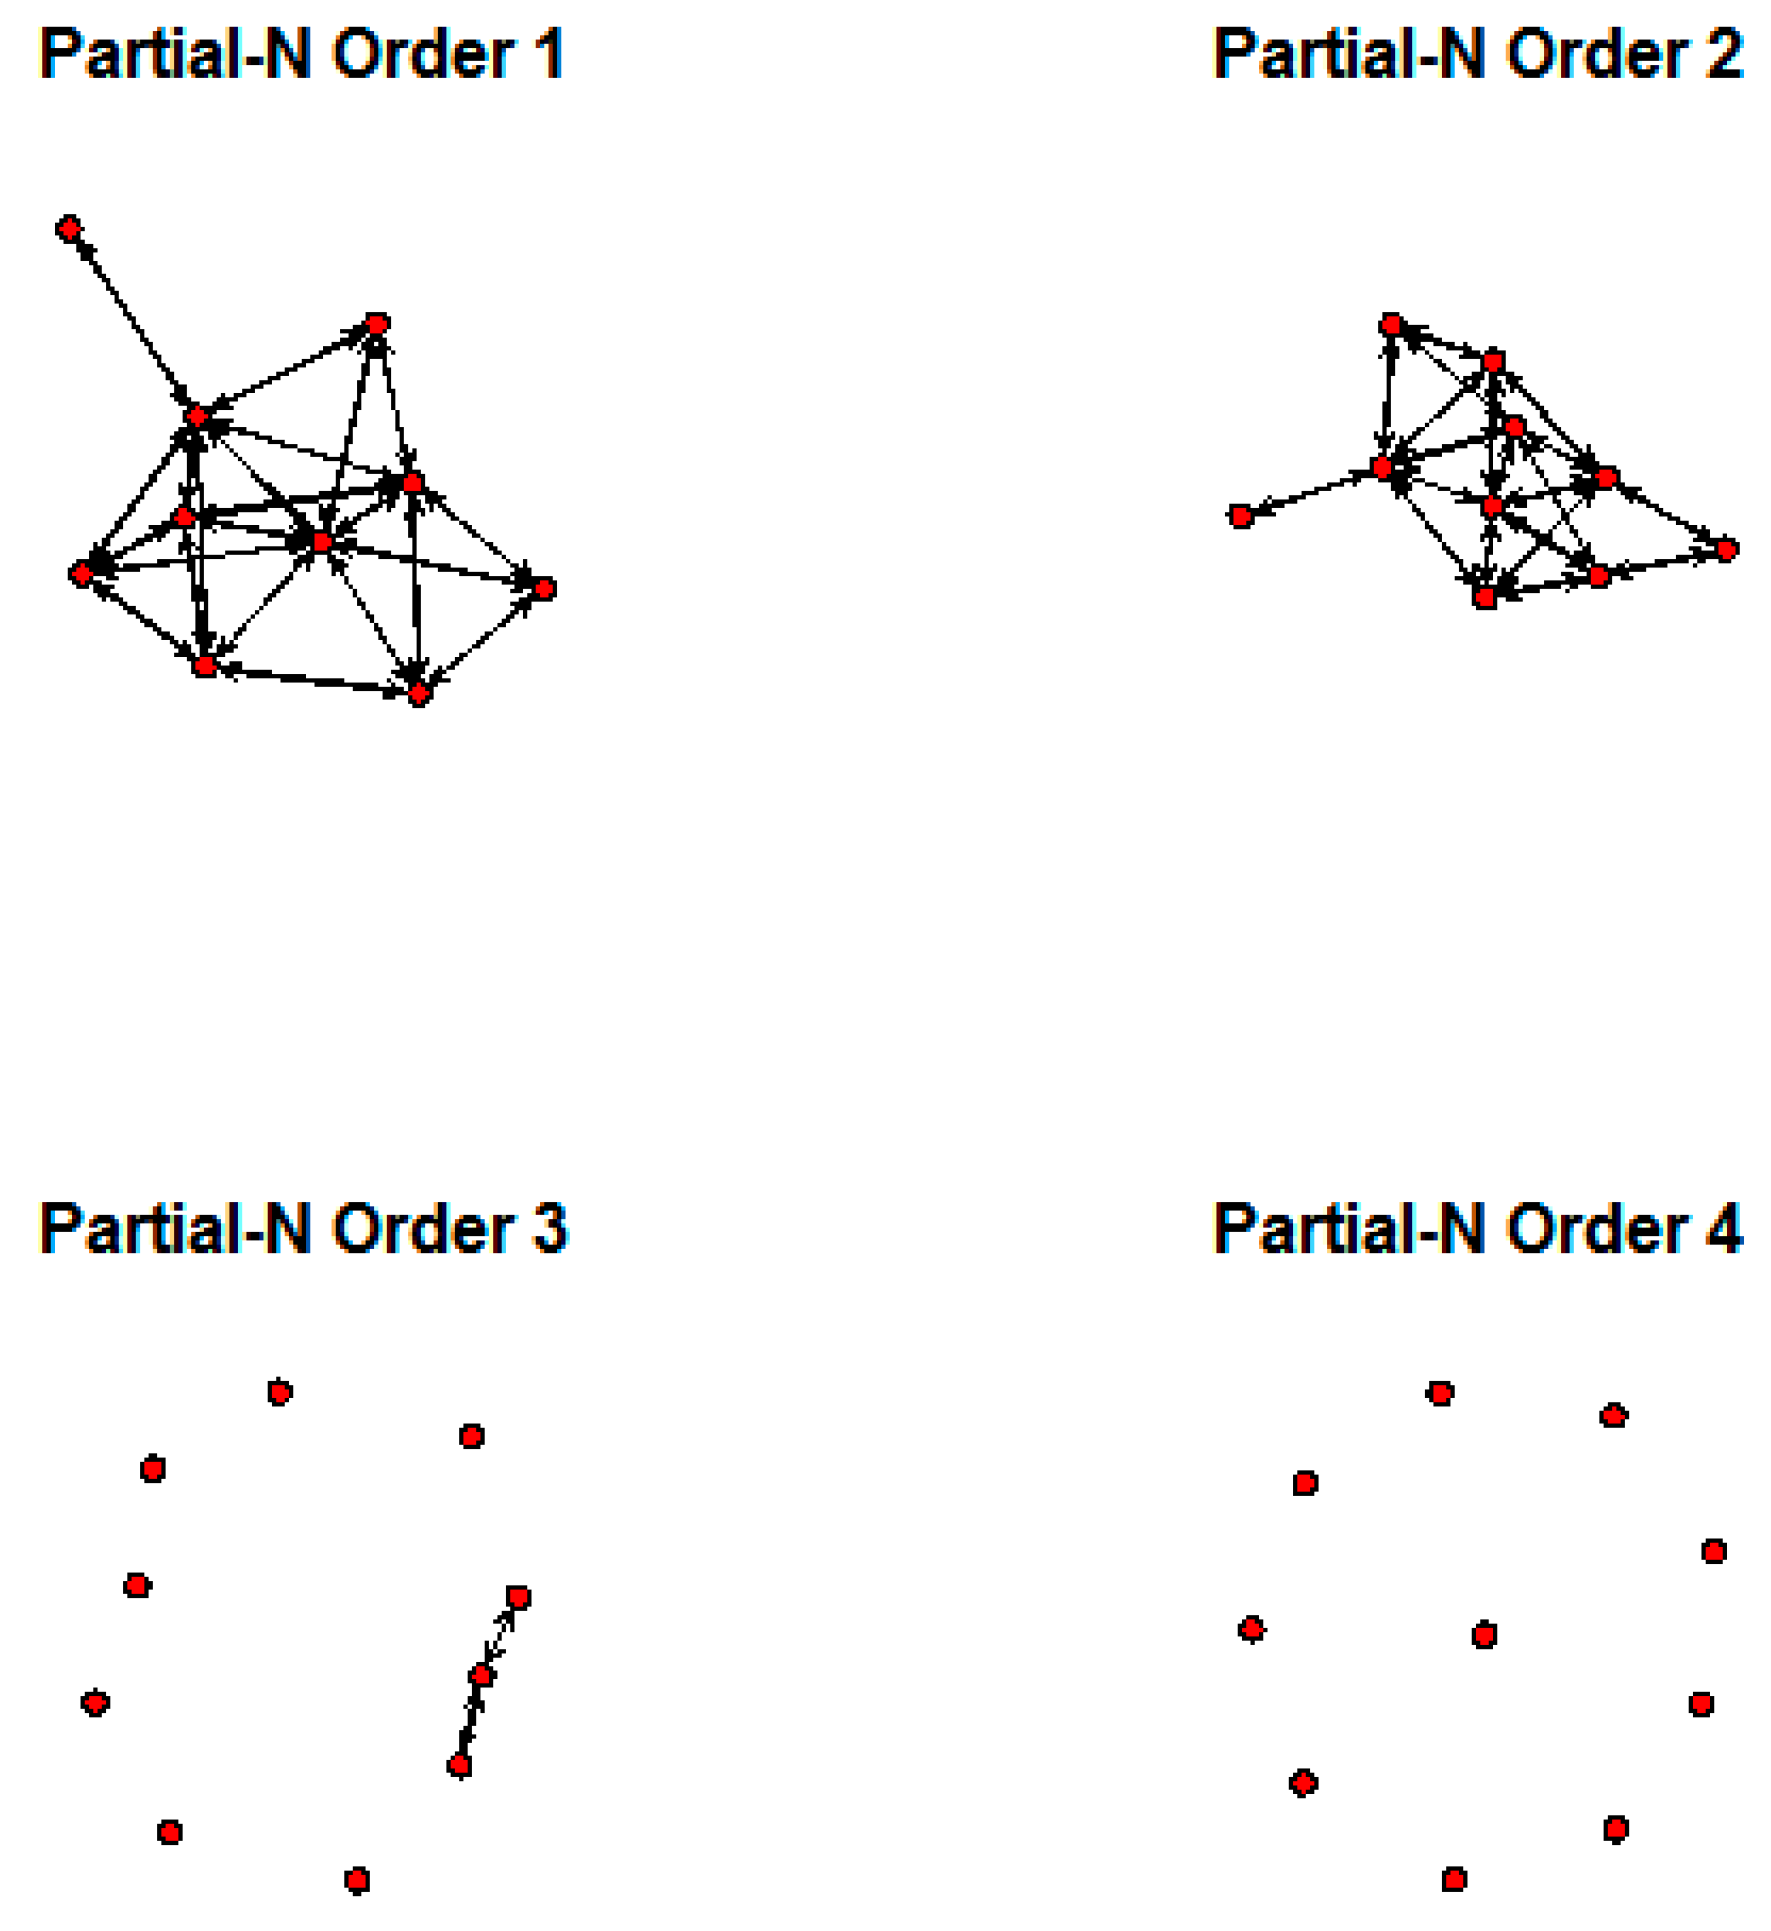
Figure 13 shows SNA graphs by partial neighborhood order from 1 to 4 using the top 10 IPC codes. This figure explains the rough relationship structure of the SNA graph. Note that the individual connections between IPC codes are not meaningful in a neighborhood-based SNA graph.
We find all IPC codes are connected within their neighborhoods with an order of 1. This means the state keeps its neighborhood when the order is 2, but most IPC codes are separated when the order is 3 or greater. Therefore, most IPC codes are connected on low orders. In other words, the major IPC codes (technologies) of Ford are associated in a similar way. To identify the SNA network structure, we show another neighborhood based an SNA graph in
Figure 14.
Figure 13.
SNA graph by partial neighborhood order.
Figure 13.
SNA graph by partial neighborhood order.
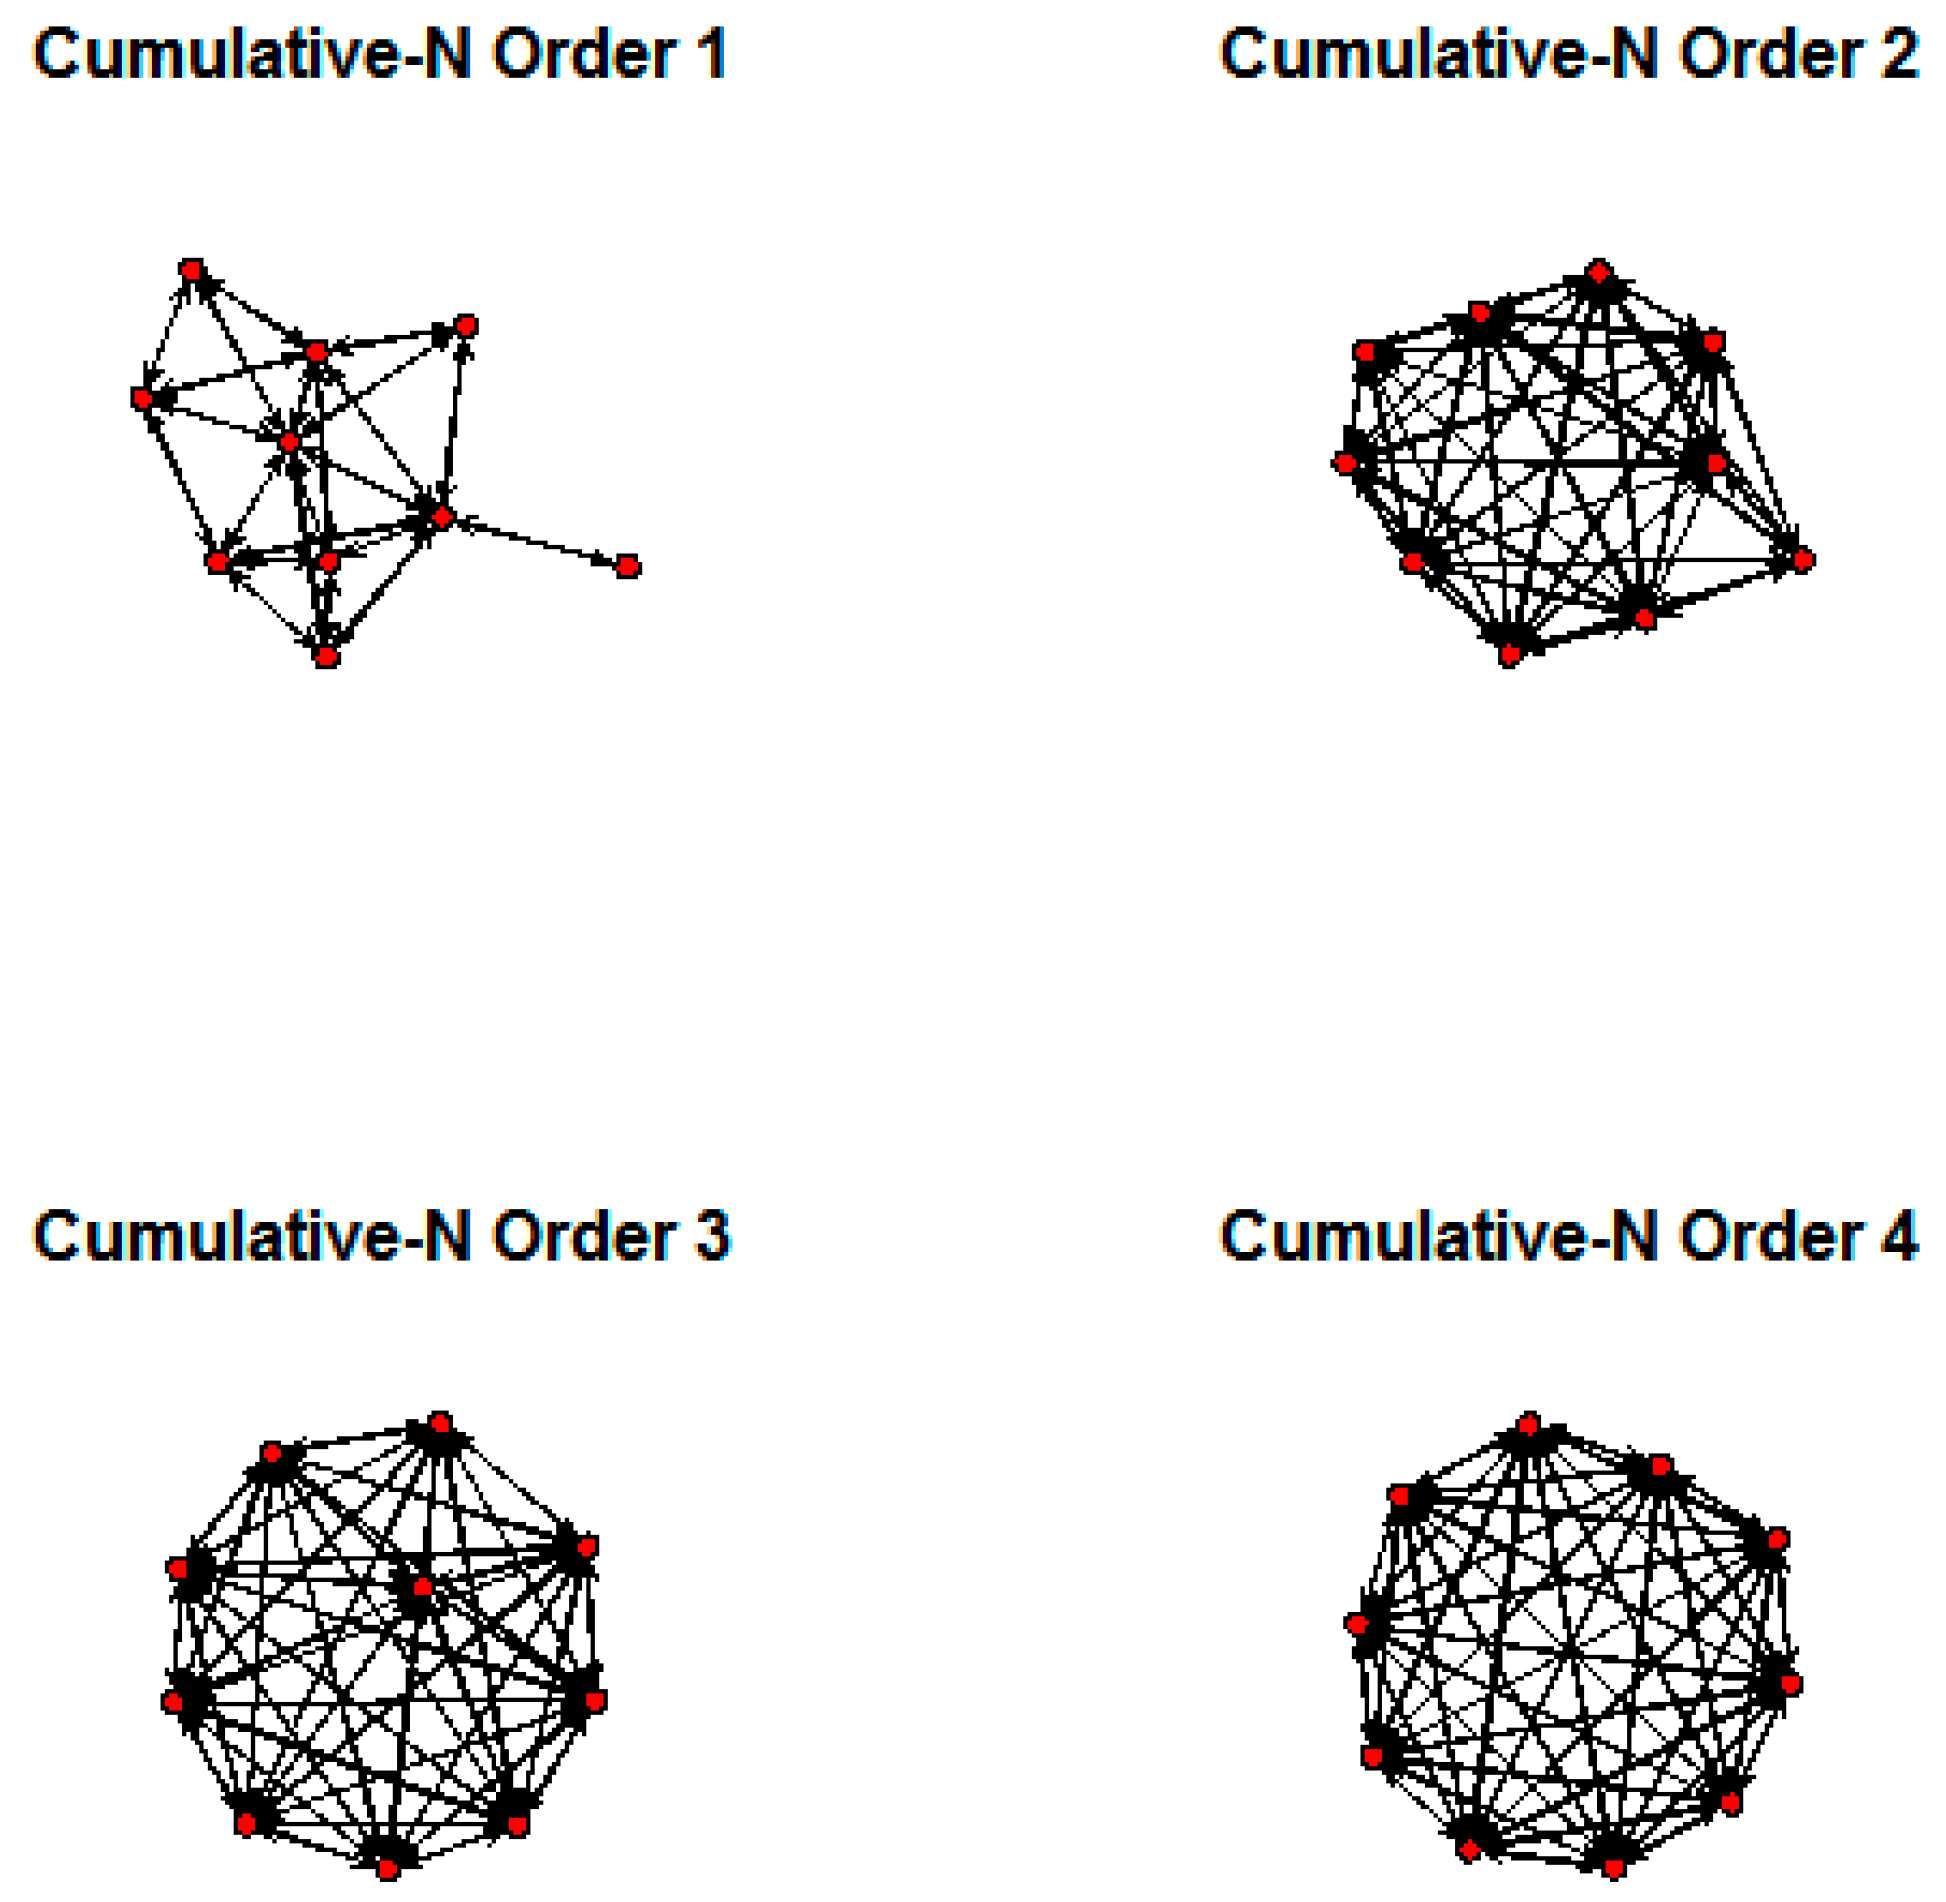
Figure 14.
SNA graph by cumulative neighborhood order.
Figure 14.
SNA graph by cumulative neighborhood order.
In contrast to the partial neighborhood SNA graph, this graph shows the cumulative structure of IPC code connections by neighborhood order. When the cumulative neighborhood order is 3, most IPC codes are fully connected to each other. From the results of
Figure 13 and
Figure 14, we find the technologies developed by Ford are closely connected. To perform a more advanced analysis in order to select sustainable technologies, we compute diverse SNA measures.
Table 2 shows the results of the centrality and distance of the 10 extracted IPC codes.
Table 2.
Centrality and distance of the top 10 IPC codes.
Table 2.
Centrality and distance of the top 10 IPC codes.
| IPC | Closeness Centrality | Betweenness Centrality | Graph Centrality | Shortest Distance | Egocentric Measure |
|---|
| B60G | 0.69 | 3.00 | 0.50 | 13 | 6 |
| B60K | 0.47 | 0.00 | 0.33 | 19 | 2 |
| B60R | 0.64 | 0.00 | 0.50 | 14 | 5 |
| B62D | 0.75 | 7.67 | 0.50 | 12 | 7 |
| F02B | 0.56 | 0.00 | 0.33 | 16 | 4 |
| F02D | 0.60 | 1.50 | 0.33 | 15 | 5 |
| F02M | 0.90 | 14.83 | 0.50 | 10 | 9 |
| F16D | 0.69 | 1.17 | 0.50 | 13 | 6 |
| F16H | 0.82 | 19.83 | 0.50 | 11 | 8 |
| H01M | 0.60 | 0.00 | 0.50 | 15 | 4 |
We can see that F02M has the largest closeness centrality. Therefore, F02M is determined to be the best candidate for a sustainable technology, based on its closeness centrality. The second best IPC code candidate is F16H, also based on its closeness centrality. In terms of betweenness centrality, F16H is the best candidate for a sustainable technology, whereas the second best IPC code candidate is F02M. Next, based on the graph centrality, F02M and F16H have the largest values, and are therefore considered as candidates for a sustainable technology. Finally, we compute the shortest distances for the 10 IPC codes. Here, F02M has the smallest distance, followed by F16H. Based on these results, we conclude that F02M is a sustainable technology. Here, F02M represents the technology for “supplying combustion engines in general with combustible mixtures or constituents thereof”. Therefore, we could base our R&D planning or technology management on this sustainable technology selection.


