
Energy Service Demand Projections and CO2 Reduction Potentials in Rural Households in 31 Chinese Provinces

Abstract
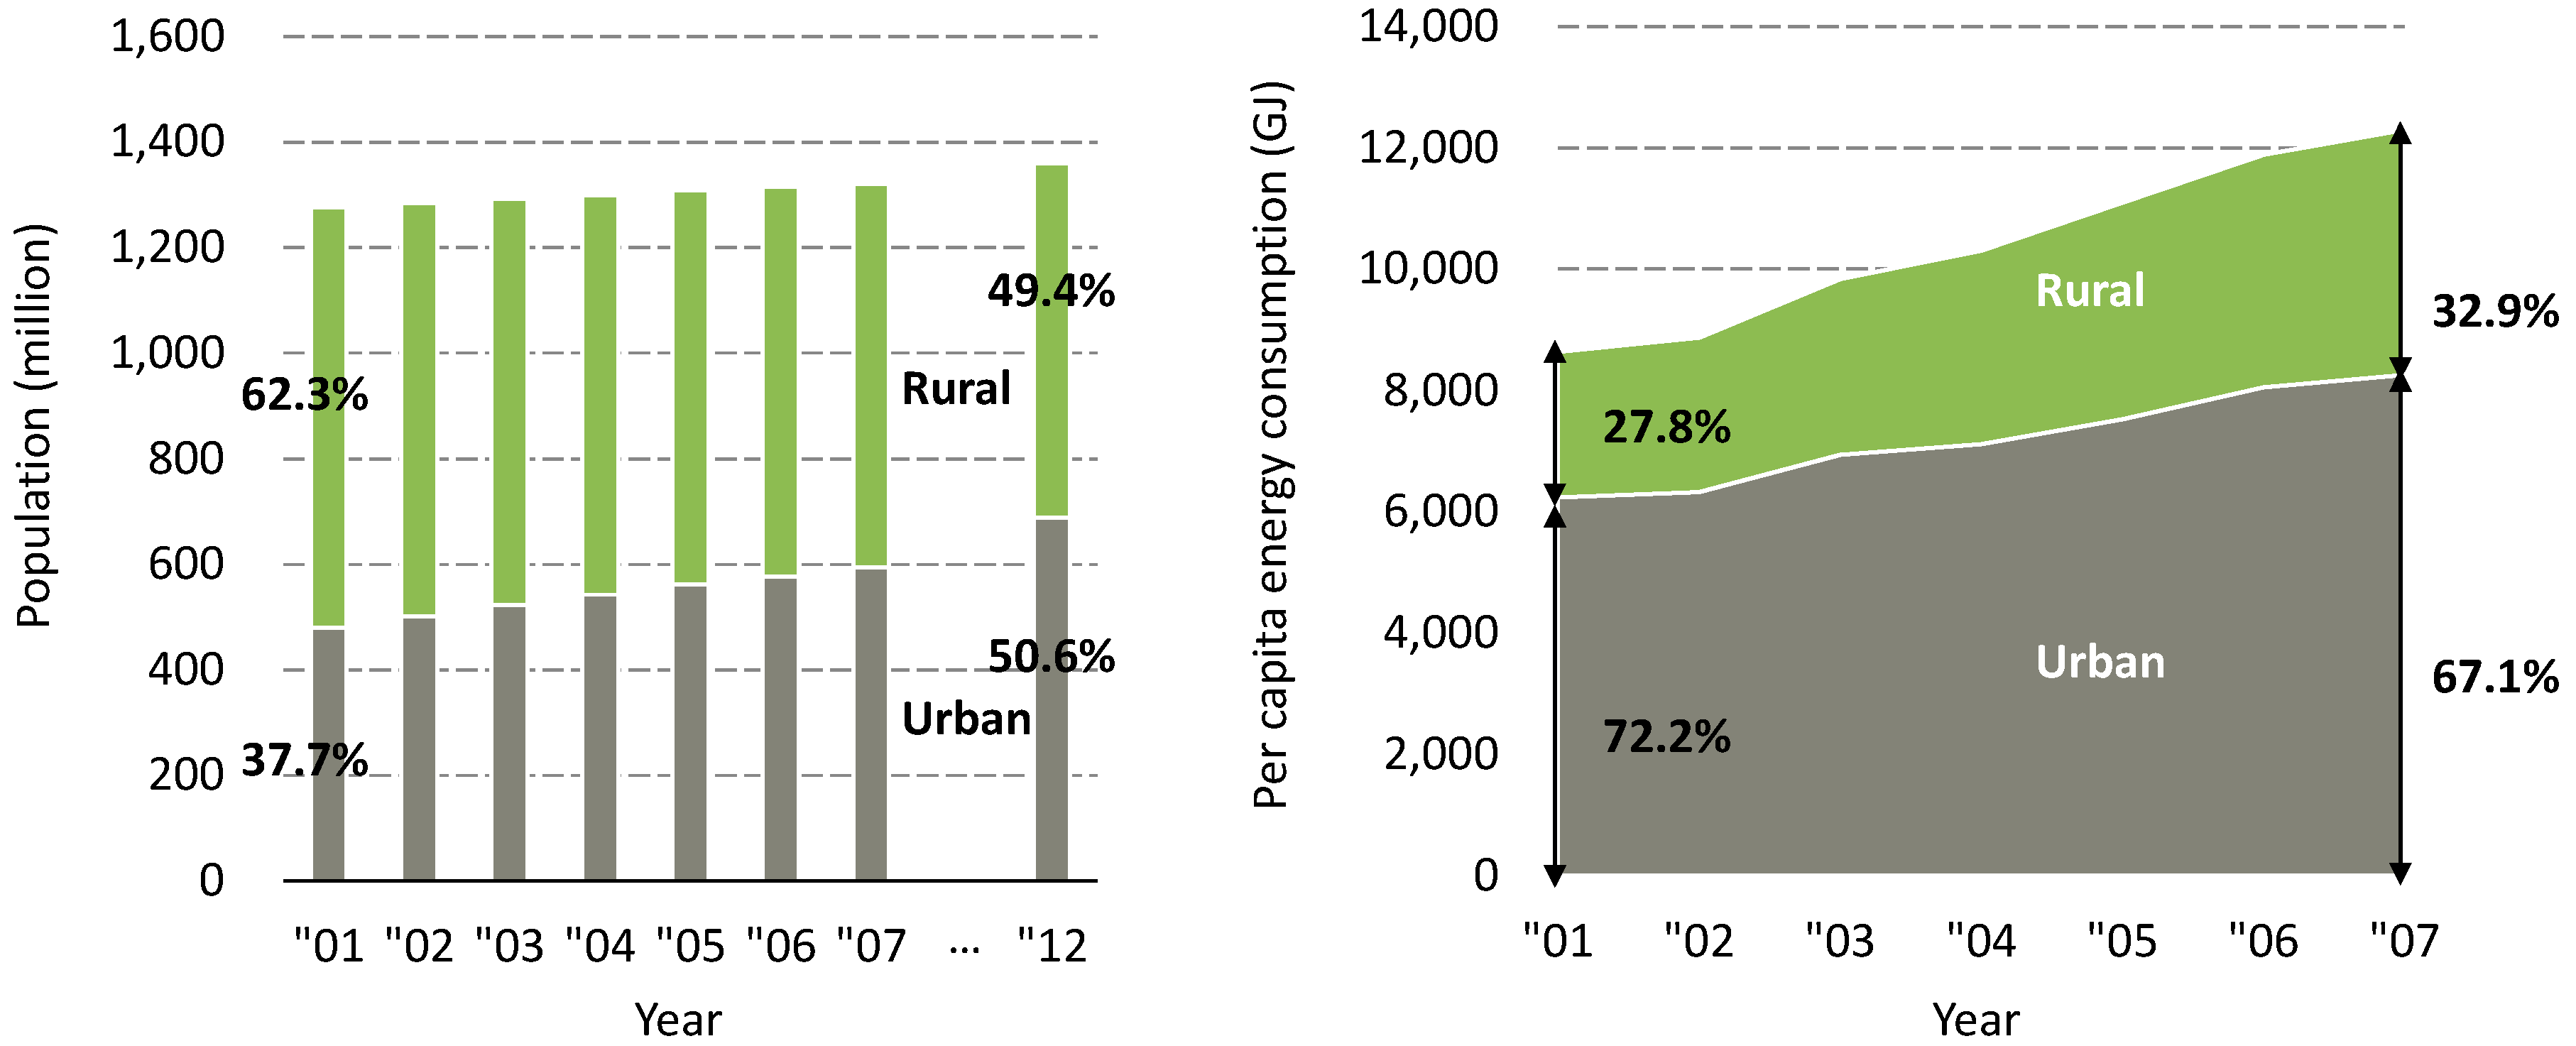
:1. Introduction


2. Estimation of Service Demand
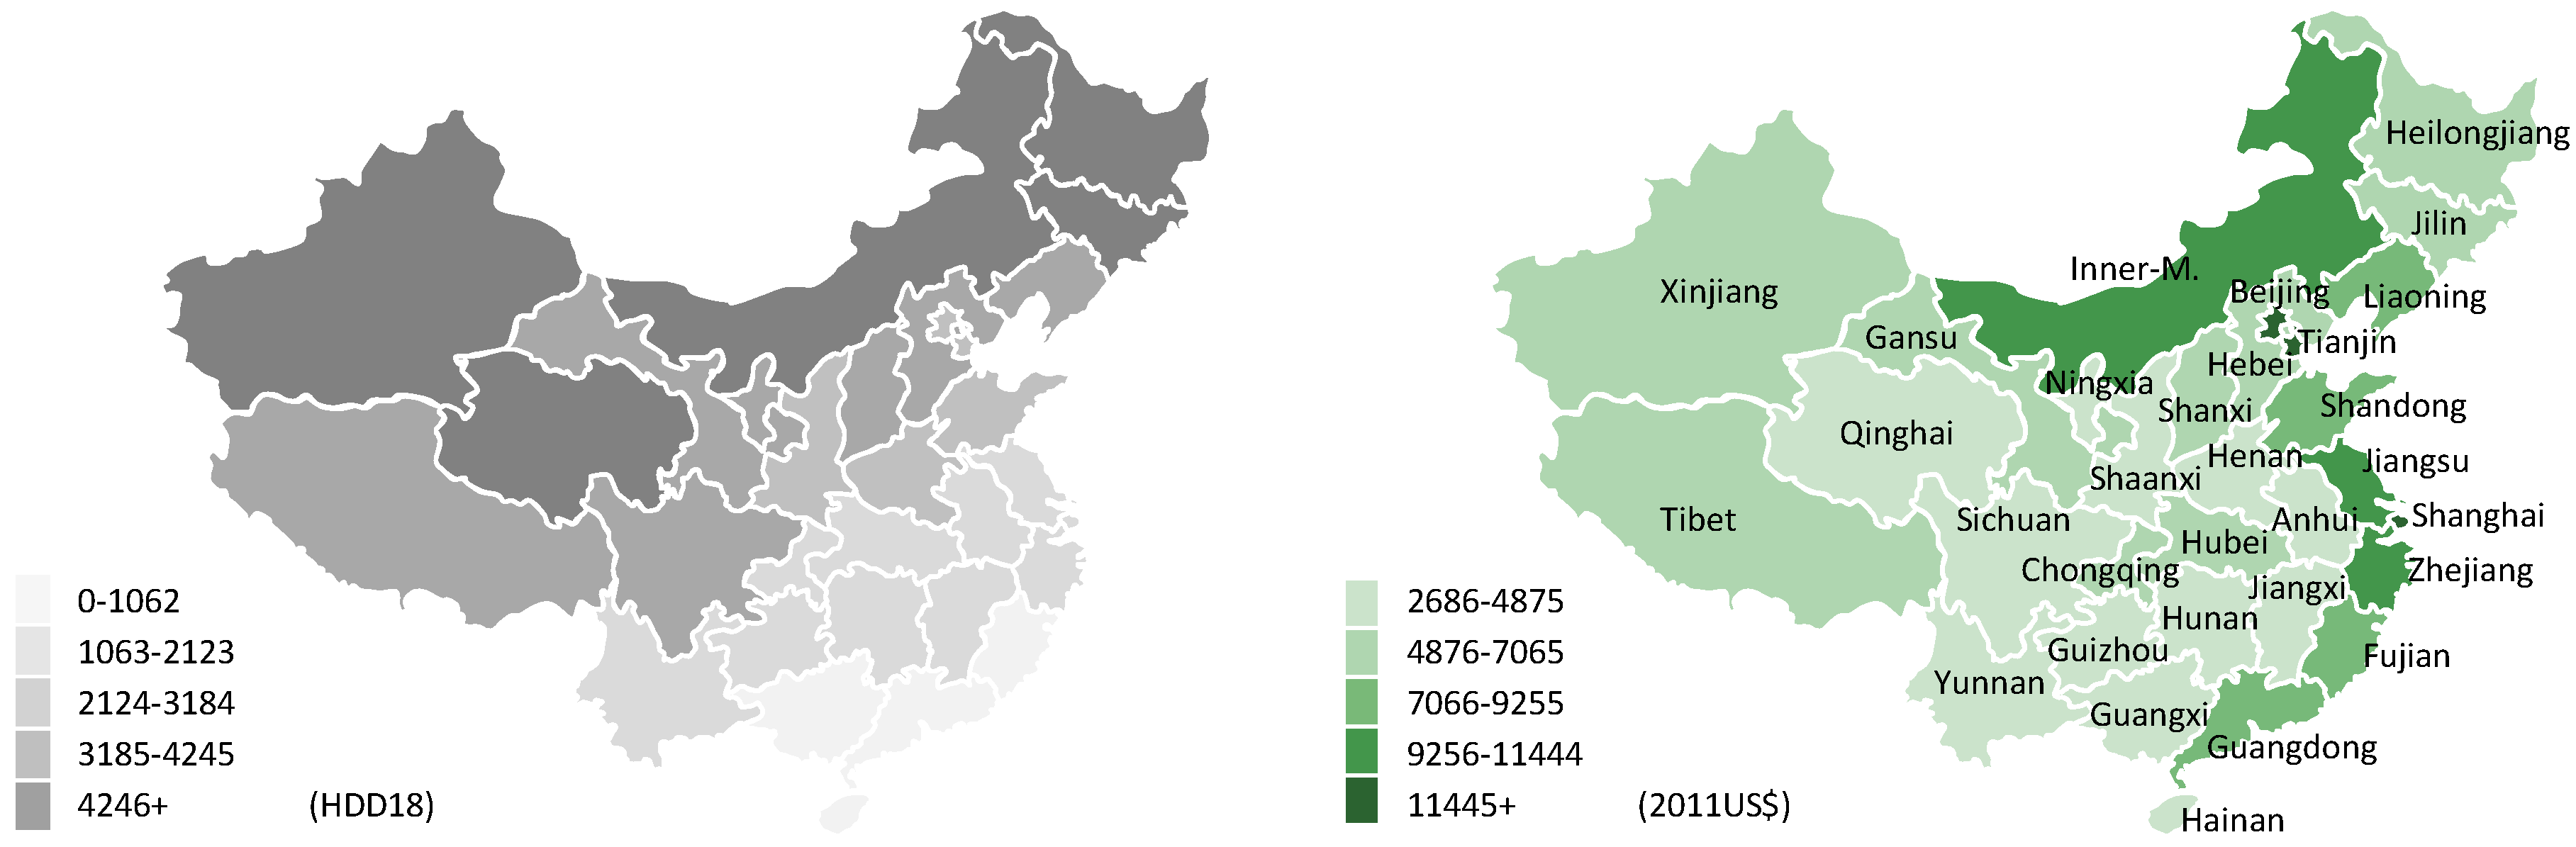
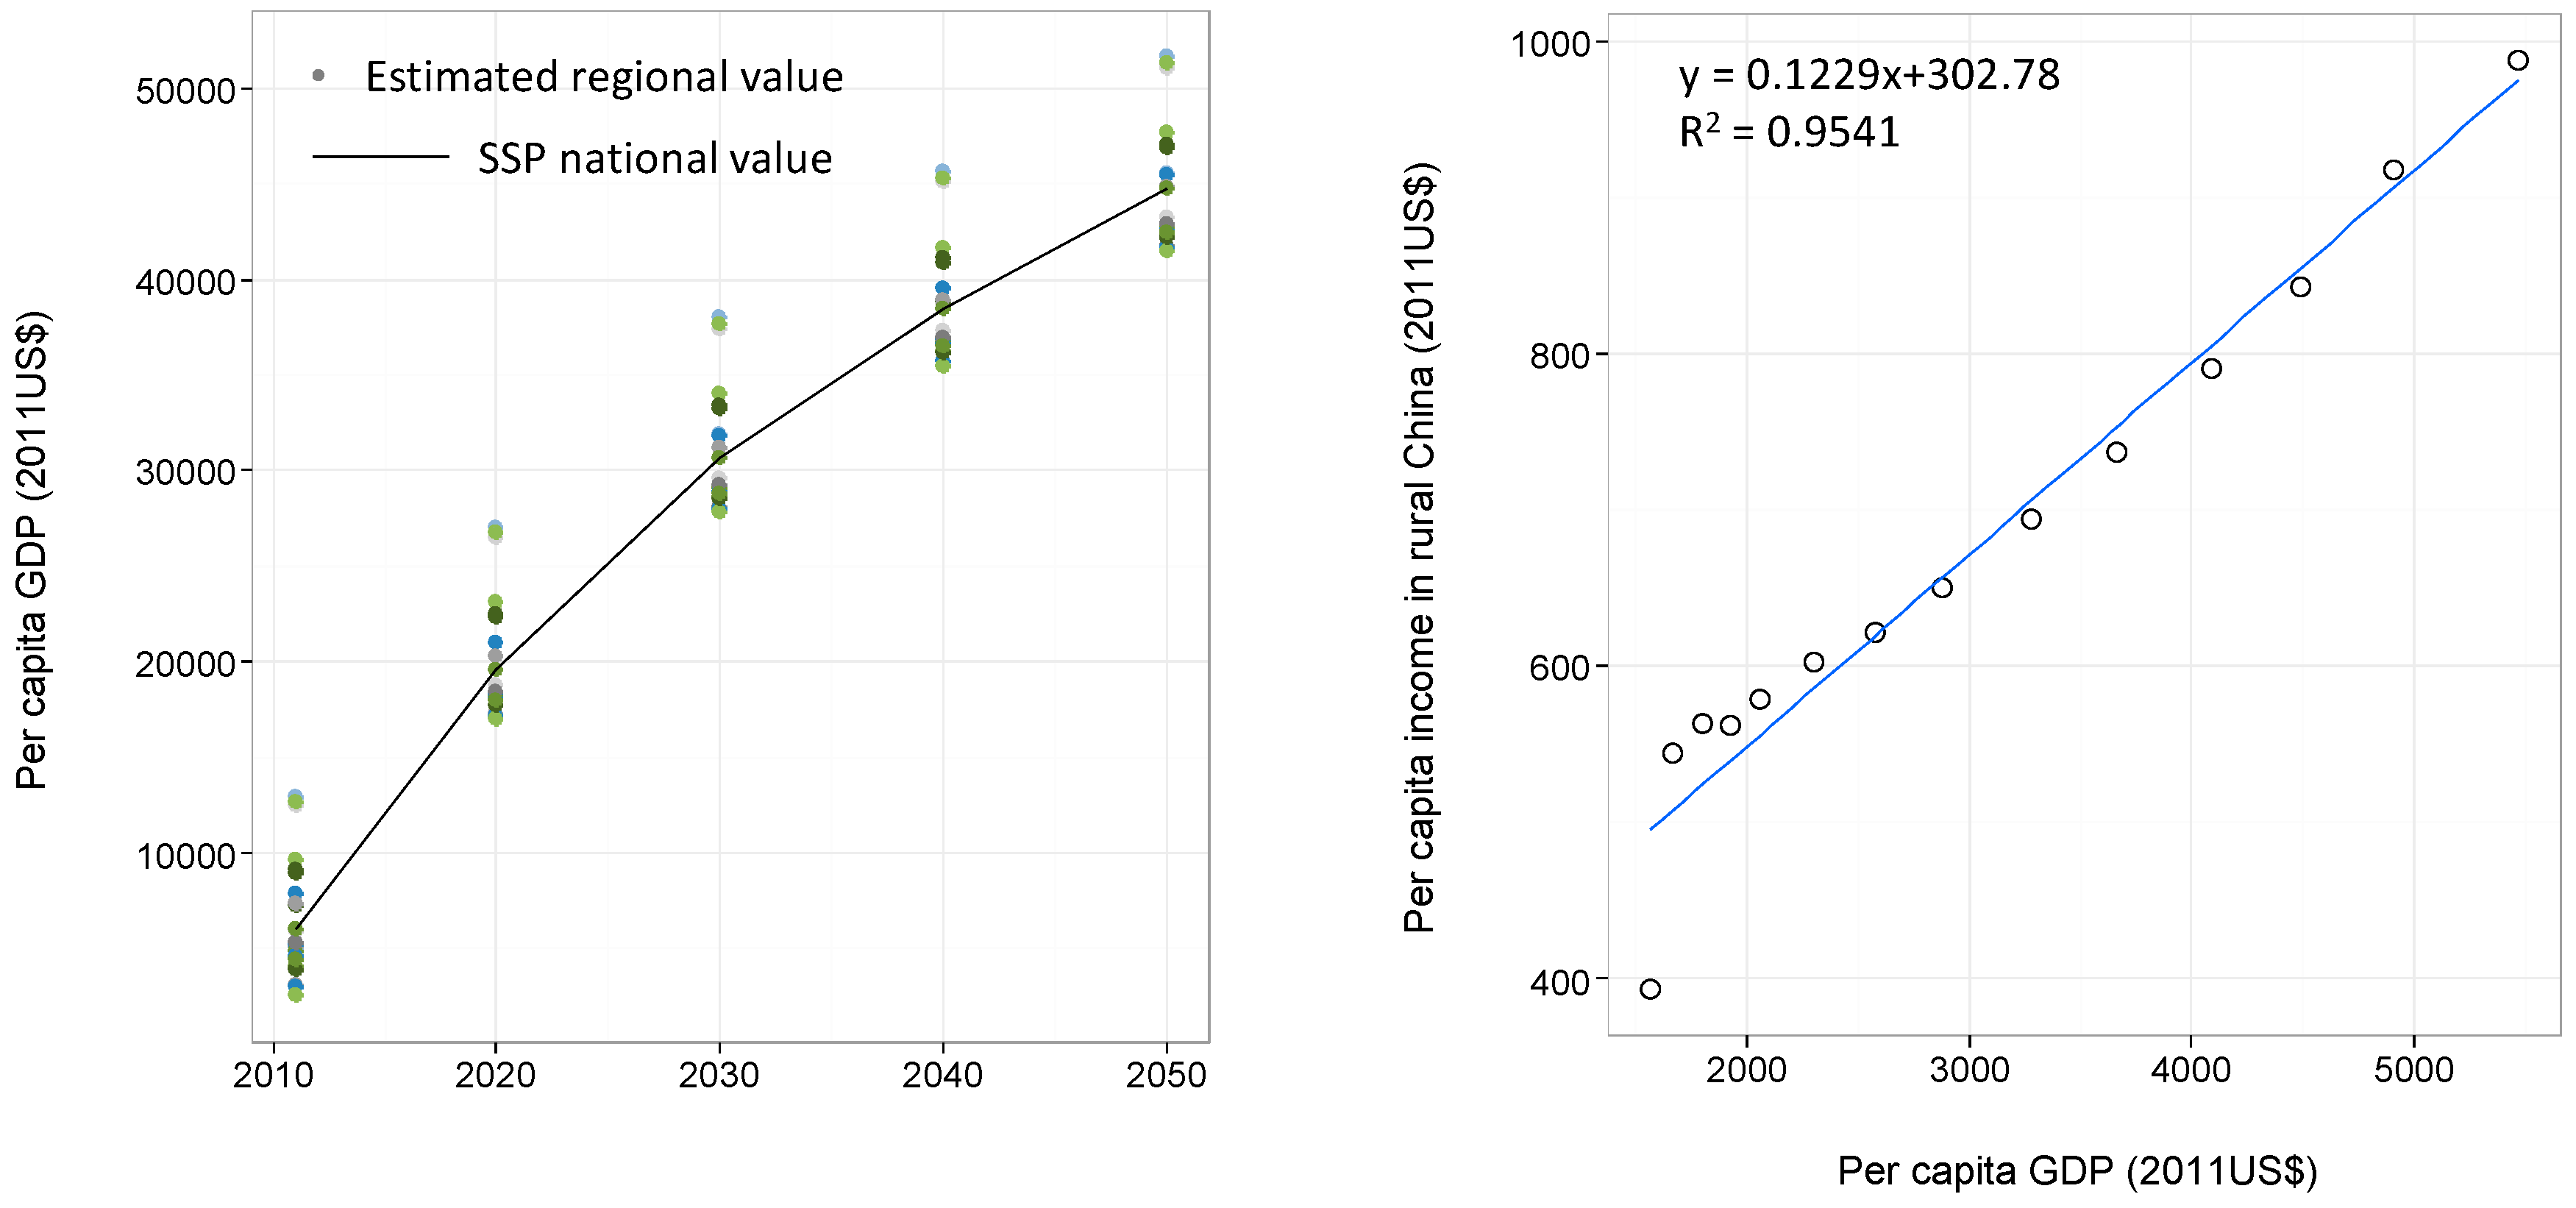
2.1. Socioeconomic Framework


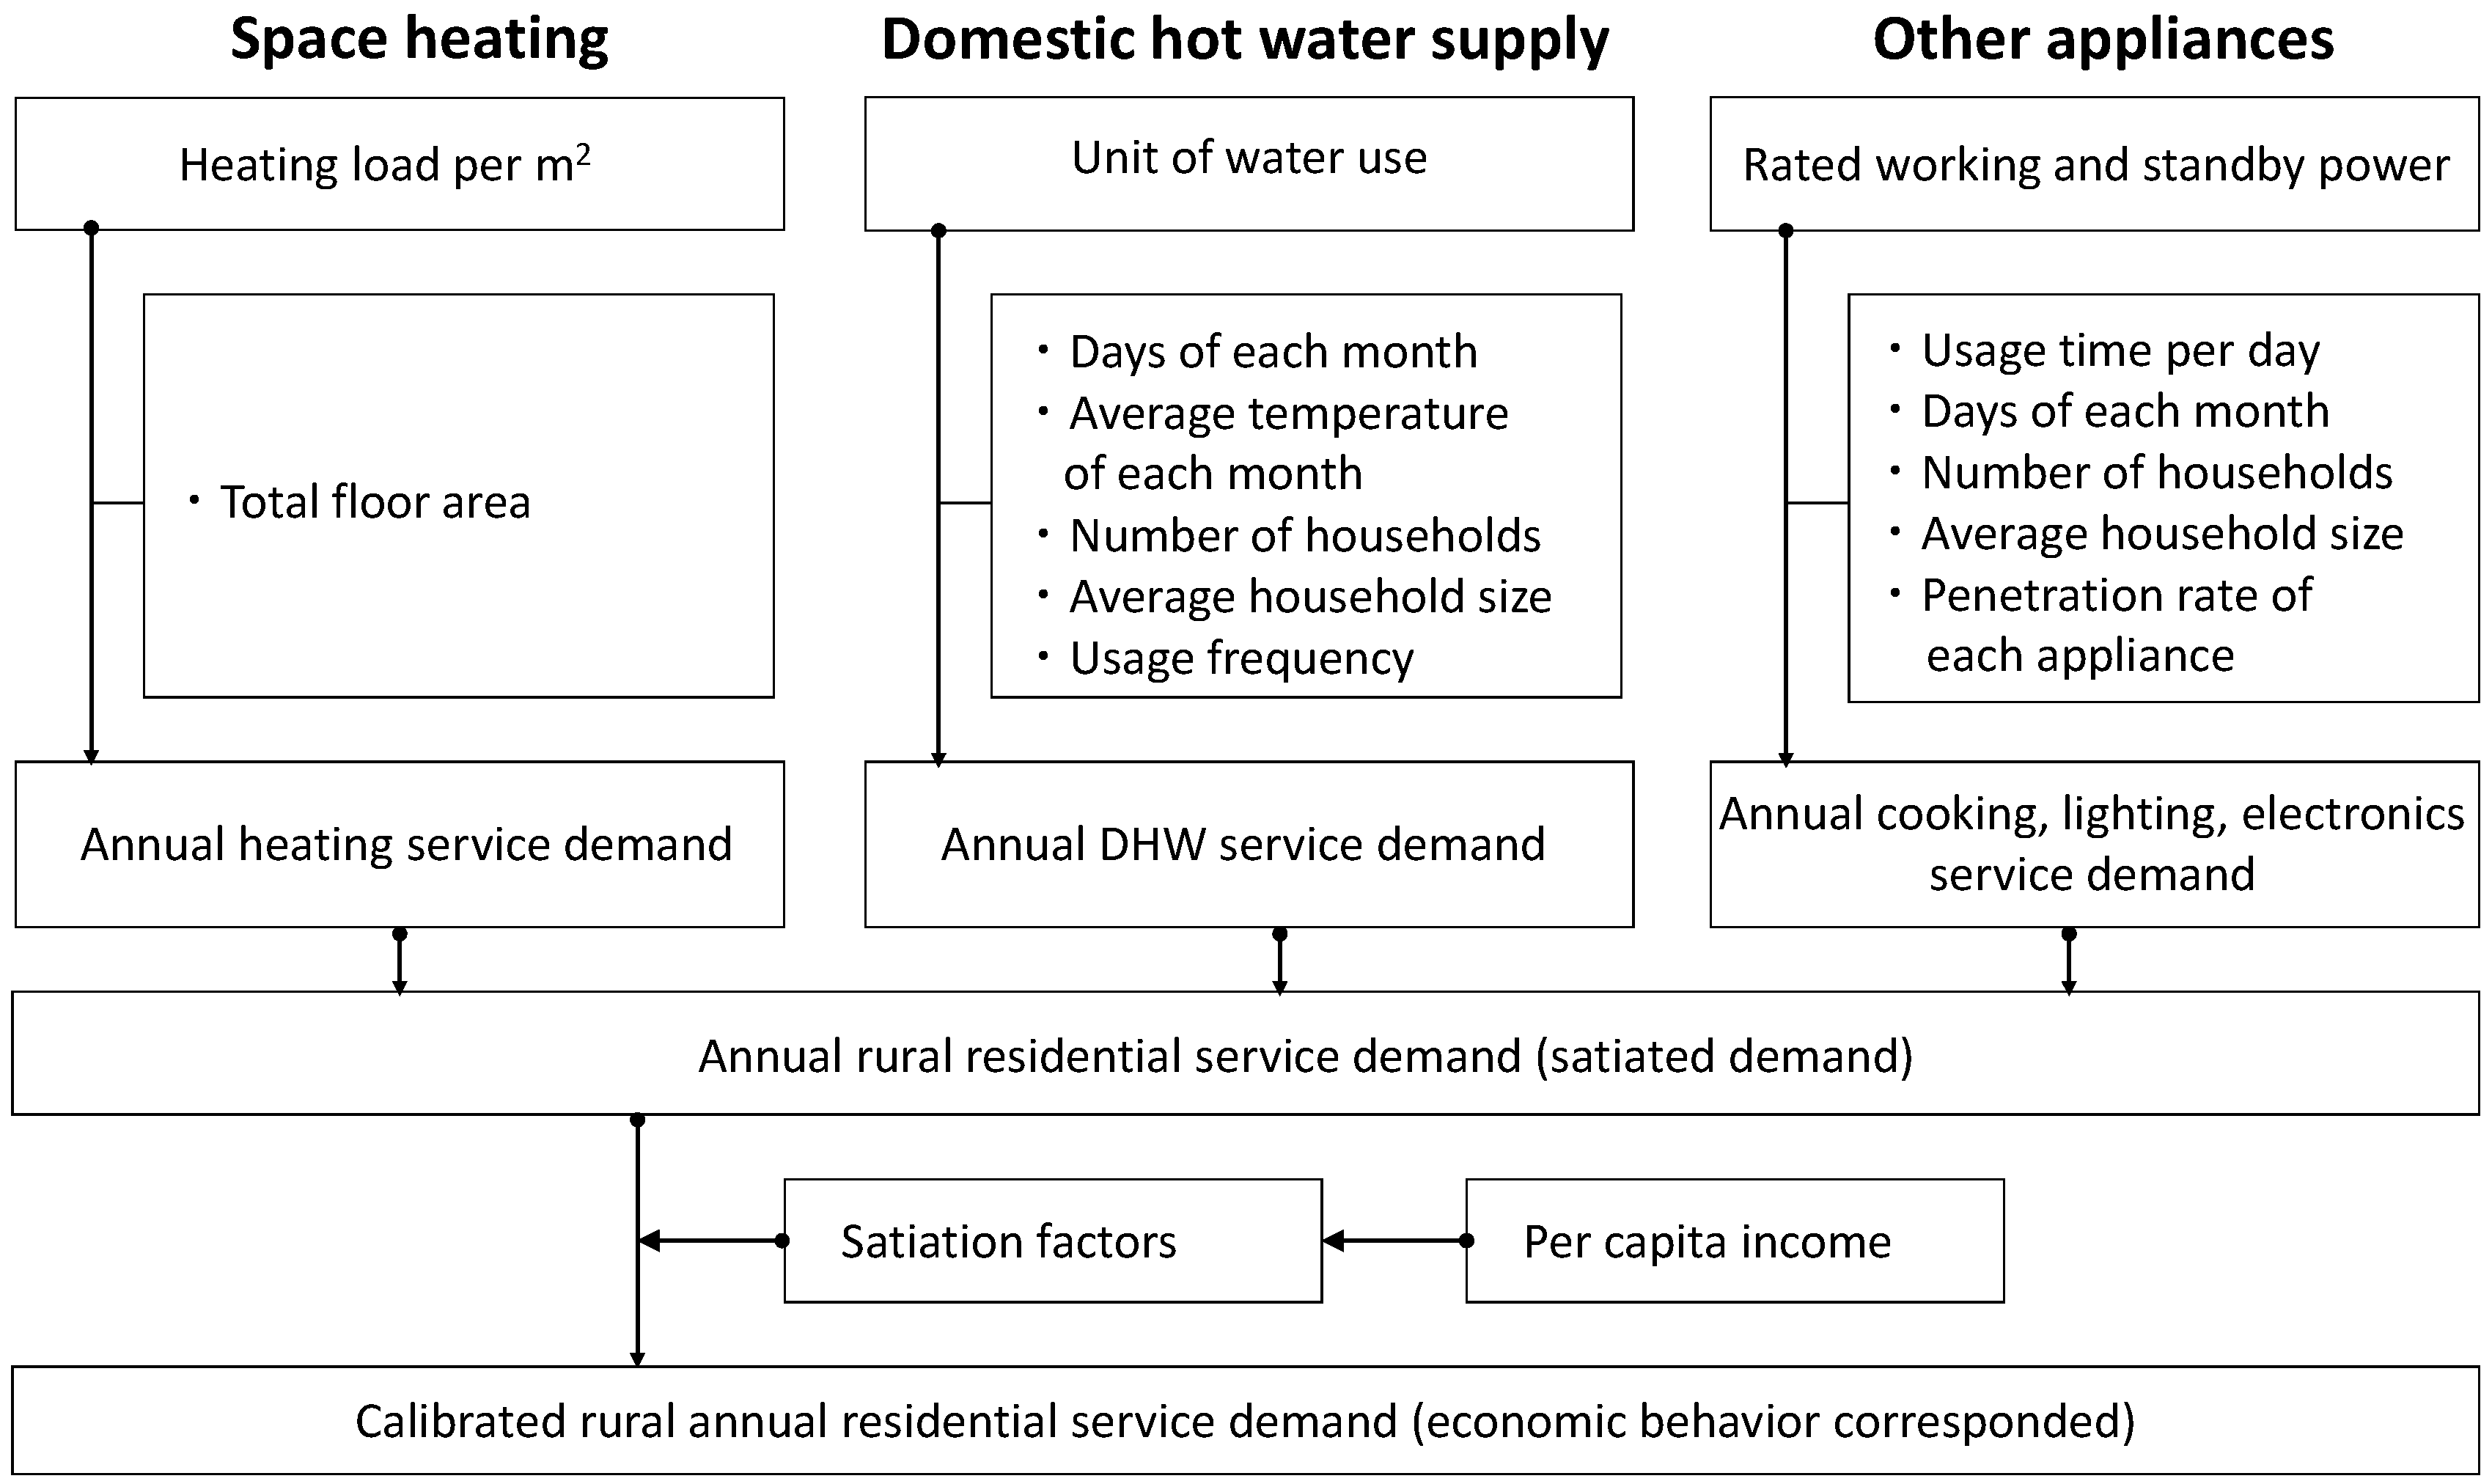
2.2. Energy Service Demand

| : | The region |
| : | The year |
| : | The annual heating service demand |
| : | The annual heating service demand (ktoe/m2) per unit (m2) |
| : | The rural residential floor area |
| : | DHW activity (face-washing, showering, and cooking) |
| : | The season (summer, winter, and others) |
| c: | The heat capacity of water ((kJ/kg·°C) |
| ρ: | The density of water |
| : | The annual DHW service demand (ktoe) |
| : | The usage of hot water per activity (L) |
| : | The population |
| : | The hot water supply temperature (universal) |
| : | The average tap water temperature (regional, seasonal) |
| : | The activity frequency per season |
| : | The service demand (ktoe) of lighting, cooking, and electronics |
| : | The annual service demand per unit (cooking range, etc.) or per m2 |
| : | The amount of service end users (total electronic units or total floor area) |

| Appliance | Working Power (W) | Standby Power (W) | Operation Time (H/Day) |
|---|---|---|---|
| Washing machine | 86.00 | 0.00 | 1.00 |
| Refrigerator | 20.802 | 0.00 | 24.00 |
| TV set (color) | 60.50 | 0.40 | 8.00 |
| Computer | 100.00 | 10.00 | 8.00 |
| Cooking range | 234.6 × HS + 253.2 | 0.00 | 6.00 |
| Lighting device | 5.00 (W/m2) | 0.00 | 6.00 |
2.3. Model Calibration
| : | Energy service, e.g., heating, hot water, cooking, etc. |
| : | A logistic model parameter of energy services sv |
| : | The satiation factor |
| : | Per capita income |
| sv: | Energy service, e.g., heating, hot water, cooking, etc. |
| t0: | The base year (2010) |
| : | The annual energy consumption (urban) from statistics (NBSC, 2011) |
| : | The estimated annual energy consumption (urban) |
| : | The calibrated annual energy service demand (rural) |
| : | The estimated annual energy service demand (rural) |
2.4. AIM/Enduse
| Device | Efficiency | ||
|---|---|---|---|
| EXT | NEW | BAT | |
| Coal stove (heating) | 0.39 | - | 0.80 |
| Refrigerator | 0.63 | 1.00 | 1.43 |
2.5. Scenario Setting
| Scenario | Definition |
|---|---|
| Fix (FIX) | Technology efficiency fixed at the 2010 level |
| Cost-effective selection (CES) | Efficient technologies naturally penetrated in the future market |
| Share of non-commercial energy not to surpass the 2010 level | |
| Share of renewable energy not to surpass the IEA’s 450 scenario |
3. Results and Discussion
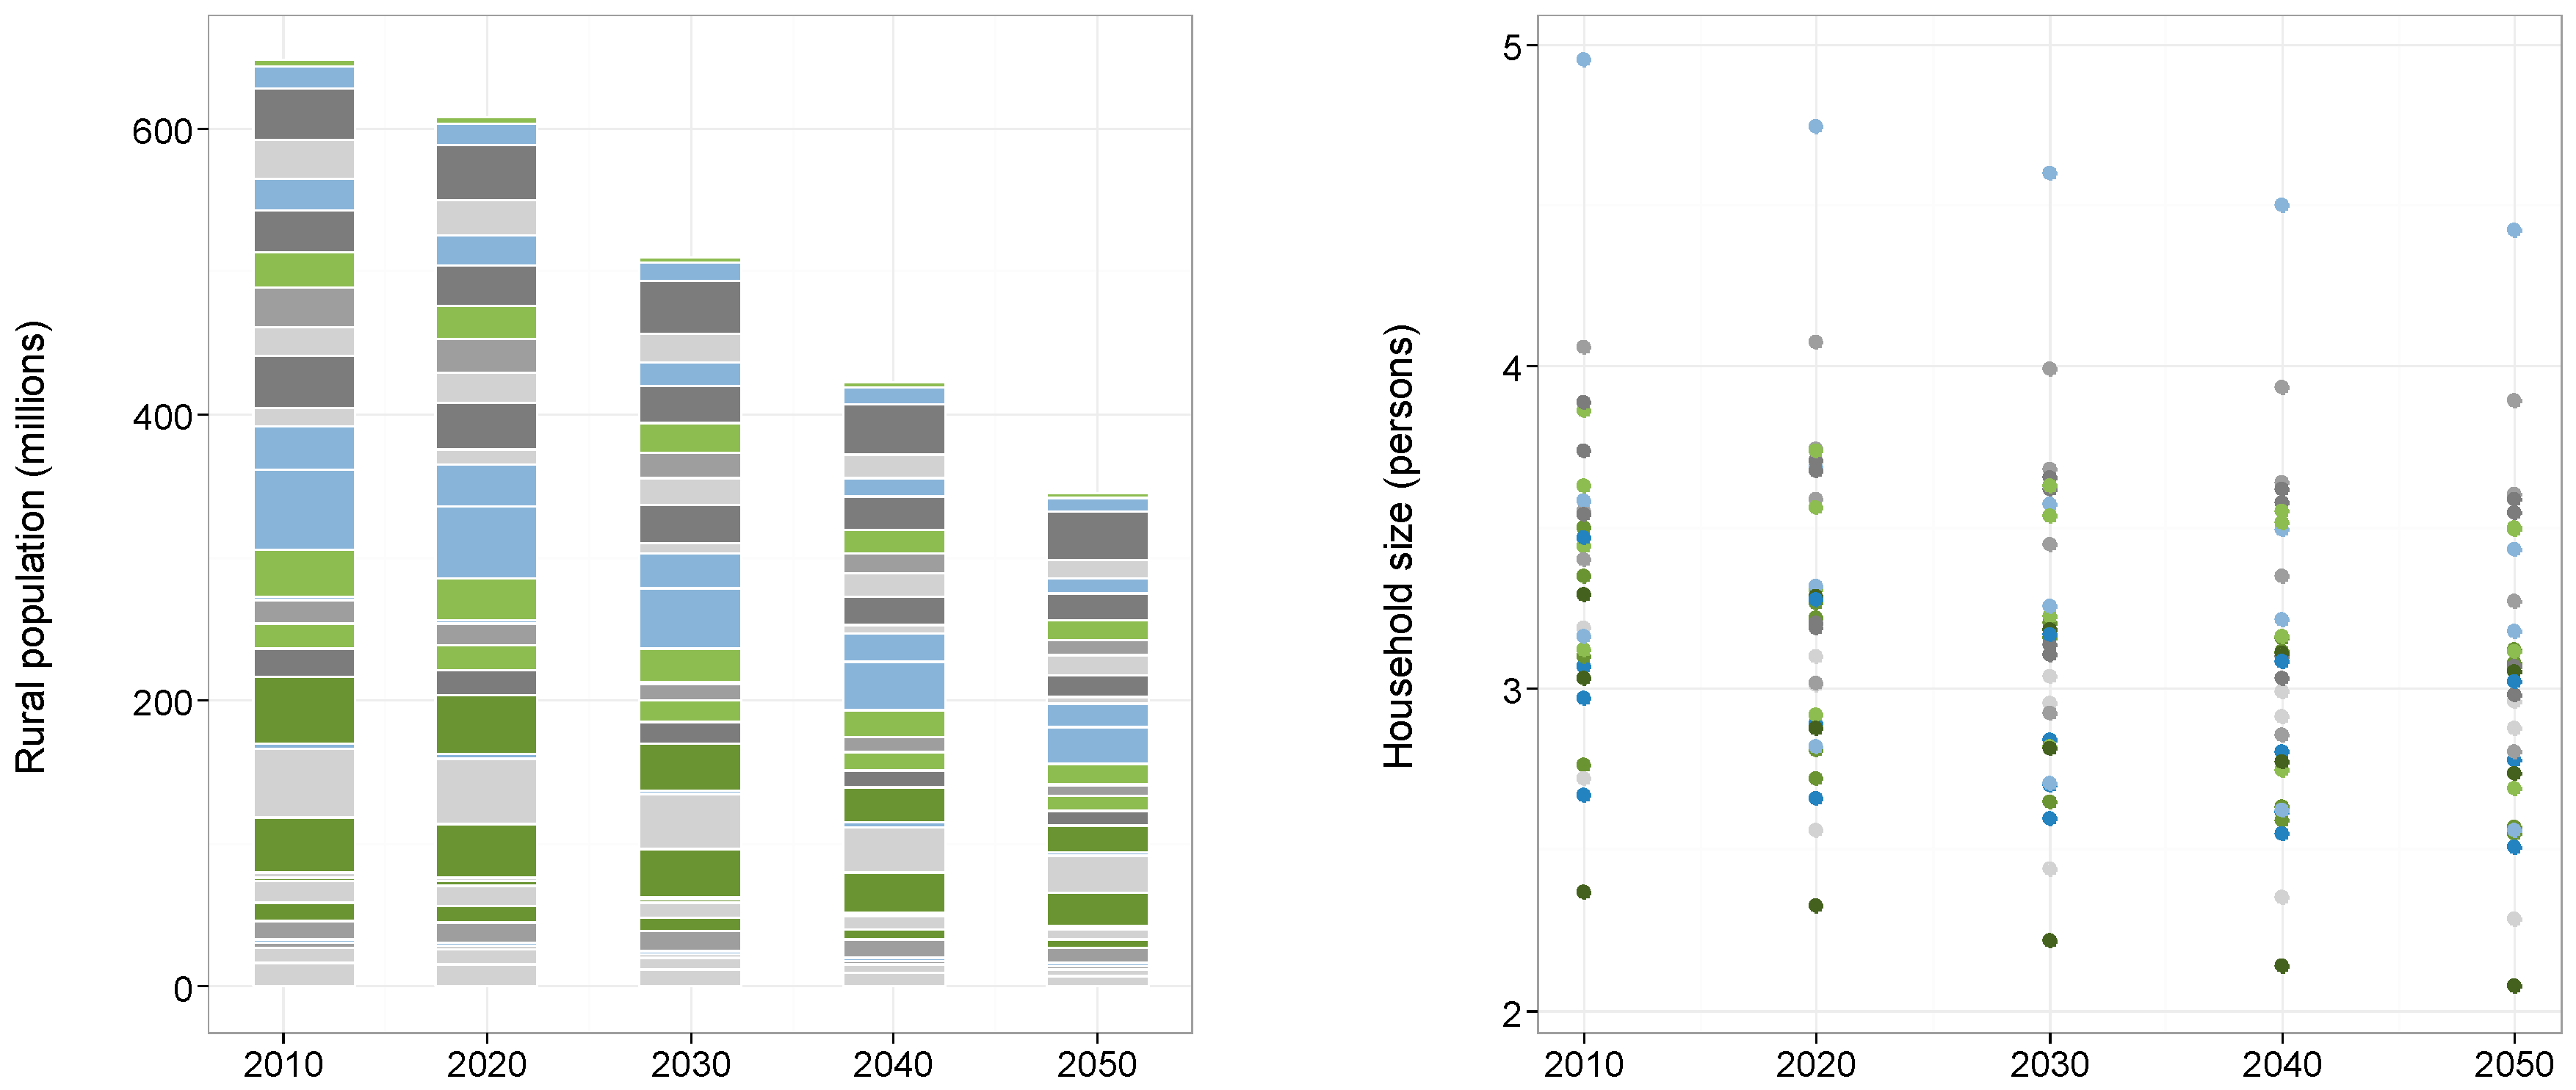
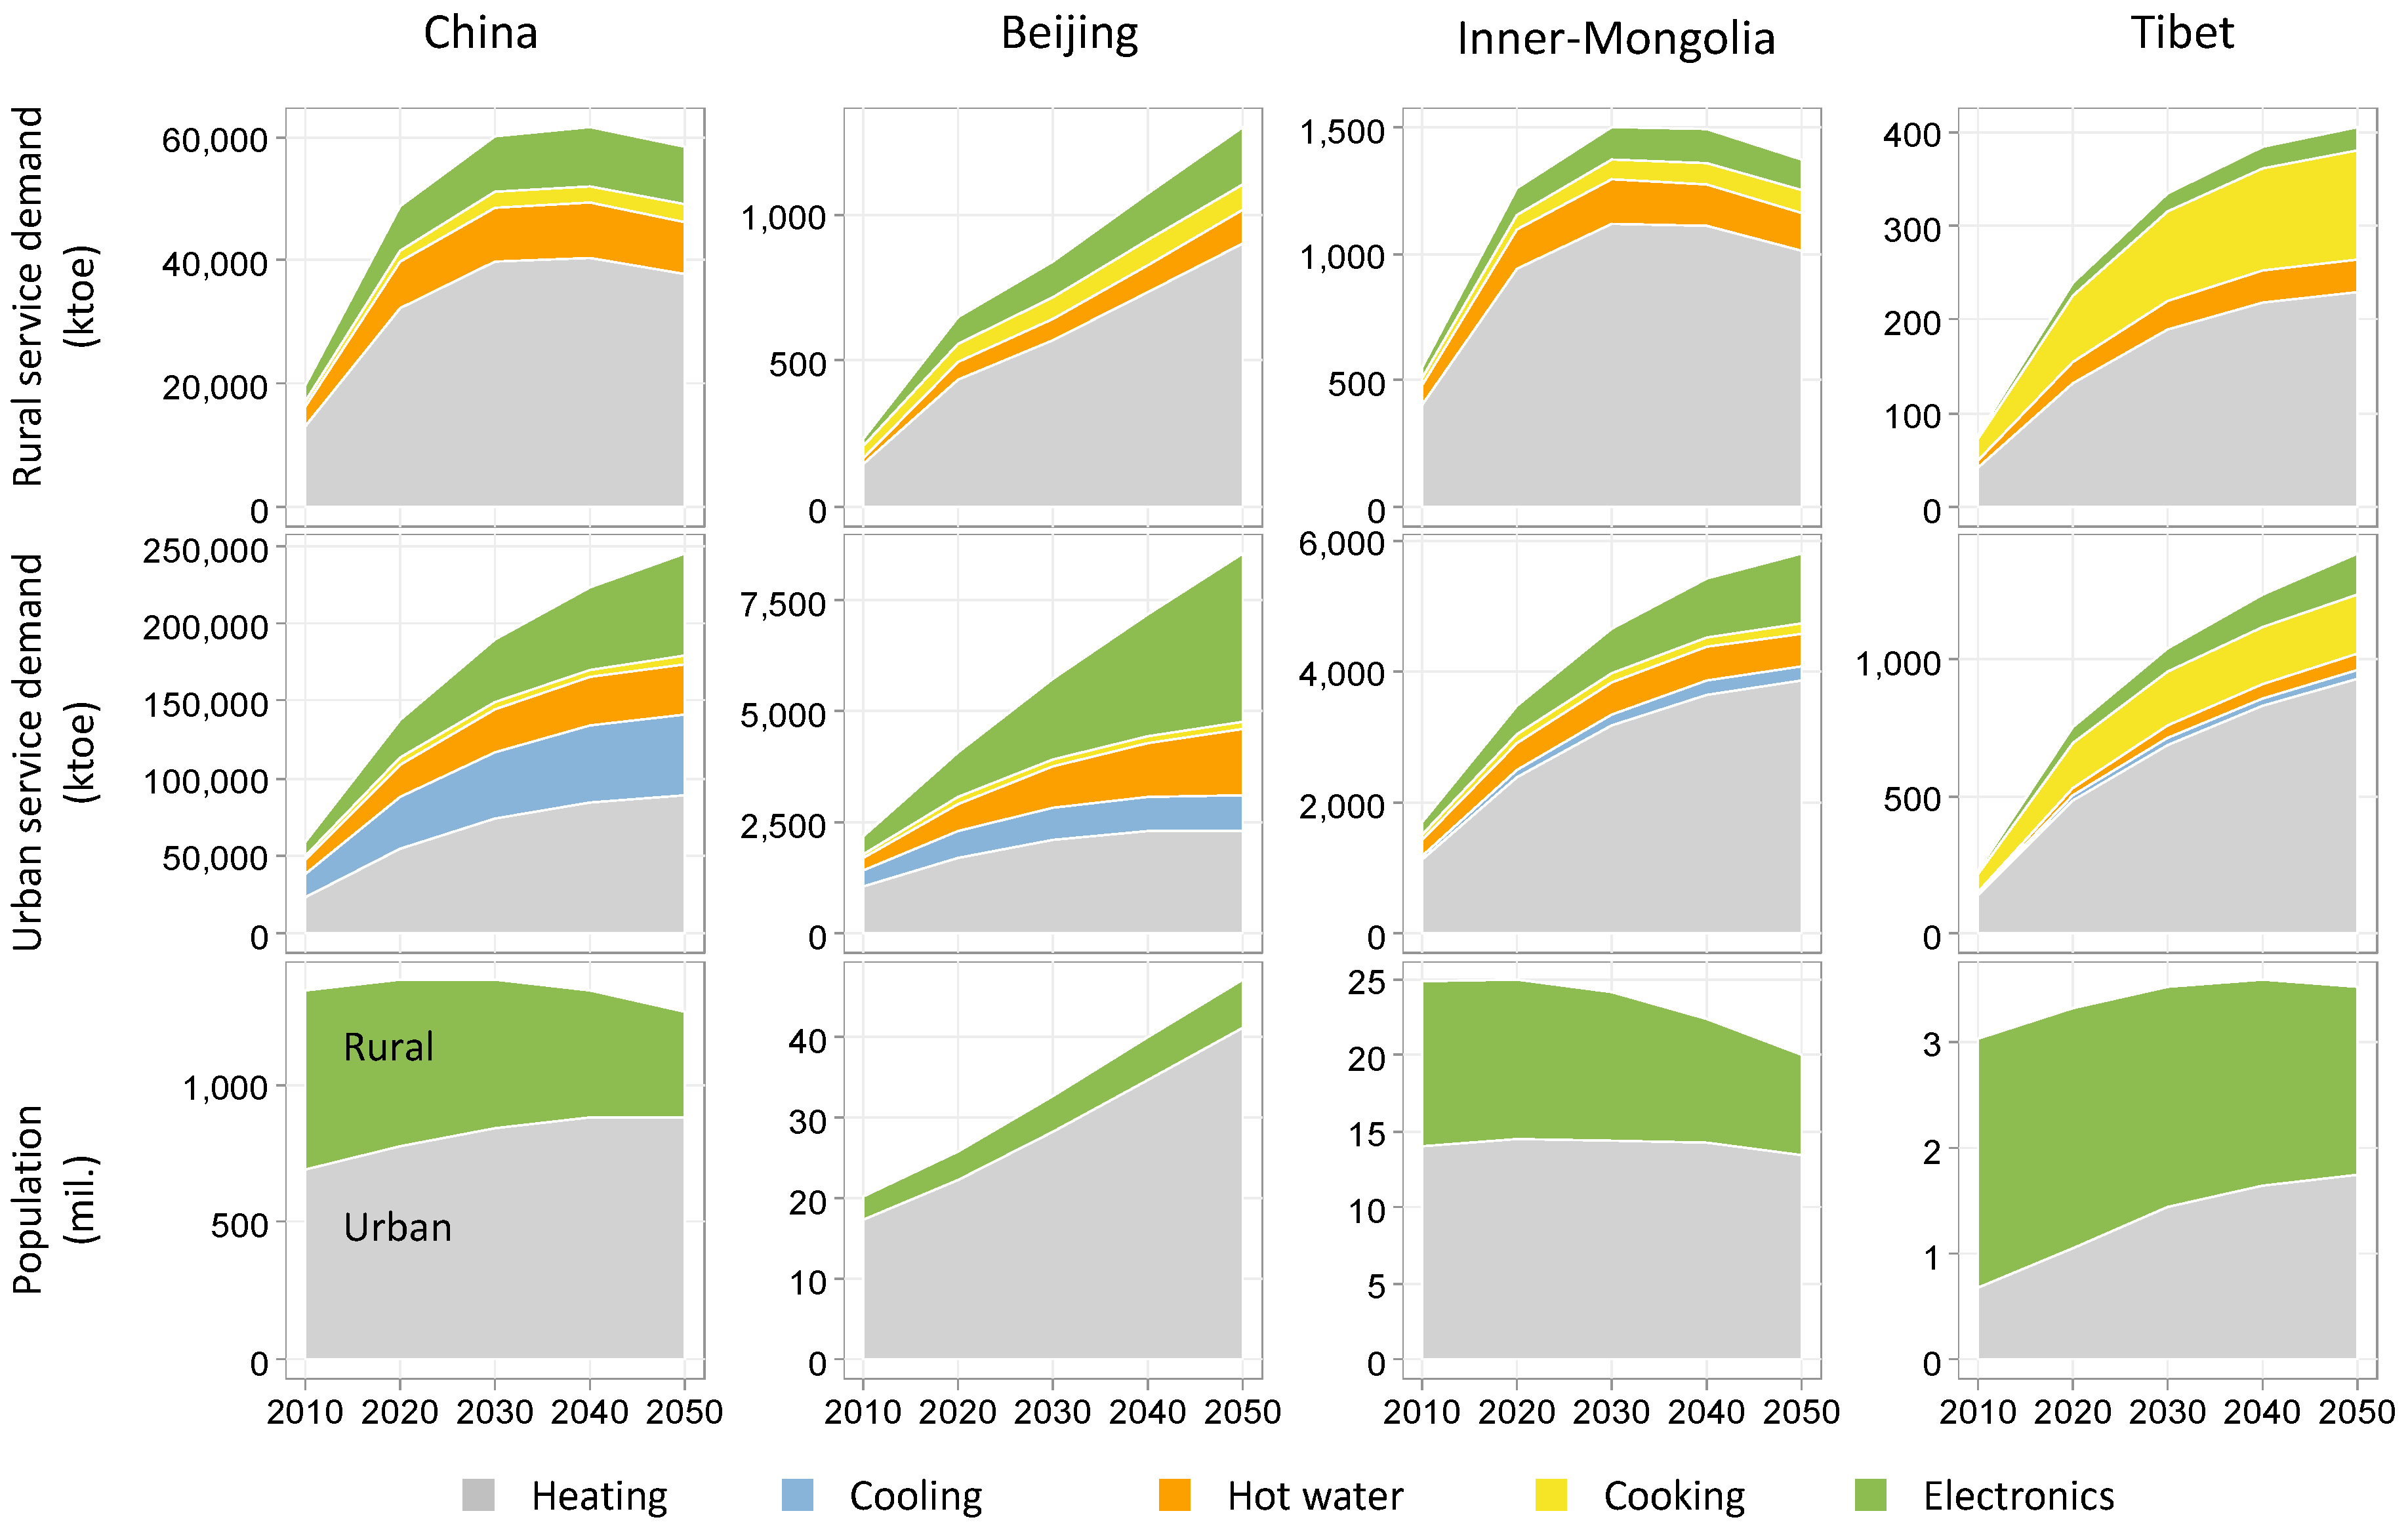
3.1. Energy Service Demands

3.2. Energy Consumption and CO2 Emission

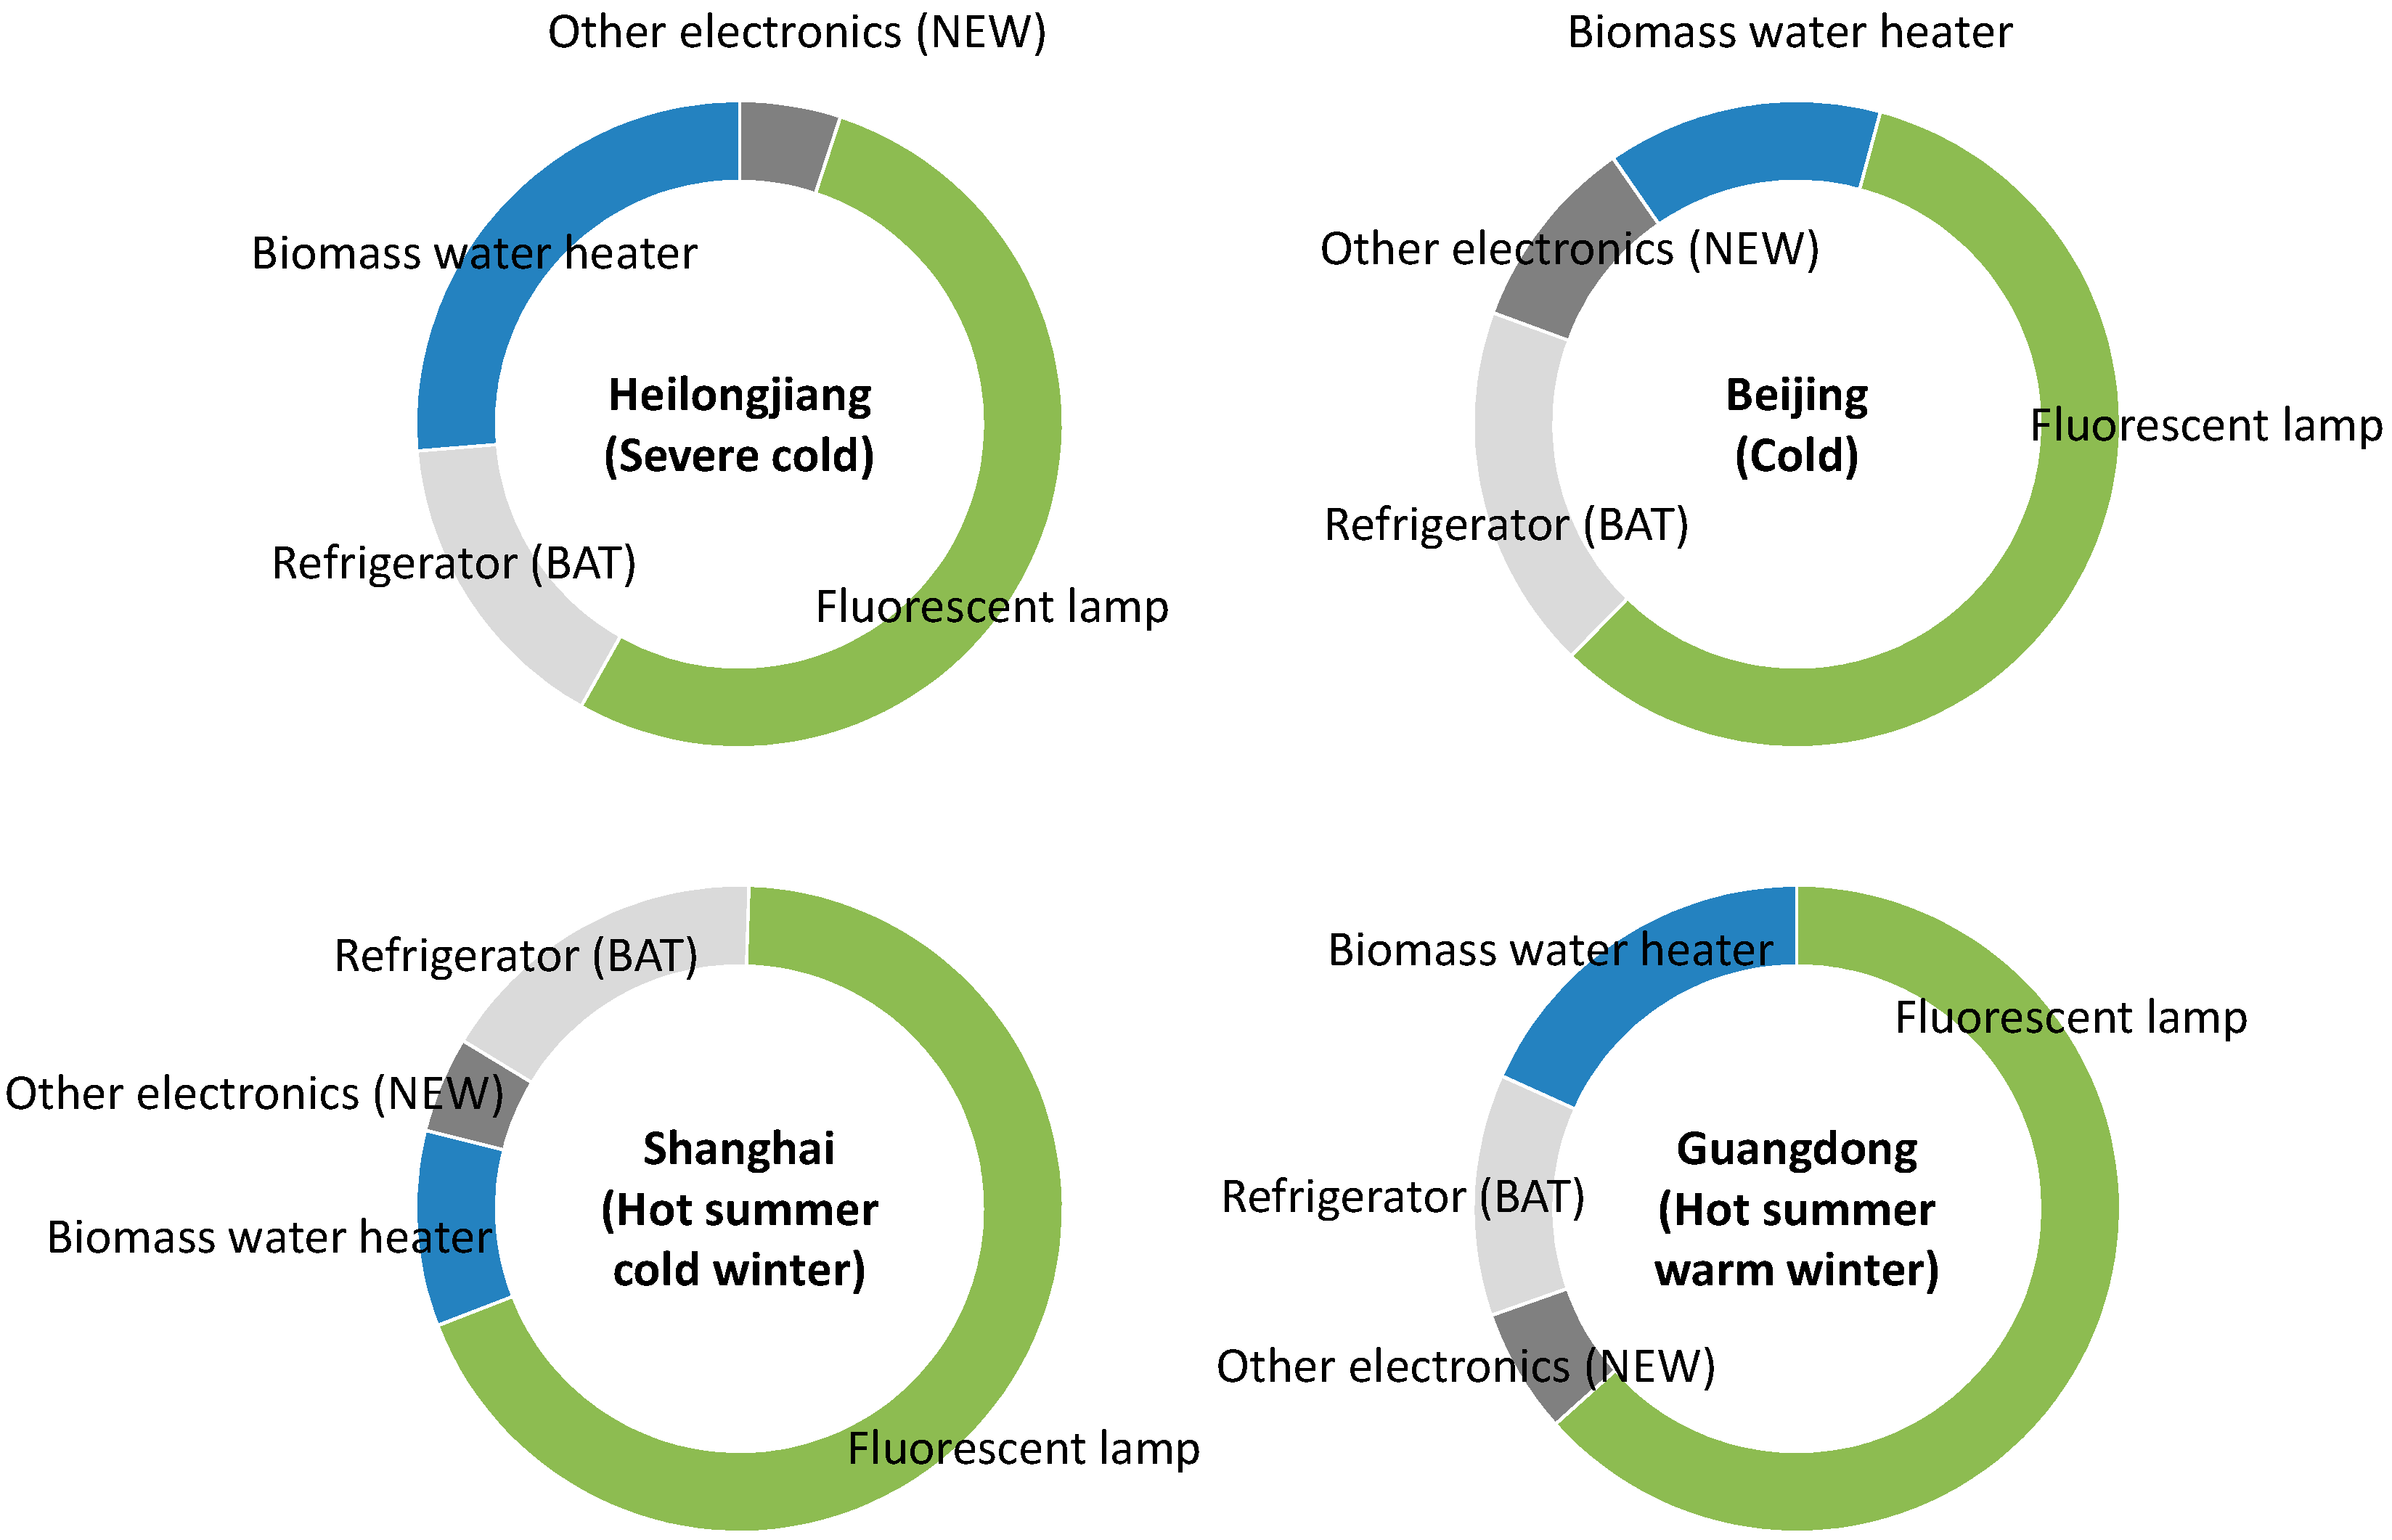
3.3. Technology Selection

4. Conclusions and Future Work
4.1. Conclusions
4.2. Future Work
Note
Supplementary Materials
Acknowledgments
Author Contributions
Conflicts of Interest
References
- National Bureau of Statistical of China (NBSC). China Statistical Yearbook 2010; National Bureau of Statistical of China: Beijing, China, 2012.
- Fan, J.L.; Yu, H.; Wei, Y.M. Residential energy-related carbon emissions in urban and rural China during 1996–2012: From the perspective of five end-use activities. Energy Build. 2015, 96, 201–209. [Google Scholar] [CrossRef]
- Yu, X. Is environment “a city thing” in China? Rural–urban differences in environmental attitudes. J. Environ. Psychol. 2014, 38, 39–48. [Google Scholar] [CrossRef]
- Zhao, C.-S.; Niu, S.-W.; Zhang, X. Effects of household energy consumption on environment and its influence factors in rural and urban areas. Energy Procedia 2012, 14, 805–811. [Google Scholar]
- Liu, W.; Spaargaren, G.; Heerink, N.; Mol, A.P.; Wang, C. Energy consumption practices of rural households in north China: Basic characteristics and potential for low carbon development. Energy Policy 2013, 55, 128–138. [Google Scholar] [CrossRef]
- Tonooka, Y.; Liu, J.; Kondou, Y.; Ning, Y.; Fukasawa, O. A survey on energy consumption in rural households in the fringes of Xian city. Energy Build. 2006, 38, 1335–1342. [Google Scholar] [CrossRef]
- National Bureau of Statistical of China (NBSC). Publication Database; National Bureau of Statistical of China: Beijing, China, 2015. Available online: http://data.stats.gov.cn/publish.htm?sort=1 (accessed on 4 September 2015).
- GEI. Situation and Trends of China’s Rural Energy Consumption, Global Environmental Institute, 2010. Available online: http://www.eu-china.net/upload/pdf/nachrichten/2010_08_02_bonn_29062010_jin.pdf (accessed on 17 September 2015).
- Krey, V.; O’Neill, B.C.; van Ruijven, B.; Chaturvedi, V.; Daioglou, V.; Eom, J.; Jiang, L.; Nagai, Y.; Pachauri, S.; Ren, X. Urban and rural energy use and carbon dioxide emissions in Asia. Energy Econ. 2012, 34, S272–S283. [Google Scholar] [CrossRef]
- Feng, Z.; Wang, X. Rural household energy consumption with the economic development in China: Stages and characteristic indices. Energy Policy 2001, 29, 1391–1397. [Google Scholar]
- Büchs, M.; Schnepf, S.V. Who emits most? Associations between socio-economic factors and UK households’ home energy, transport, indirect and total CO2 emissions. Ecol. Econ. 2013, 90, 114–123. [Google Scholar] [CrossRef]
- Chitnis, M.; Hunt, L.C. What drives the change in UK household energy e expenditure and associated CO2 emissions? Implication and forecast to 2020. Appl. Energy 2012, 94, 202–214. [Google Scholar] [CrossRef]
- Dai, H.; Masui, T.; Matsuoka, Y.; Fujimori, S. The impacts of China’s household consumption expenditure patterns on energy demand and carbon emissions towards 2050. Energy Policy 2012, 50, 736–750. [Google Scholar] [CrossRef]
- Rosas-Flores, J.A.; Rosas-Flores, D.; Gálvez, D.M. Saturation, energy consumption, CO2 emission and energy efficiency from urban and rural households appliances in Mexico. Energy Build. 2011, 43, 10–18. [Google Scholar] [CrossRef]
- Yu, S.; Eom, J.; Zhou, Y.; Evans, M.; Clarke, L. Scenarios of building energy demand of China with a detailed regional representation. Energy 2014, 67, 284–297. [Google Scholar] [CrossRef]
- MOHURD. Thermal Design Code for Civil Building; Ministry of Housing and Urban-Rural Development of the People’s Republic of China; China Architecture & Building Press: Beijing, China, 1993. [Google Scholar]
- Zhang, Q.; Asano, K.; Hayashi, T.; Imai, H. Regional characteristics of heating loads for apartment houses in China. J. Archit. Plan. Environ. Eng. 2001, 548, 69–74. (In Japanese) [Google Scholar]
- The Economist, Chinese equivalents, 2014. Available online: http://www.economist.com/content/chinese_equivalents (accessed on 21 November 2014).
- O’Neill, B.C.; Kriegler, E.; Ebi, K.L.; Kemp-Benedict, E.; Riahi, K.; Rothman, D.S.; van Ruijven, B.J.; van Vuuren, D.P.; Birkmann, J.; Kok, K.; et al. The roads ahead: Narratives for shared socioeconomic pathways describing world futures in the 21st century. Globl. Environ. Chang. 2015. [Google Scholar] [CrossRef]
- Van Vuuren, D.P.; Riahi, K.; Moss, R.; Edmonds, J.; Thomson, A.; Nakicenovic, N.; Kram, T.; Berkhout, F.; Swart, R.; Janetos, A.; et al. A proposal for a new scenario framework to support research and assessment in different climate research communities. Globl. Environ. Chang. 2012, 22, 31–35. [Google Scholar] [CrossRef]
- IIASA (International Institute for Applied Systems Analysis). SSP Database (version 0.93), 2012. Available online: https://secure.iiasa.ac.at/web-apps/ene/SspDb/dsd?Action=htmlpage&page=about (accessed on 26 July 2014).
- Xing, R.; Hanaoka, T.; Kanamori, Y.; Dai, H.; Masui, T. An impact assessment of sustainable technologies for the Chinese urban residential sector at provincial level. Environ. Res. Lett. 2015, 10. [Google Scholar] [CrossRef]
- Xing, R.; Ikaga, T. Assessment of sustainable policy implications in China’s urban residential sector. Int. J. Sustain. Build. Technol. Urban Dev. 2013, 4, 229–242. [Google Scholar] [CrossRef]
- Wang, X.; Feng, Z. Rural household energy consumption in Yangzhong county of Jiangsu province in China. Energy Vol. 1996, 22, 1159–1162. [Google Scholar]
- SHASE. SCHEDULE Ver.2.0; The Society of Heating, Air-conditioning and Sanitary Engineers of Japan: Tokyo, Japan, 2000. [Google Scholar]
- Eom, J.; Clarke, L.; Kim, S.H.; Kyle, P.; Patel, P. China’s building energy demand: Long-term implications from a detailed assessment. Energy 2012, 46, 405–419. [Google Scholar] [CrossRef]
- Anderson, J.; Kushman, J. A model of household heating demand: Home production with satiety and an endowment. J. Consum. Aff. 1987, 21, 1–20. [Google Scholar] [CrossRef]
- Henley, A.; Peirson, J. Non-linearities in electricity demand and temperature: Parametric versus non-parametric methods. Oxf. Bull. Econ. Stat. 1997, 59, 149–162. [Google Scholar] [CrossRef]
- OECD (OECD Statistics), 2014. Available online: http://stats.oecd.org/Index.aspx?DataSetCode=NAAG (accessed on 10 November 2014).
- Hanaoka, T.; Fujiwara, K.; Motoki, Y.; Oshiro, K.; Hibino, G.; Masui, T.; Matsuoka, Y. AIM/Enduse Model Manual AIM Interim Report; National Institute for Environmental Studies: Tsukuba, Japan, 2015. [Google Scholar]
- Kainuma, M.; Matsuoka, Y. Climate Policy Assessment: Asia-Pacific Integrated Model; Springer: Berlin, Germany, 2003. [Google Scholar]
- NIES, 2012. Available online: http://www-iam.nies.go.jp/aim/prov/2011_committee/ref2%282%29rev20120912.pdf (accessed on 13 March 2015).
- Han, Y.; Wang, D.; Bi, Y. Analysis on current situation of rural household energy consumption in Tancheng county. Chin. Agric. Sci. Bull. 2013, 29, 182–187. (In Chinese) [Google Scholar]
- Luo, G.; Zhang, Y. Analysis on rural energy consumption of China. Chin. Agric. Sci. Bull. 2008, 24, 535–540. (In Chinese) [Google Scholar]
- Ning, Y.; Li, Y.; Ding, T.; Tonooka, Y. A survey on energy consumption in rural households in north-east China. Sustain. Energy 2012, 2, 76–81. (In Chinese) [Google Scholar]
- Wang, X.; Feng, Z. Study on rural household energy consumption in China: Consumption level and affecting factors. Trans. Chin. Soc. Agric. Eng. 2001, 17, 88–91. (In Chinese) [Google Scholar]
- Zhou, S.D.; Cui, Q.F.; Wang, C.C. Study on the Quantity, Structure and Influencing Factors of Rural Household Energy Consumption: A Case Study in Inner Mongolia. Resour. Sci. 2009, 31, 696–702. (In Chinese) [Google Scholar]
- Akashi, O.; Hanaoka, T. Technological feasibility and costs of achieving a 50% reduction of global GHG emissions by 2050: Mid- and long-term perspectives. Sustain. Sci. 2012, 7, 139–156. [Google Scholar] [CrossRef]
- Evans, M.; Yu, S.; Song, B.; Deng, Q.; Liu, J.; Delgado, A. Building energy efficiency in rural China. Energy Policy 2014, 64, 243–251. [Google Scholar] [CrossRef]
- International Energy Agency. IEA World Energy Outlook; International Energy Agency: Paris, France, 2014. [Google Scholar]
- National Bureau of Statistical of China (NBSC). Interim Provision on Dividing Urban and Rural Areas in Statistics; National Bureau of Statistical of China: Beijing, China, 2012. Available online: http://www.stats.gov.cn/tjsj/ndsj/renkoupucha/2000pucha/html/append7.htm (accessed on 14 September 2015).
© 2015 by the authors; licensee MDPI, Basel, Switzerland. This article is an open access article distributed under the terms and conditions of the Creative Commons by Attribution (CC-BY) license (http://creativecommons.org/licenses/by/4.0/).
Share and Cite
Xing, R.; Hanaoka, T.; Kanamori, Y.; Dai, H.; Masui, T. Energy Service Demand Projections and CO2 Reduction Potentials in Rural Households in 31 Chinese Provinces. Sustainability 2015, 7, 15833-15846. https://0-doi-org.brum.beds.ac.uk/10.3390/su71215789
Xing R, Hanaoka T, Kanamori Y, Dai H, Masui T. Energy Service Demand Projections and CO2 Reduction Potentials in Rural Households in 31 Chinese Provinces. Sustainability. 2015; 7(12):15833-15846. https://0-doi-org.brum.beds.ac.uk/10.3390/su71215789
Chicago/Turabian StyleXing, Rui, Tatsuya Hanaoka, Yuko Kanamori, Hancheng Dai, and Toshihiko Masui. 2015. "Energy Service Demand Projections and CO2 Reduction Potentials in Rural Households in 31 Chinese Provinces" Sustainability 7, no. 12: 15833-15846. https://0-doi-org.brum.beds.ac.uk/10.3390/su71215789