Article

Integrated Use of GCM, RS, and GIS for the Assessment of Hillslope and Gully Erosion in the Mushi River Sub-Catchment, Northeast China

1
College of Earth Science, Jilin University, Changchun 130061, China
2
Northeast Institute of Geography and Agroecology, Chinese Academy of Sciences, Changchun 130102, China
*
Author to whom correspondence should be addressed.
Sustainability 2016, 8(4), 317; https://0-doi-org.brum.beds.ac.uk/10.3390/su8040317
Submission received: 31 January 2016 / Revised: 20 March 2016 / Accepted: 25 March 2016 / Published: 30 March 2016

Abstract

:
The black soil region of Northeast China has suffered from severe soil erosion by water. Hillslope and gully erosion are the main erosion types. The objective of this research was to integrate the assessment of hillslope and gully erosion and explore spatial coupling relations between them in the Mushi River sub-catchment using geographical conditions monitoring (GCM) including remote sensing (RS) and geographic information system (GIS) techniques. The revised universal soil loss equation (RUSLE) model and visual satellite image interpretation were used to evaluate hillslope and gully erosion, respectively. The results showed that (1) the study area as a whole had slight erosion due to rill and sheet erosion, but suffered more serious gully erosion, which mainly occurs in cultivated land; (2) GCM contributed to the overall improvement of soil erosion assessment, but the RUSLE model likely overestimates the erosion rate in dry land; (3) the hillslope and gully erosion were stronger on sunny slopes than on shady slopes, and mainly occurred at middle elevations. When the slope was greater than 15 degrees, the slope was not the main factor restricting the erosion, while at steeper slopes, the dominant forest land significantly reduced the soil loss; (4) trends of gully erosion intensity and density were not consistent with the change in soil erosion intensity. To our knowledge, this study was one of the first that attempted to integrate gully erosion and hillslope erosion on a watershed scale. The findings of this study promote a better understanding of the spatial coupling relationships between hillslope and gully erosion and similarly indicate that GCM, RS, and GIS can be used efficiently in the hilly black soil region of Northeast China to assess hillslope and gully erosion.

1. Introduction

Soil erosion is regarded as a major environmental problem for sustainable development of human society because it seriously threatens natural resources, agriculture, and the environment [1]. It is also one of the most significant forms of land degradation, causing 80% of the world’s land degradation [2]. Soil erosion has resulted in a series of environmental concerns, such as undermining land resource quality, leading to significant environmental disasters, and influencing sustainable regional development [3]. Relevant and major global research programs and international organizations regard soil erosion as an important research topic [4]. For example, the Future Earth (2014–2023) program focuses on studying the shared challenges of particular places and regions such as soil degradation [5].
The black soil region in Northeast China is considered one of the typical areas of the world that have been characterized by a high-tension man–land relationship within short-term time scales [6] and suffered severe soil erosion due to the mass reclamation in the last 100 years [7]. Soil loss caused by water erosion including hillslope erosion and gully erosion in this region is mainly derived from farmlands in sloping areas [8]. Previous studies on soil erosion in the black soil region were carried out from different perspectives [9,10,11,12,13,14,15]. The conclusions confirmed that hillslope and gully erosion closely interact with each other both in space and time. However, few studies focus on exploring the relationship between hillslope and gully erosion on a large scale [16]. Meanwhile, limitations of timeliness, accuracy, and precision of the information about the natural environment and human interference have impeded soil erosion assessment in black soil regions.
To obtain an objective and comprehensive geographical view of the spatial distribution and variation of natural resources, the National Administration of Surveying, Mapping, and Geo-information (NASG) started the Geographical Conditions Monitoring (GCM) project in 2012. The geographical conditions information census is the first national census for China, making full use of high-resolution remote sensing images including space-borne sensors (Pleiades-1A, Worldview 2, etc.), airborne sensors, and ground data. Important results obtained from the census, such as topography, land cover, and other information, will provide a basis for a more sustainable environment [17] and also provide a possibility for soil erosion assessment in black soil regions.
Splash erosion, sheet erosion (the previous two types are also called interrill erosion), rill erosion, and gully erosion are generally recognized as the main types of soil erosion by water [18]. Splash erosion marks the beginning of other types of soil erosion involving raindrop impact, splash of soil particles, and formation of craters [19]. It is called sheet erosion when a thin layer of soil is removed by raindrop impact and shallow surface flow from the whole slope. When rainfall exceeds the rate of infiltration, water accumulates on the surface of gently sloped land and moving water concentrates along tiny channels called rills that are less than 30 cm deep [18]. Gully erosion begins when runoff concentrates in channels and rills develop, which may grow into gullies deeper than 30 cm over short time periods [20].
Spatial and quantitative information on soil erosion on a watershed scale contributes significantly to soil conservation management, erosion control, and catchment environment management [21]. Previous studies showed that assessment of soil erosion methods mainly included empirical models [22,23], physically based models [15,24,25,26], nuclear tracing [27], and spatially distributed multivariate models [28,29]. Among these models, the revised universal soil loss equation (RUSLE) [23] is a revised version of the universal soil loss equation (USLE) model [22]. RUSLE proved to be the most commonly applied model to estimate soil loss [30,31,32]. Recently, many studies have applied remote sensing (RS) and Geographic Information System (GIS) methodologies to assess soil erosion [29,31,33,34,35]. In particular, satellite images with very high spatial resolution have offered possibilities for landscape feature mapping and quantitative evaluation of farm practices in soil erosion assessment [36,37].
RUSLE is designed to model sheet (interrill) and rill erosion and evaluate soil loss from agricultural areas caused by overland flow [38,39,40]. However, it does not assess gully erosion [41]. Gully erosion causes more significant soil loss and soil degradation compared with hillslope erosion [42]. There are numerous techniques for monitoring and quantification of gully erosion, such as ruler, tape, microtopographic profilers [43], poles, total stations [44], pins [45], differential GPS [11,46], terrestrial laser scanners [47], stereoscopic photogrammetry on ground [48], aerial photographs [49,50], visual analysis of satellite images [51,52], object-oriented analysis [53], 3D photo-reconstruction [44,54], and unmanned aerial vehicles [55]. Analysis of satellite images combined with field validation has proven to be an excellent and practical approach for mapping of gully features and assessing gully erosion over large areas [10,56]. However, the spatial resolution of satellite images in previous studies was mostly higher than 5 m. According to a field survey, a considerable proportion of erosion gullies have widths less than 5 m, especially ephemeral gullies in the black soil region, and the analysis results are insufficient to estimate the potential hazard of gully erosion [57]. Higher temporal and spatial resolution images provided new possibilities for studying gully erosion [53,58,59].
This study aims to integrate the assessment of hillslope and gully erosion. RUSLE was used to calculate soil loss caused by hillslope erosion, and visual satellite image interpretation with field verification was used to map geometric gully features and evaluate gully erosion. Another objective is to elucidate the spatial coupling relationship between hillslope and gully erosion using spatial overlay statistics based on the previous assessment.

2. Materials and Methods
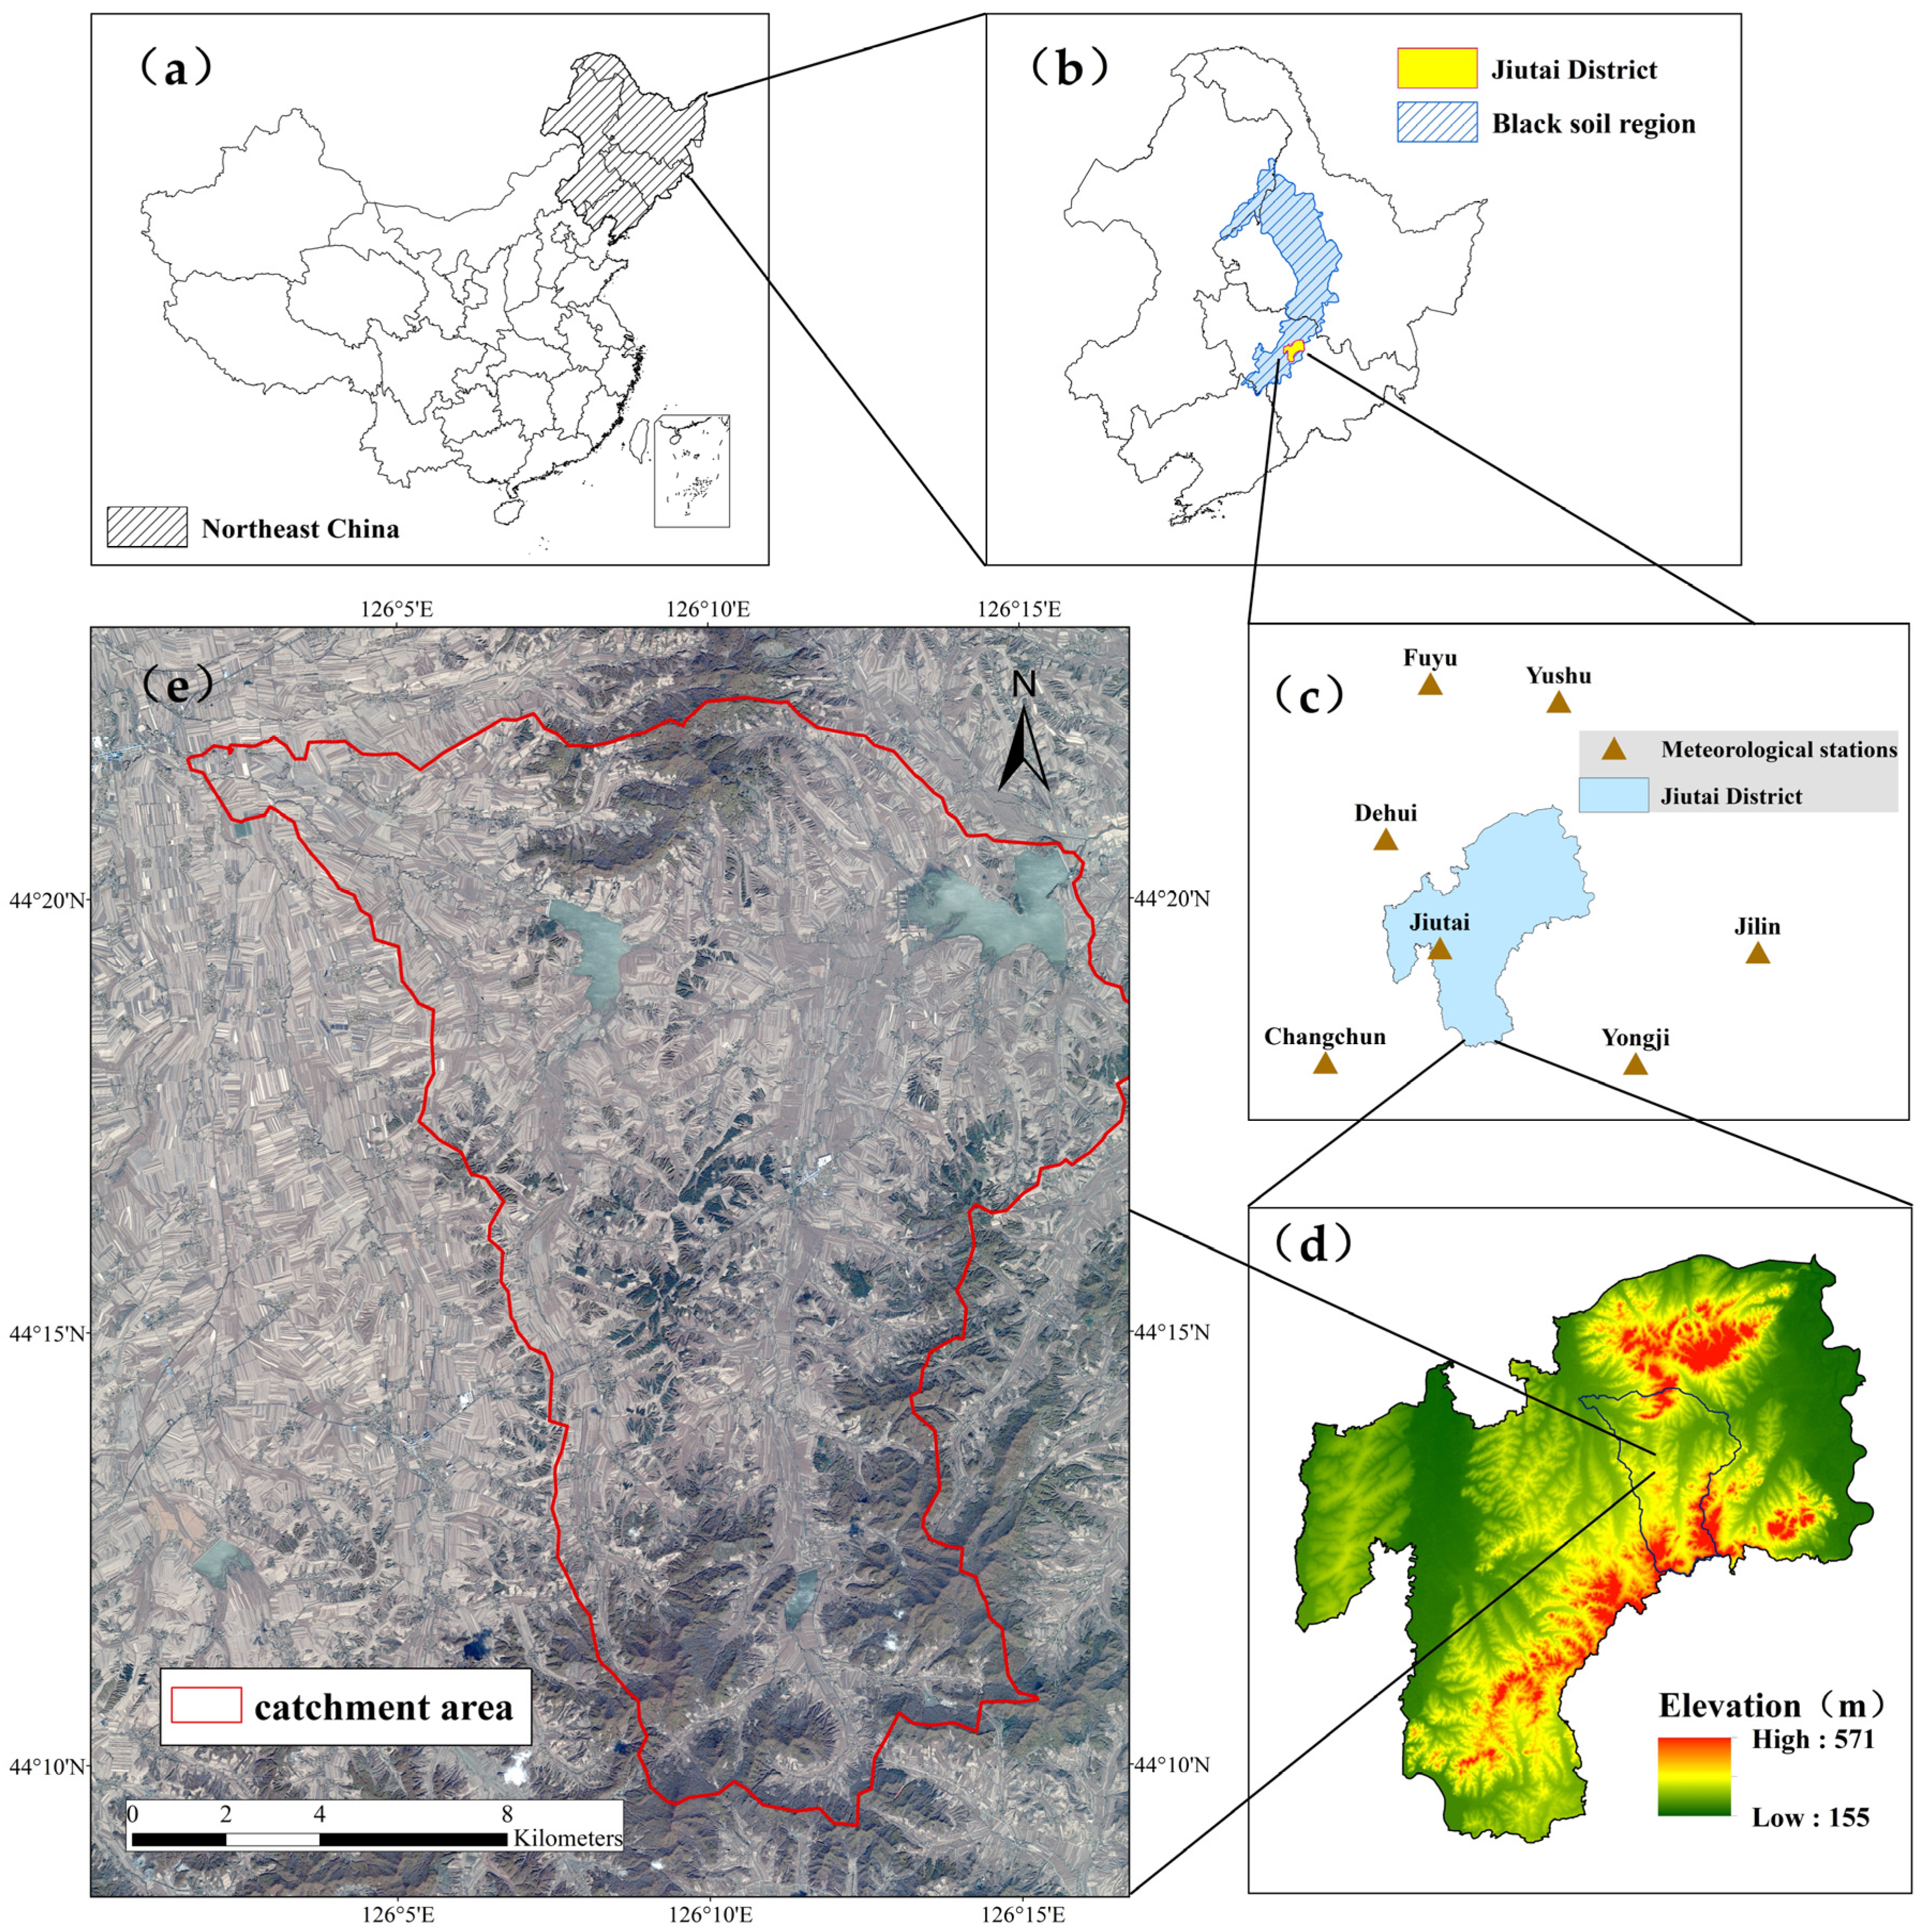
2.1. Study Area

The study area shown in Figure 1e mainly included the middle and lower area of Mushi River basin with serious soil and water loss covering 253.13 km2. The target area (126°1’39’’E–126°17’14’’E, 44°9’18’’N–44°22’20’’N) is located in the Jiutai District (Figure 1d), Jilin Province, Northeast China (Figure 1a,b). This area is situated at the southeastern edge of the black soil region (Figure 1b). As the dominant soil type, black soil is classified as Udic Isohumisol in the Chinese Soil Taxonomy or Luvic Phaeozem in the FAO (Food and Agriculture Organization of the United Nations) system [60]. The parent materials are Quaternary lacustrine and fluvial sand beds or loess sediments [61], and the main textural classes of the topsoil are silt-clay-loam to clay-loam (8%–27% sand, 29%–66% silt and 26%–40% clay) [62]. Other soil types include meadow soil, albic soil, dark brown soil, and new alluvial soil. The catchment area has a continental climate with four distinctive seasons. The annual temperature is 5.3 °C, the highest average monthly temperature is 23.3 °C, and the lowest average monthly temperature is −16.3 °C. The annual precipitation ranges from 550 to 600 mm. Sloped farmland is the main land use type because this area is located in the hilly area between Changbai Mountain and Songliao plain with large terrain undulation and little vegetation cover. Therefore, gully erosion is widely distributed in this area, which is one of the typical black soil erosion regions of Northeast China.

2.2. Data Sources

The sources and products of GCM, including high-resolution satellite images, digital elevation model (DEM), land cover data, and other important geographical condition data (road, water, residential sites, etc.), were provided by the Jilin Province Geomatics Center.
The high-resolution Pleiades image was used for the mapping of farming practices such as contour tillage and the monitoring of gully erosion. Pleiades-1A imagery shows a 0.7-m vertical viewing panchromatic band and four 2.8-m multi-spectral bands (blue, green, red, and near-infrared) (Figure 1e). The images were collected on 12 October 2013, and have been processed into DOM by the data providers.
The DEM of 5-m pixel size was produced using 1:10,000 scale topographical maps for terrain elevation and other topography-related analyses.
The land use/land cover (LULC) map derived from Pleiades-1A, aerial images, and ground data were used as the basis for C- and P-factor determination. The classification accuracy of the LULC map from GCM was notably higher (Figure 2) compared with the land-use map with a scale of 1:100,000 (derived from Landsat8 imagery that was acquired on 16 October 2013, and by the Chinese Academy of Sciences).
Meteorological data, i.e., a monthly rainfall dataset of seven national meteorological stations from 1958–2013, were obtained from the China Meteorological Data Sharing Service System and the Meteorological Bureau of Jilin Province.
The soil spatial distribution map was derived from the 1:1,000,000 scale nationwide soil database, which was provided by the Chinese Academy of Sciences. Detailed soil attributes including mechanical composition, grain sizes, and organic content were taken from the second national soil survey in China.

2.3. RUSLE for Modeling Hillslope Erosion

The RUSLE equation model has five different factors: rainfall (R), soil erodibility (K), slope length and steepness (LS), cover management (C), and support practice (P) (Equation (1)).
A = R × K × L × S × C × P,
where A is the mean soil loss per year (t·hm−2·a−1), R is the rainfall erosivity factor (MJ·mm·hm−2·h−1·a−1), K is the soil erodibility factor (t·hm−2·h·MJ−1·mm−1·hm−2), LS is the topographical factor, C is the cover and management factor, and P is the conservation practices factor; L, S, C, and P are dimensionless.

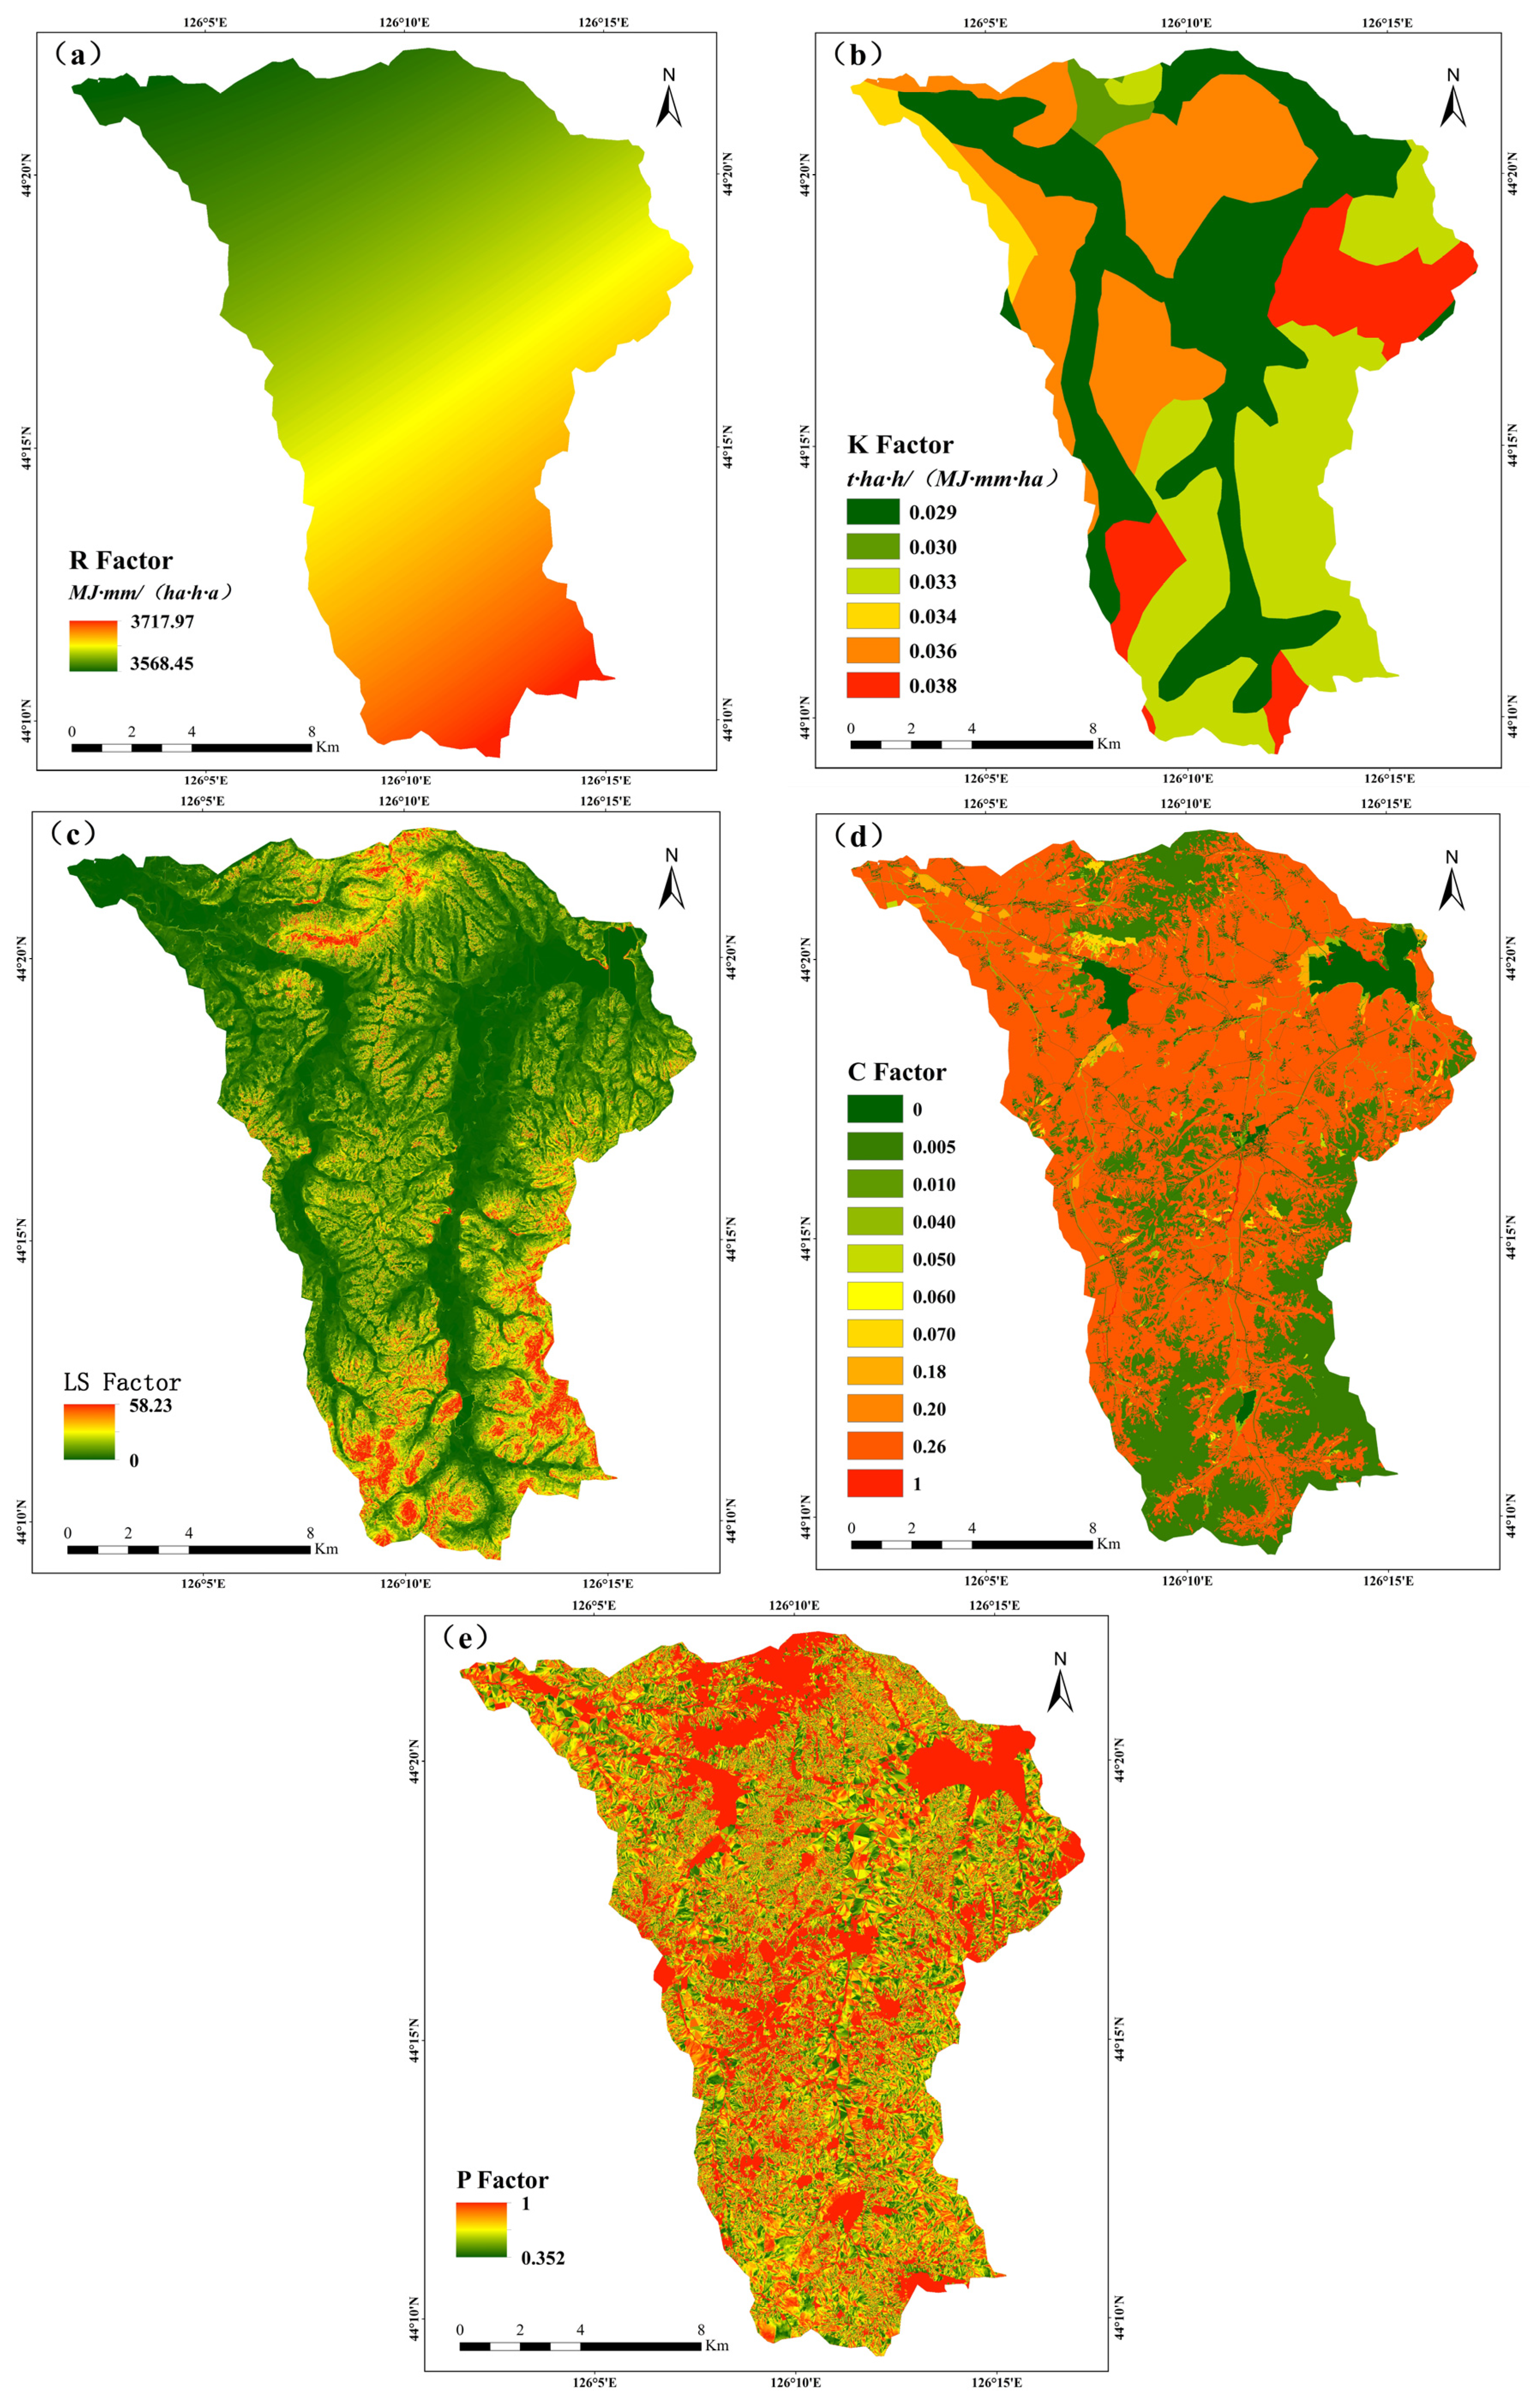
2.3.1. Rainfall Erosivity (R)

Rainfall is the main driving force of soil erosion. Rainfall erosivity represents the potential of soil erosion caused by raindrop splash runoff erosion [63]. The product of rainfall kinetic energy (E) and the maximum 30 min rainfall intensity (I30) is a classical calculation method for R. However, it is very difficult to reflect continuous records of rainfall data with this method. Therefore, many scholars have proposed more mature and simpler calculation methods of rainfall erosivity. In this study, we used a method based on monthly and annual rainfall proposed by Wischmeier [22] because of its simple equation, wide application range, and the ease of obtaining data. The equation model is shown as follows:
R = i = 1 12 1.735 × 10 ( 1.5 × log 10 P i 2 P ) 0.8188 ,
where i is the month, Pi is the monthly rainfall (mm), and P is the annual precipitation (mm). The R value of the formula is given in U.S. unit 100 ft·tonf·in/(acre·h·year); hence, it should be multiplied by a coefficient of 17.2 for conversion into the international unit MJ mm/(hm2·h·a) [64].
The R factors of meteorological stations around the study area were calculated by using the monthly precipitation data from 1958 to 2014. Spatial distribution of the R factor in the study area was interpolated using the ordinary Kriging method.

2.3.2. Soil Erodibility Factor (K)

The soil erodibility factor (K) was used to measure the sensitivity of soil erosion to water and indicate the resistance of soil to erosion. In this study, the EPIC (erosion-productivity impact calculator) model was selected to estimate the soil erodibility factor [65]. The formula is as follows:
K = { 0.2 + 0.3 e [ 0.0256 S a ( 1 S i / 100 ) ] } [ S i / ( C l + S i ) ] 0.3 × { 1 0.25 C / [ C + e ( 3.72 2.95 C ) ] } × { 1 0.7 S n / [ S n + e ( 5.51 + 22.9 S n ) ] } ,
where Sa is the sand (0.05–2 mm) content (%); Si is the silt (0.002–0.05 mm) content (%); Cl is the clay content (%); C is the organic carbon content (%); and Sn = (1 − Sa)/100. The K value of the formula is given in U.S. unit t·acre·h/(100 acre·ft·tonf·in). Thus, it should be multiplied by a coefficient of 0.1317 for conversion into the international unit t·hm2·h/(MJ·mm·hm2) [64].
Note that the statistical standard of soil particle size in the equation is based on the U.S. system, but the second national soil survey of China uses the international system. According to the graphic method [66], the sizes were converted by statistical software. The conversion equation correlation coefficients R2 are all above 0.95 (p < 0.05).

2.3.3. Topographic Factor (LS)

The topographic factor (LS) indicates the impact of slope length and slope steepness on soil erosion. LS was also considered to be a crucial factor for surface runoff and soil erosion [23]. Slope steepness has a significant effect on the rates of soil erosion. The steeper the slope is, the faster overland flow runs. Thus, the steeper slope will then increase the shear force of the soil particles. In addition, surface runoff and flow rate will have a steady growth with increasing slope length, leading to a greater erosion force on the soil surface [67]. Usually the product of length and slope of terrain is used as the terrain factor. This study estimated the LS factor using Equation 4 [67]. Usually the product of length and slope of terrain was used as terrain factors. This paper estimated the LS factor by using the formula [9]:
L S = ( λ 20 ) 0.18 ( α 8.75 ) 1.3   ,
where L is the slope length factor; S is the slope steepness factor; λ is the field slope length (m); and α is the slope angle in percentage.
This paper selected the procedure derived from Hickey [68] and Van Remortel [69], and modified the corresponding parameter to generate the LS factor raster.

2.3.4. Cover Management Factor (C)

The C factor indicates the effect of vegetation cover and management on soil erosion. It is an important factor to evaluate the ability of vegetation canopy and ground covers to resist soil erosion, and its value is between 0 and 1. Using remote sensing image interpretation to acquire land cover type maps [70] or collecting land use data [67,71] directly and then assigning C values from the existing literature to the corresponding land use/land cover types is the main means of accessing C factors on the river basin and regional scale [72]. This paper assigned C values to different LULC classes derived from GCM (Table 1) according to existing research in the black soil region [9,13,16].

2.3.5. Practice Factor (P)

The practice factor (P) is defined as the ratio of soil loss after a specific preservation practice to the corresponding soil loss after upward and downward cultivation under otherwise equal conditions, ranging from 0 to 1, in which 0 represents the areas with no soil erosion due to good protective measures and 1 reflects the areas with no support practice. At the watershed level, farming practices such as terrace and contour ridge cannot be reflected in a land use map [73] but are clear in QuickBird images [37].
Ridge tillage is the main farming practice in the black soil region. This paper used the angle between ridge direction and slope aspect to calculate the P value, which is based on previous studies [37]. The P equation is given as follows (Equation 5):
P = P s α 90 ° × ( P s P h ) ,
where P is the value of the Water Conservation Measures factor and α is the angle between ridge direction and slope aspect in degrees (0°–90°). Ph is 0.352 when the angle is 90° [9], i.e., Contour Ridge, which means that the ridge direction is parallel to the contour line and perpendicular to the slope aspect. Ps is 1 when the angle is 0°, i.e., Downslope Ridge, which means that the ridge direction is perpendicular to the contour line and parallel to the slope aspect. The specific steps are as follows: (1) according to the visual interpretation of the Pleiades image, this paper segmented the farmland into plots with the same ridge and assigned the ridge direction azimuth to each plot by outlining the ridge direction line (Figure 3); (2) DEM was used to generate the slope aspect layer; (3) the ArcGIS grid calculator was applied to calculate the angle between the ridge and slope direction. p-values of arable land on the flat ground and other LULC types were assigned as 1, usually without any soil and water conservation measures.

2.3.6. Calculation of Soil Erosion

According to the RUSLE equation, the R, K, LS, C, and P data layers (Figure 4) were considered to generate the hillslope erosion map in ArcGIS (Figure 5). The calculated soil loss values were divided into six erosion classes according to the soil erosion rate standard, Technological Standard of Soil Erosion Grade and classification SL190-96, issued by the Ministry of Water Resources of China [32].

2.4. Mapping and Assessment of Gully Erosion

In this research, visual 0.7-m resolution Pleiades-1A imagery interpretation was used to obtain gully distribution data of the study area. The gullies were classified as either ephemeral or permanent gully [42]. Stream-channels and gullies in forests were not objects of this research. With the help of expert knowledge and field surveys that were conducted in May 2012, gully interpretation signs on Pleiades images were determined (Table 2). The gullies were mainly discriminated according to their spectral and spatial characteristics. Based on the topographical map, hydrographical net map, traffic map, and related information, the data of gully distribution were mapped including a polyline layer and a polygon layer representing gully length and area, respectively. ArcGIS 10.0 software was combined with expert experience. Gullies with a width less than 3 pixels were only outlined for length, not area. Field validation work was conducted in May 2015, based on which the gully data were modified and the final gully distribution data were obtained (Figure 6a). According to the field validation, the precision of gully interpretation was 88.9%. Some field paths are easily mistaken for ephemeral gullies.
As the main indicator for assessing gully erosion, gully density within the study area was defined as the total gully length per area of the whole study area. The distribution of gully density was estimated by using the line density tool in ArcGIS (Figure 6b). The density was calculated as the ratio of total length of the gully within the circular kernel (50-m search radius) and the total area of the circular kernel. Similarly, gully intensity was calculated by using the measurement of total gully area per area of total subcatchment. The gully intensity was used as the main indicator in the analysis of topographical differentiation of hillslope and gully erosion.

3. Results

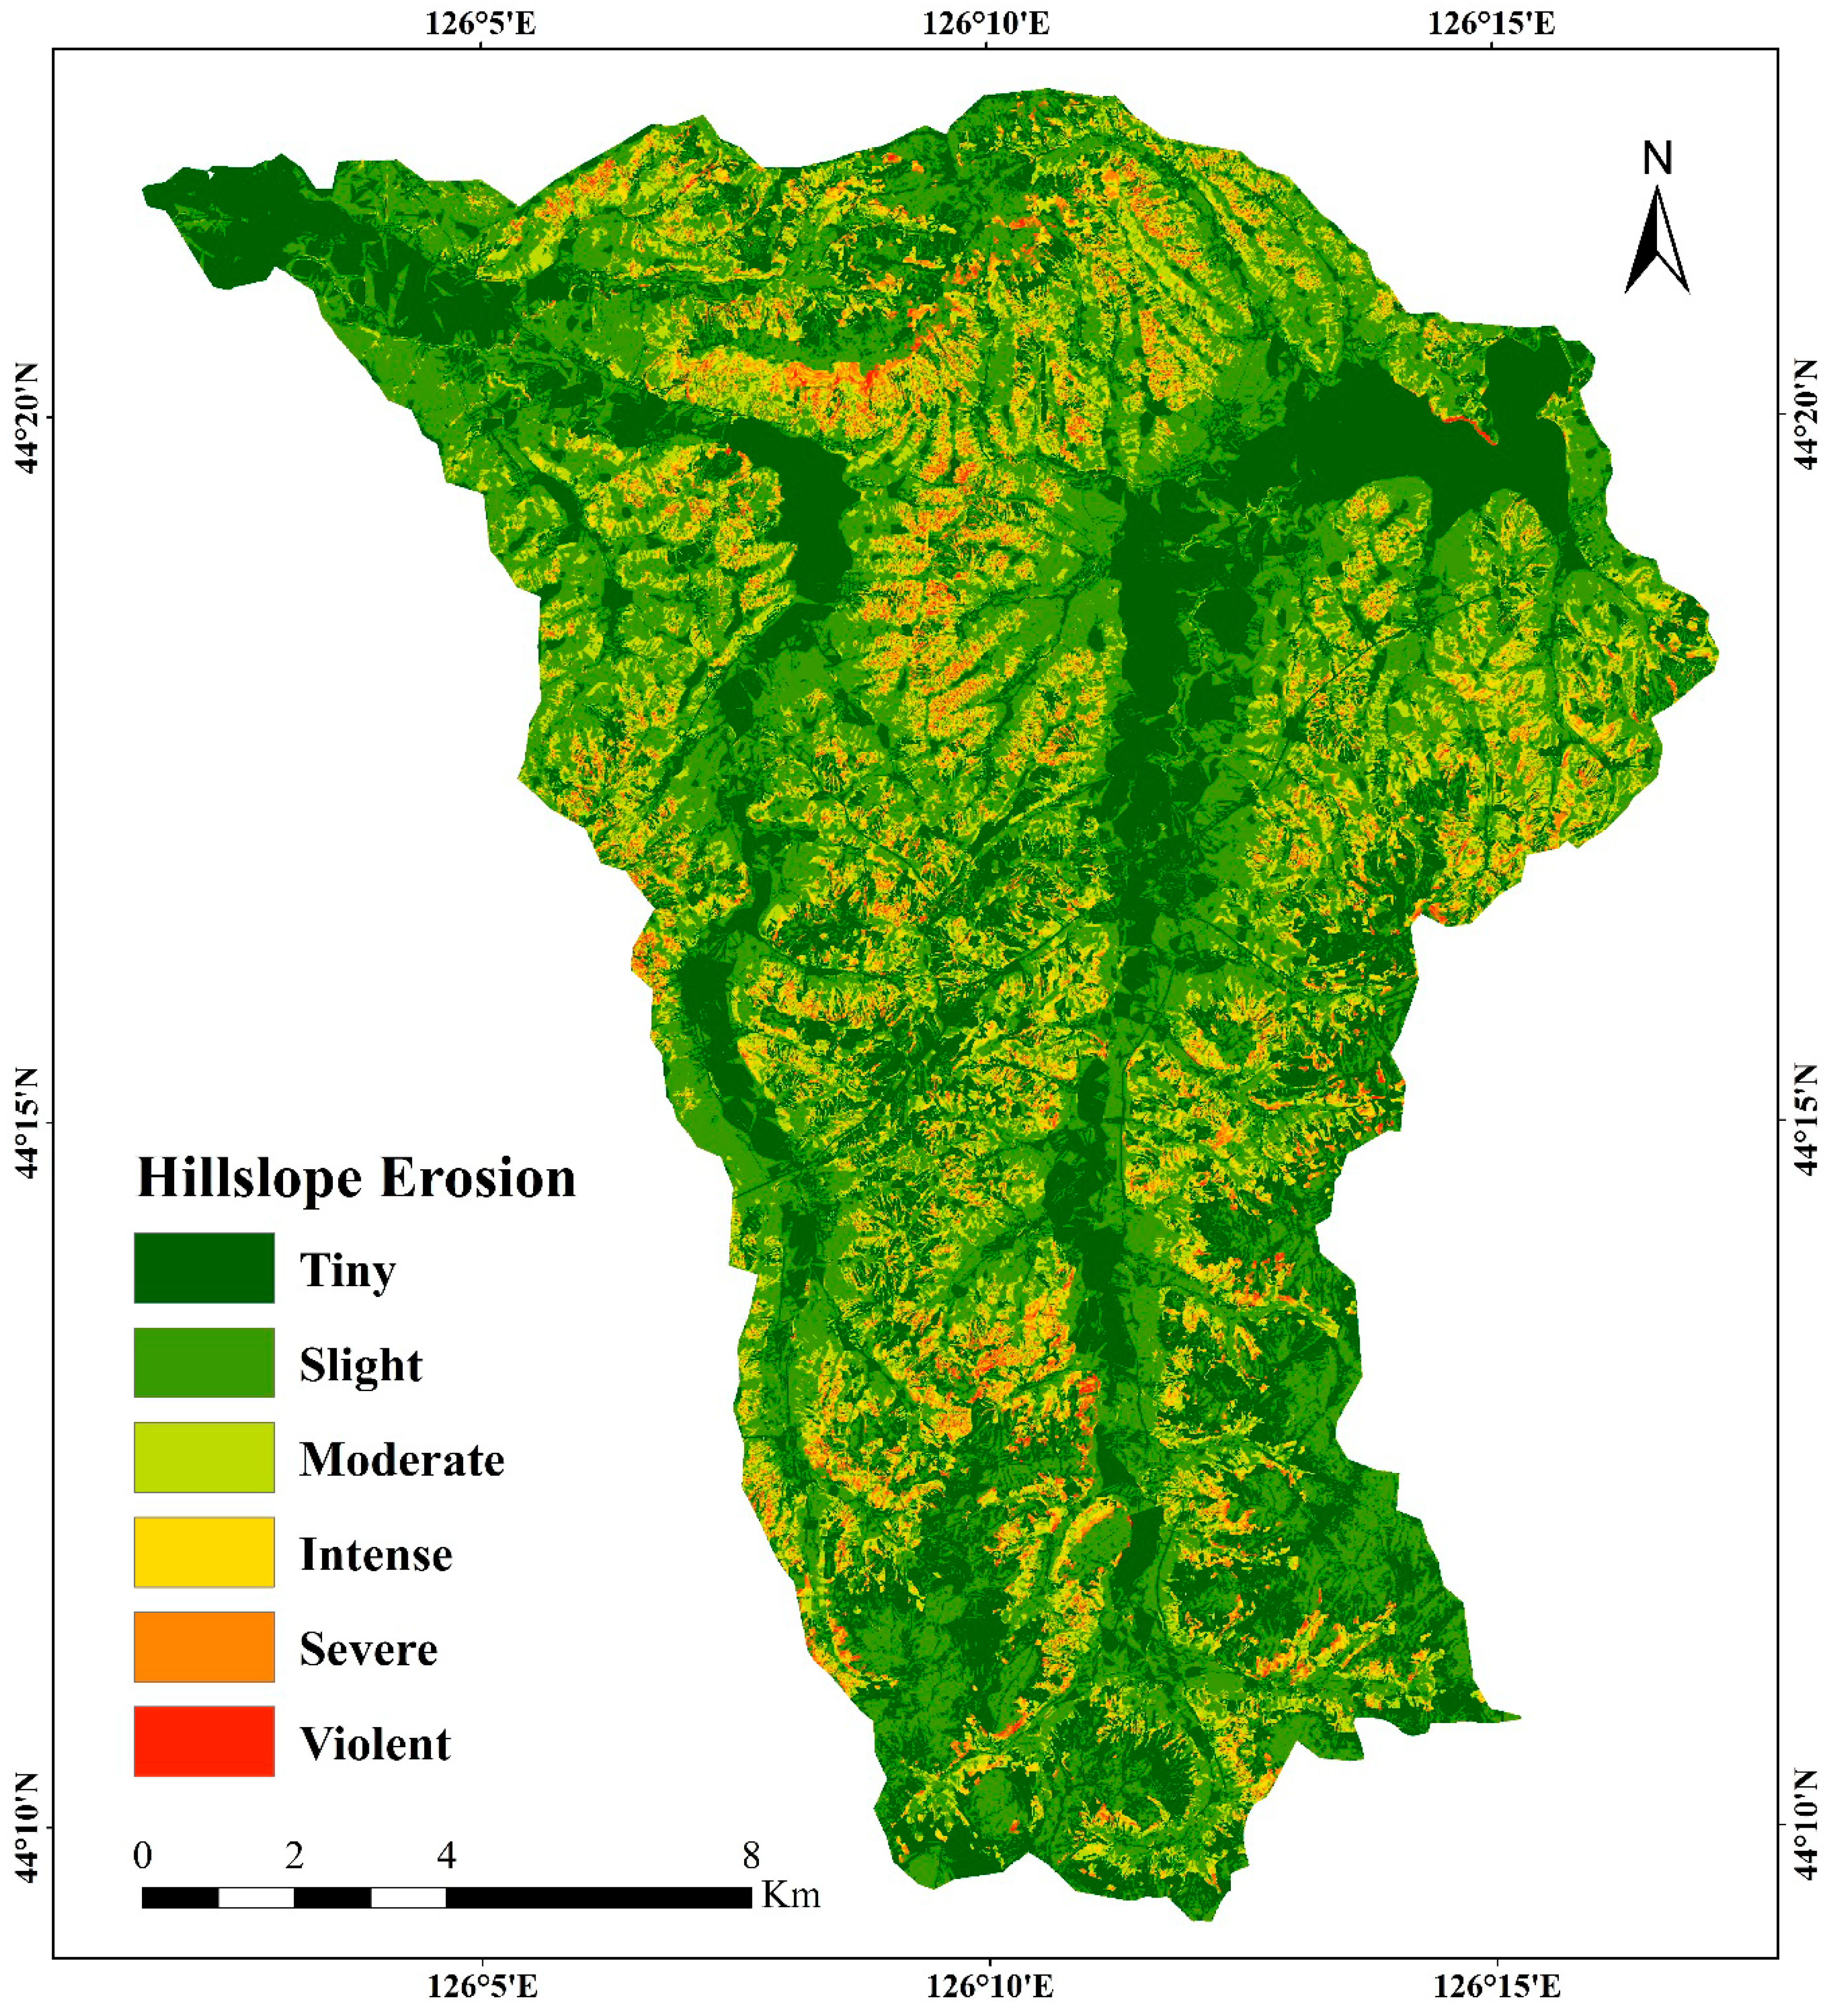
3.1. Soil Loss Due to Hillslope Erosion Using RUSLE

The rainfall erosivity (R) factor values range from 3568.45 to 3717.97 MJ·mm·hm-2·h-1·a-1 and increase from northwest to southeast (Figure 4a). This result indicates that the R factor was affected by the distribution of meteorological stations outside the area when missing sites in the study area. The soil erodibility (K) factor values were obtained using Equation 3 depending on different soil types and range from 0.029 to 0.038 t·hm2·h·MJ–1·mm–1·hm–2 (Figure 4b). Dark brown soil and black soil have higher erodibility values (K was 0.038 t·hm2·h·MJ–1·mm–1·hm–2), and meadow soil is less erodible (0.029 t·hm2·h·MJ–1·mm–1·hm–2) than other soil types. The topographic (LS) factor values range from 0 (flat areas, mainly in the valley plain between the hills) to 58.25 (steep hills, in the northern and southern part of the study area) (Figure 4c). As the main types of LULC in the study area, dry land occupies 65% of the total study area, while 26% of the area is forest. The C values range from 0.005 to 0.07. Desert and bare ground have the highest C values (1), while the C factor was 0 for water areas, housing construction areas, structures, and roads (Figure 4d).
The slope of the 59% slope farmland is higher than 5 degrees, where soil erosion is more serious due to unfavorable terrain factors. Concerning the angle between the ridge and slope direction, the P factor values range from 0.352 to 1 (Figure 4e). With the increase in the angle, the proportion of slope farmland is gradually reduced, and more than 75% of the whole slope farmland is cultivated land with askew ridges (angle between 10° and 80°). Remarkably, askew ridges are extremely common.
The hillslope soil erosion map of the study area is shown in Figure 5. The mean annual soil erosion due to rill and sheet erosion is approximately 18.07 t ha–1 a–1, and the average soil loss amounts to 45.60 × 10⁴ t in 2013 in the study area. The statistical results of soil loss (Table 3) show that 4.52% of the watershed area belongs to the severe or violent erosion class. Intense erosion occurs in 5.57% of the study area, while 12.42% of land is affected by moderate erosion. Overall, tiny and slight erosion dominated the region by covering 33.77% and 43.71% of the study area, respectively. However, with respect to the total amount of soil loss, only 1.42% of the total soil erosion occurred in tiny erosion areas, while slight erosion contributed to 23.56% of total soil loss. The moderate erosion area shows the largest amount of soil loss. In the study area, 50.07% and 10.09% of the total soil loss was observed under intense to violent erosion, respectively.

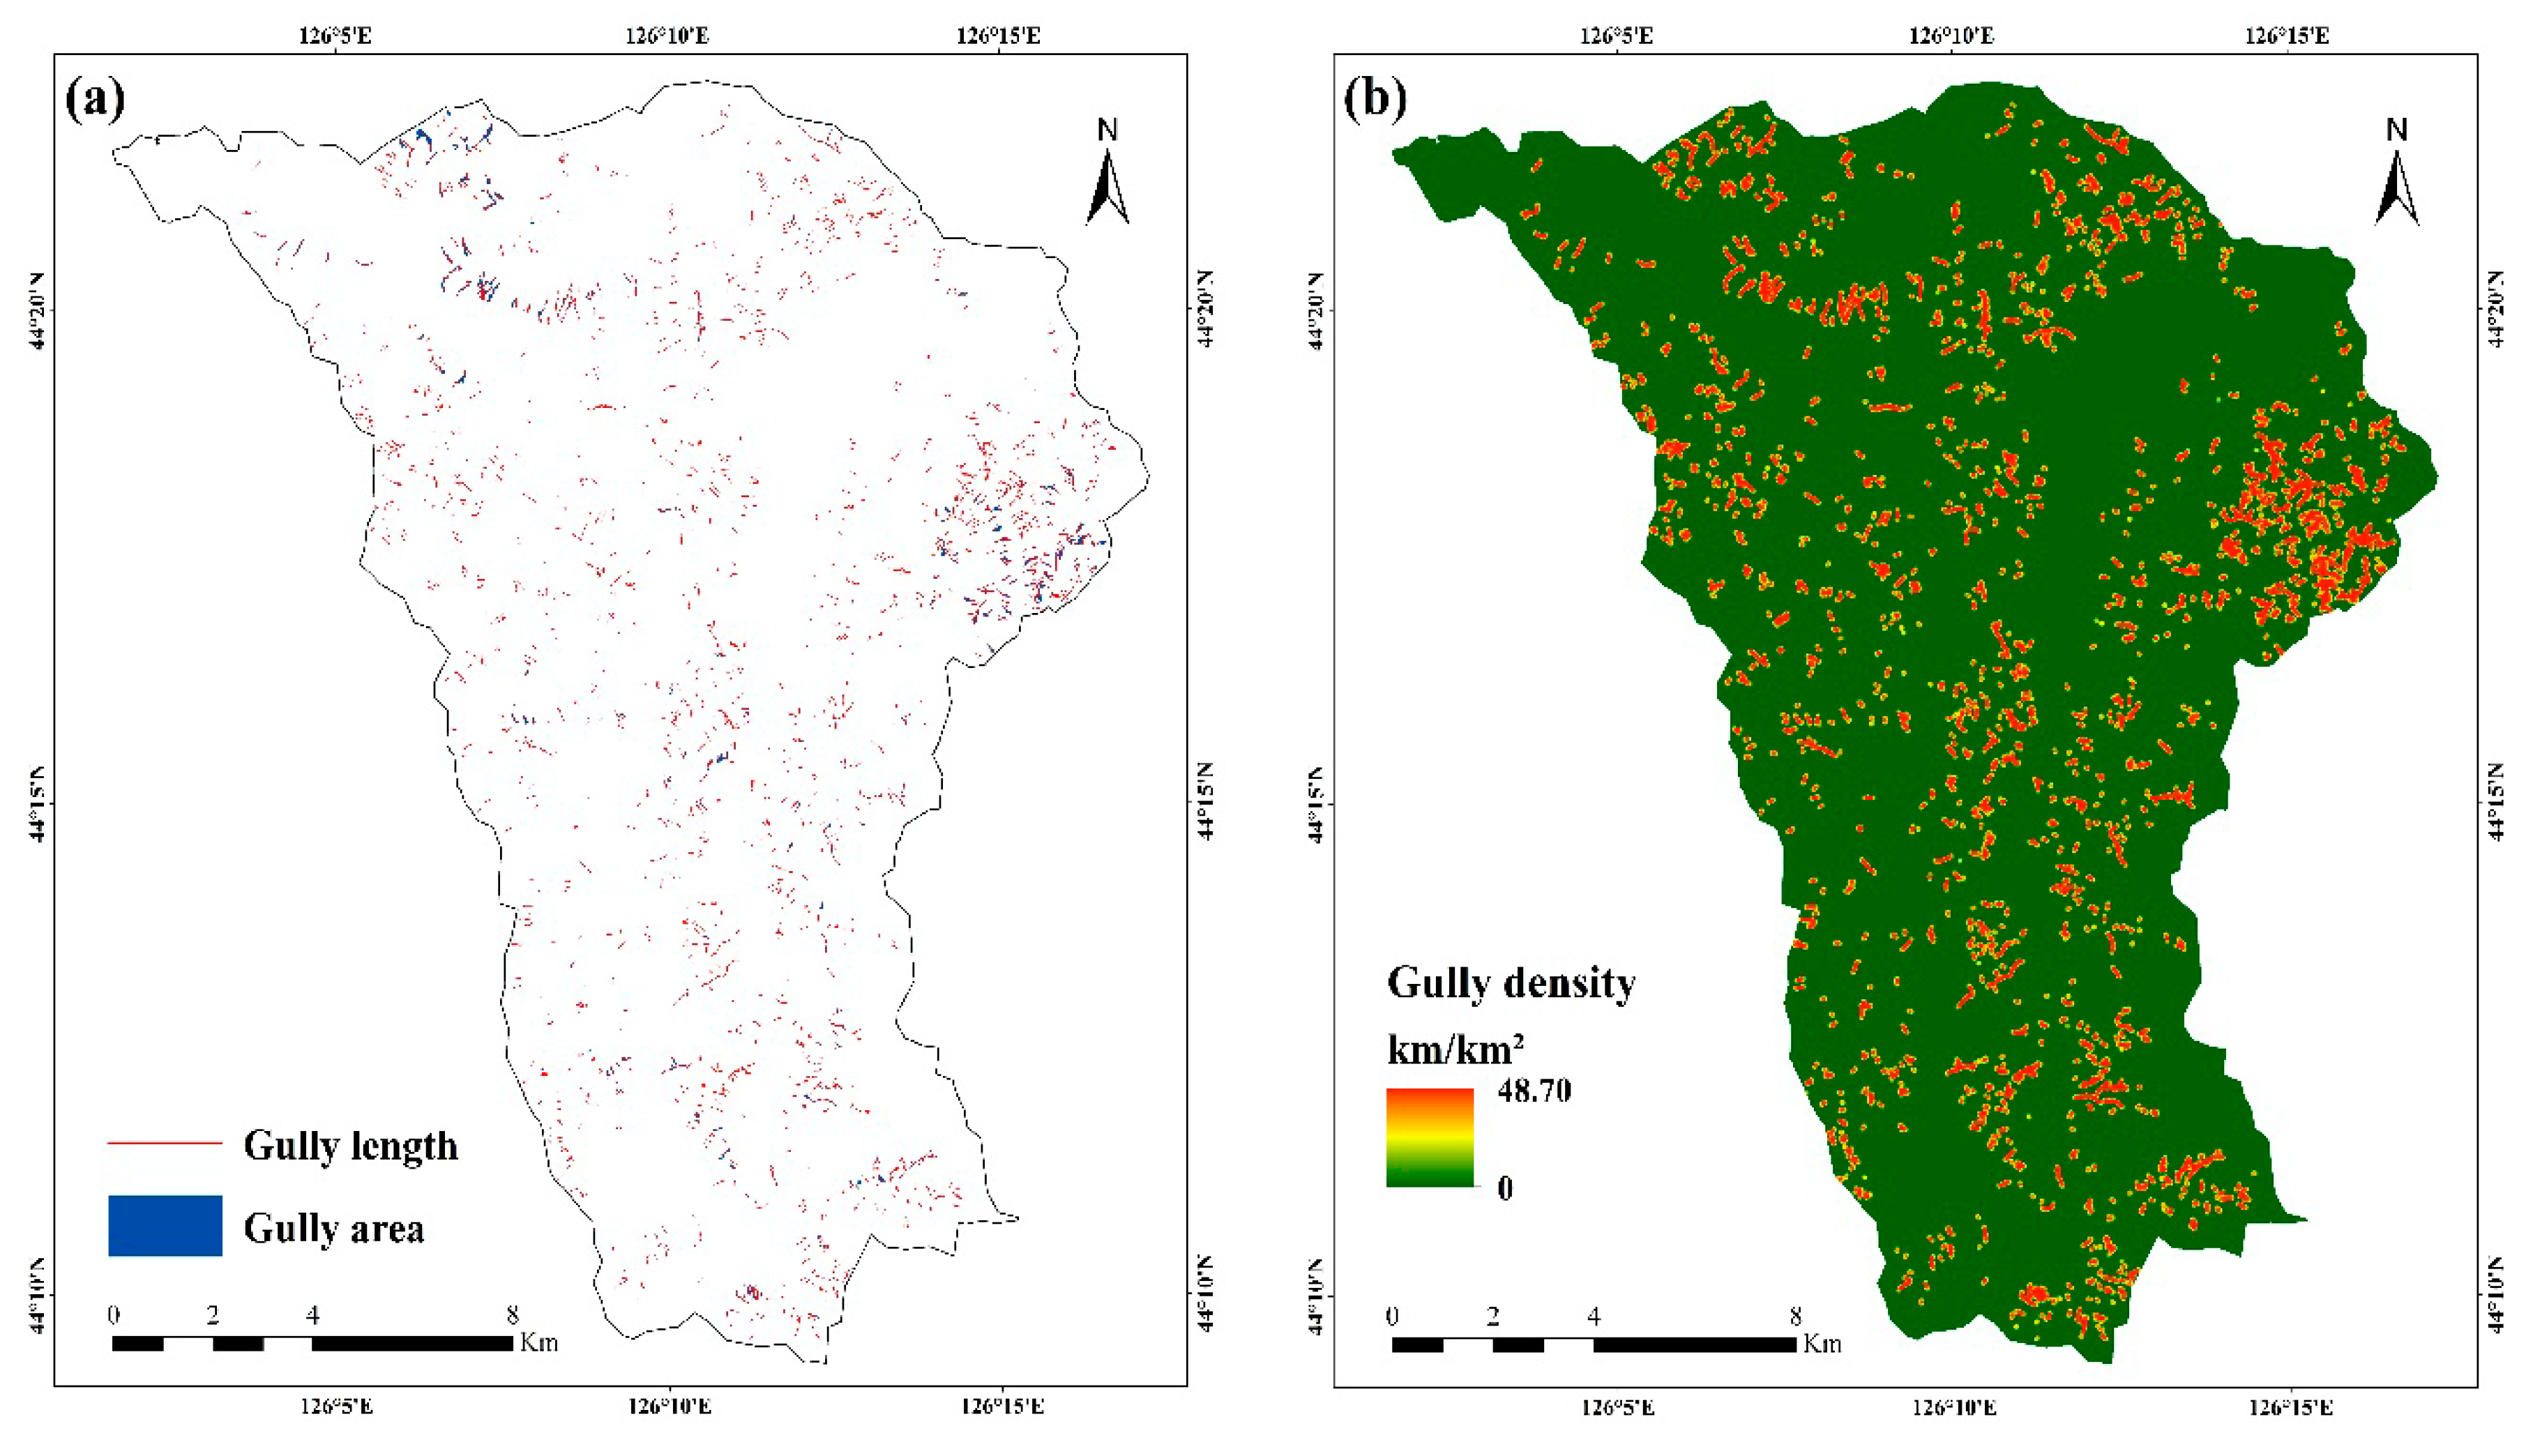
3.2. Estimation of Gully Erosion

The status of gully erosion in the study area is shown in Table 4. There are 1674 erosion gullies in the study area, among which 859 (more than half of the total) were erosion gullies with a width less than 3 pixels. This result indicated that the gully erosion is still relatively active in the study area. We assumed that these narrow gullies would further develop and become intensified erosion without any protection. In 2013, the gully density of the whole area was 1.07 km/km2 (gully length per unit area), and the total area and length were 1,409,219 m2 and 271.08 km, respectively. Figure 6b shows that the gully density ranged from 0 to 48.70 km/km2, and denser gully distribution was found in the northeastern part, where gully erosion was most serious.
In addition, the erosion gullies, located in the cultivated land, occupied 79% of the total length, and the gully density was 1.65 km/km2 for the whole farmland. Places within a certain distance from the erosion gully were not suitable for farming, which would accelerate the erosion [14]. Therefore, the cultivated land areas engulfed, destroyed, and affected by gully erosion were much larger than 60.78 hm2, which is the gully area in farmland. These results indicate that the study area suffered more serious gully erosion, which mainly occurs in cultivated land.

4. Discussion

4.1. Implementation of the RUSLE Model and Visual Image Interpretation

RUSLE has enhanced soil loss predication capabilities and can be applied to natural environmental conditions [23], compared with the USLE model, which was developed initially for field crops in agricultural areas [22]. RUSLE estimates long-term average annual soil erosion amounts in a variety of environments, such as agriculture, forest, rangeland, mining sites, and construction sites [74]. The USLE/RUSLE model is considered adaptable for estimation of soil erosion by water in the black soil region of Northeast China, where long slope length and gentle slope are the main topographical features [9,13,75,76]. However, RUSLE may provide extremely high soil erosion predictions [31]. To validate the RUSLE model, this study selected the existing observations from previous research to examine the results. Zhang et al. (1992) monitored soil loss of different plots for many years in the experimental areas of Keshan and Binxian, which are also located in the black soil region [9]. This study obtained grids consistent with the conditions of four plots in the experimental areas using raster calculator and zonal statistics tools in ArcGIS. The average calculated values of soil loss of these grids were compared with the observed values in the plots (Table 5). The calculated values were significantly higher than the observed ones, with an average deviation of 72.85% in the last three plots, while the calculation was close to the observation in the first plot. The results suggest that the RUSLE model likely overestimates the erosion rate in dry land even though the rainfall erosivity (R) factor values in the Mushi River subcatchment were significantly higher than those in Keshan and Binxian [77].
The seven meteorological stations were distributed around the study area evenly (Figure 1c). With the existence of spatial dependence, the rainfall erosivity (R) factor can be estimated for the non-sampled locations through spatial interpolation. As one of the most effective interpolation methods, the ordinary Kriging method used the point data of these stations to produce a continuous surface covering the study area. However, it was difficult to obtain a very high resolution and accurate spatial distribution map of the rainfall erosivity (R) factor with raster format by spatial interpolation because the meteorological stations were scarce within the basin [78]. Integration of multi-source rainfall data to improve the accuracy of spatial interpolation needs further consideration in the future. In addition, the very poor resolution of the soil map constrained the results significantly. A more precise soil map would improve the accuracy of the model calculation results in the future. Nevertheless, the high accuracy of LULS maps and high-resolution images contribute to the overall improvement of the erosion model [29]. Compared with other methods for calculating the P factor in the black soil region of Northeast China [9,13,79], the calculation accuracy of the P factor for ridge tillage in this study was improved.
Pleiades imagery showed a good feasibility for the recognition of ephemeral gully in this study. The results indicate that sub-meter-resolution remote sensing images have great potential for gully mapping [57]. However, this study only focuses on the length and area of the gully, ignoring gully volume, which is also an important factor for the determination of sediment yield from gully erosion. Application of remote sensing to extract the gully volume should be given further consideration. With respect to high spatial resolution satellite images (Pleiades-1A), although the visual interpretation method with field verification obtained satisfactory results in mapping gullies, (semi-)automatic mapping of gullies at a regional scale will be a future research direction [53,80,81].

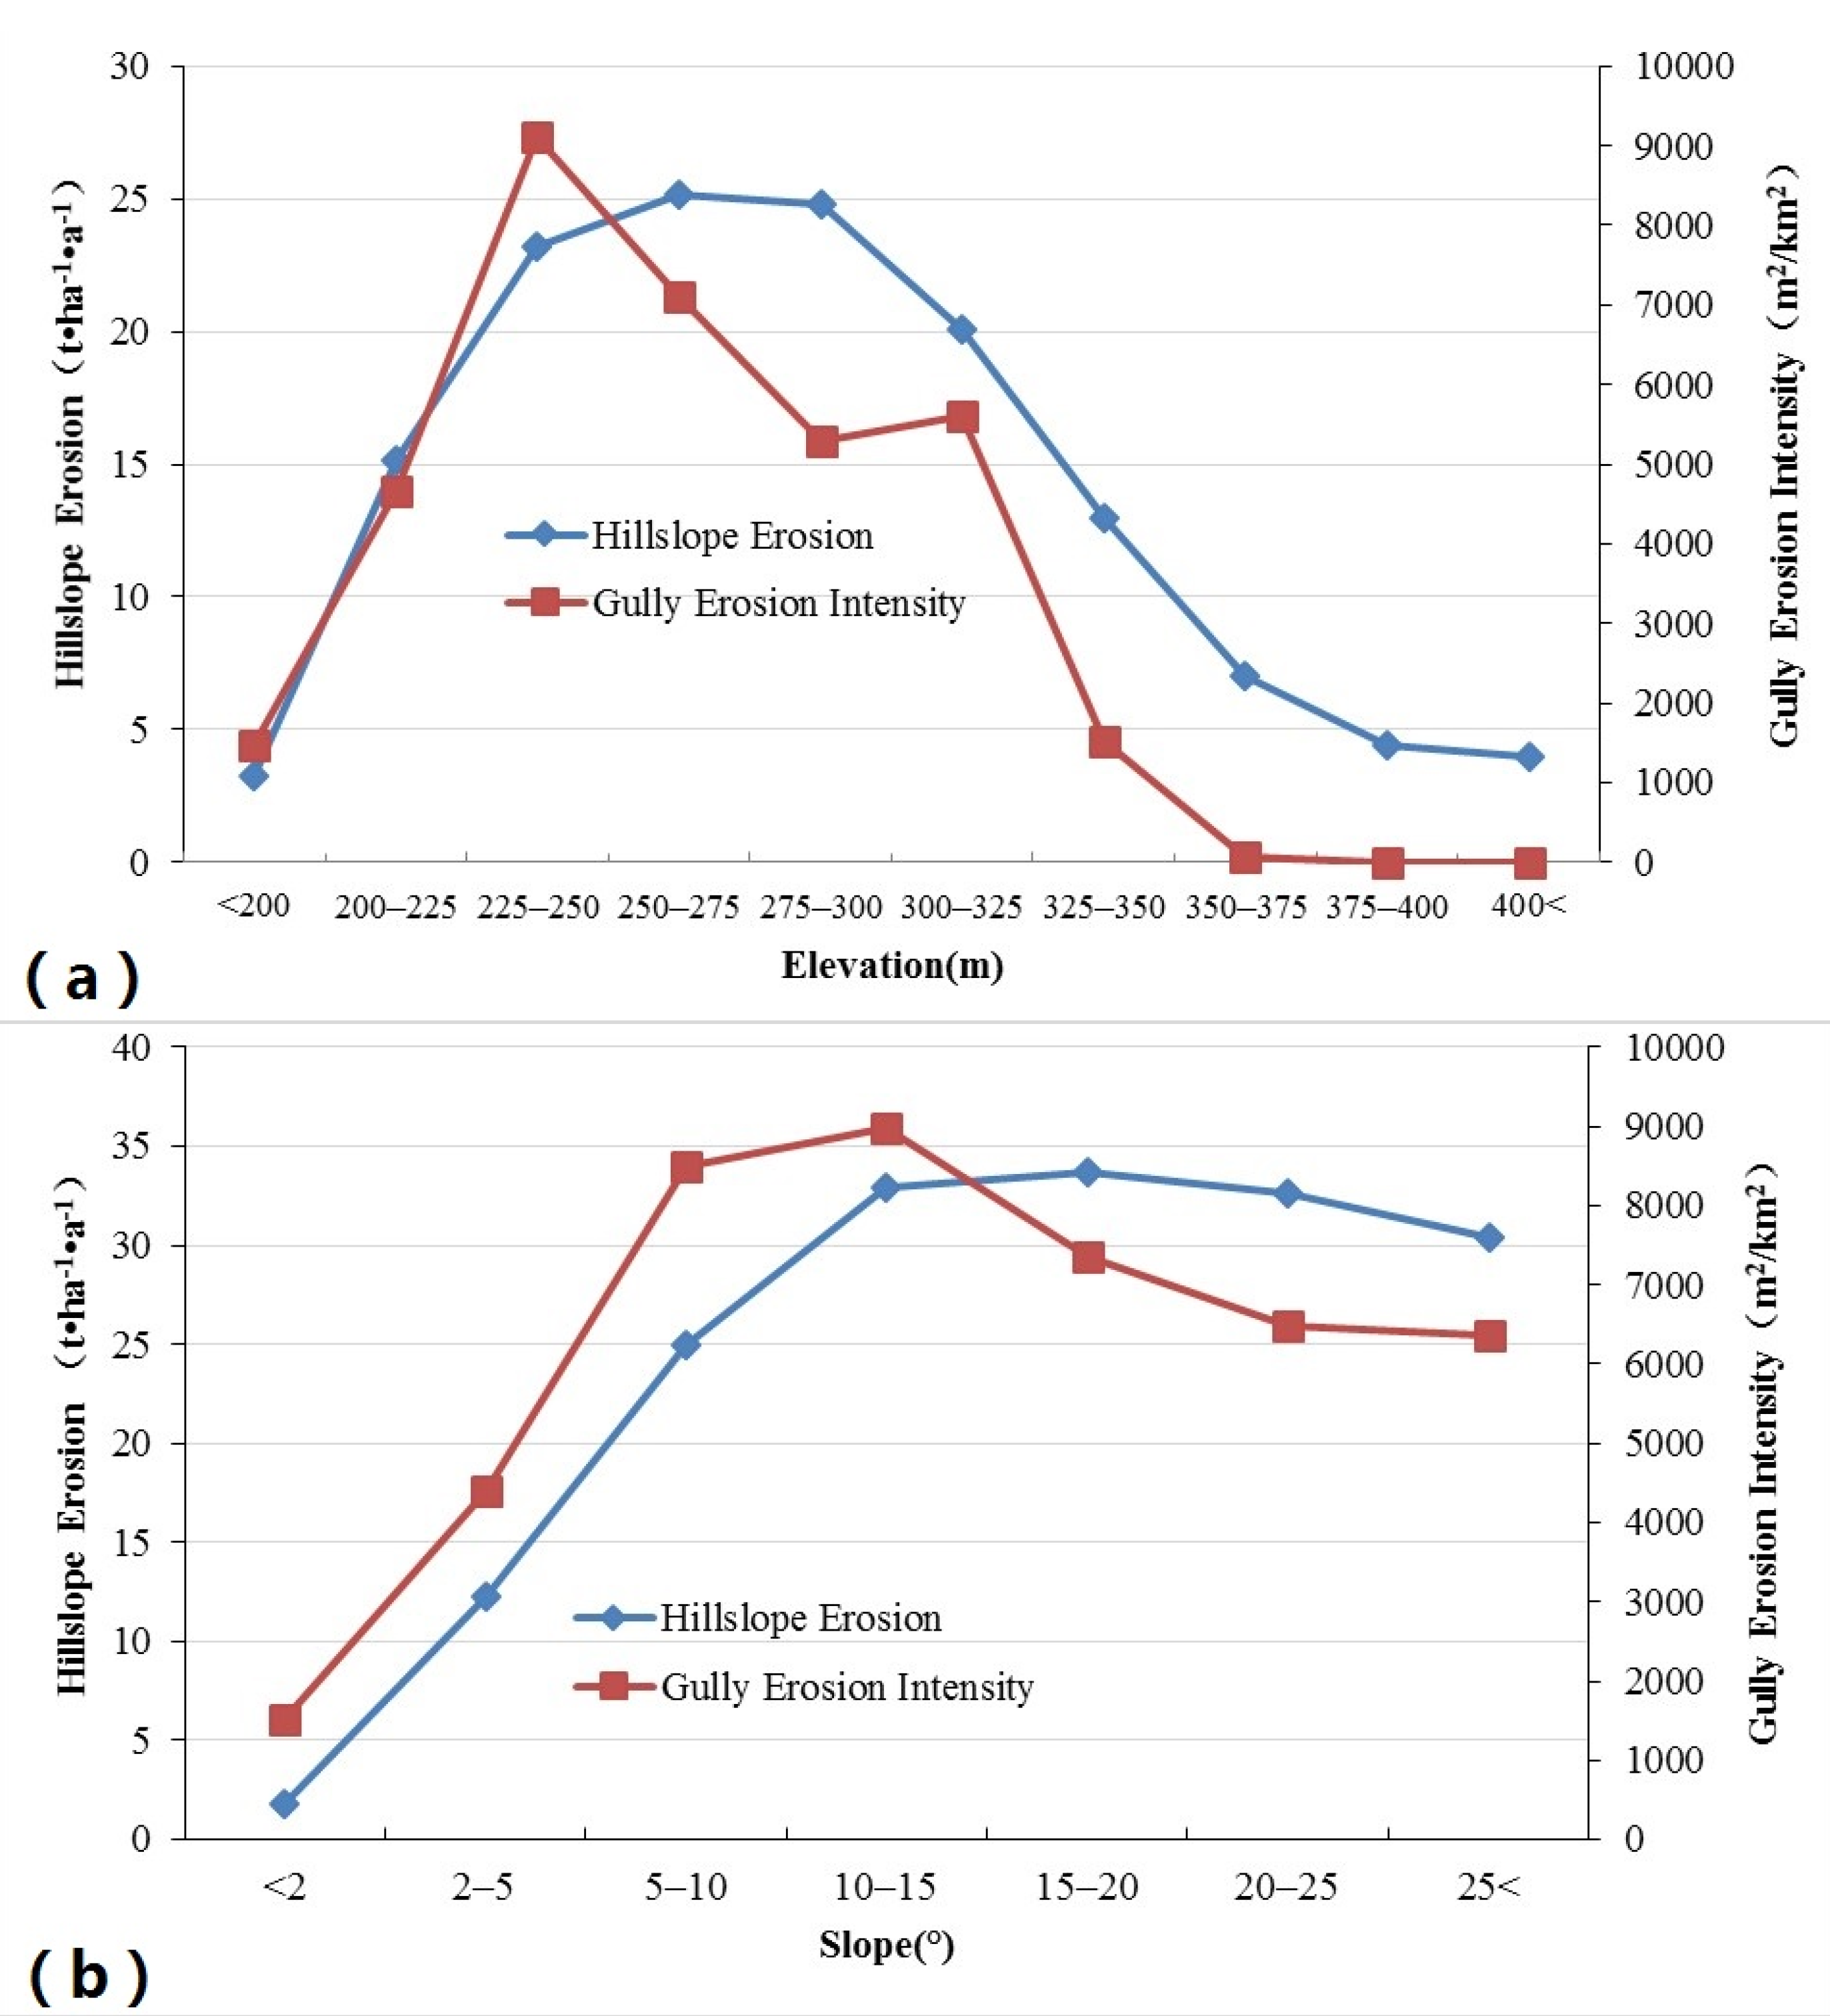
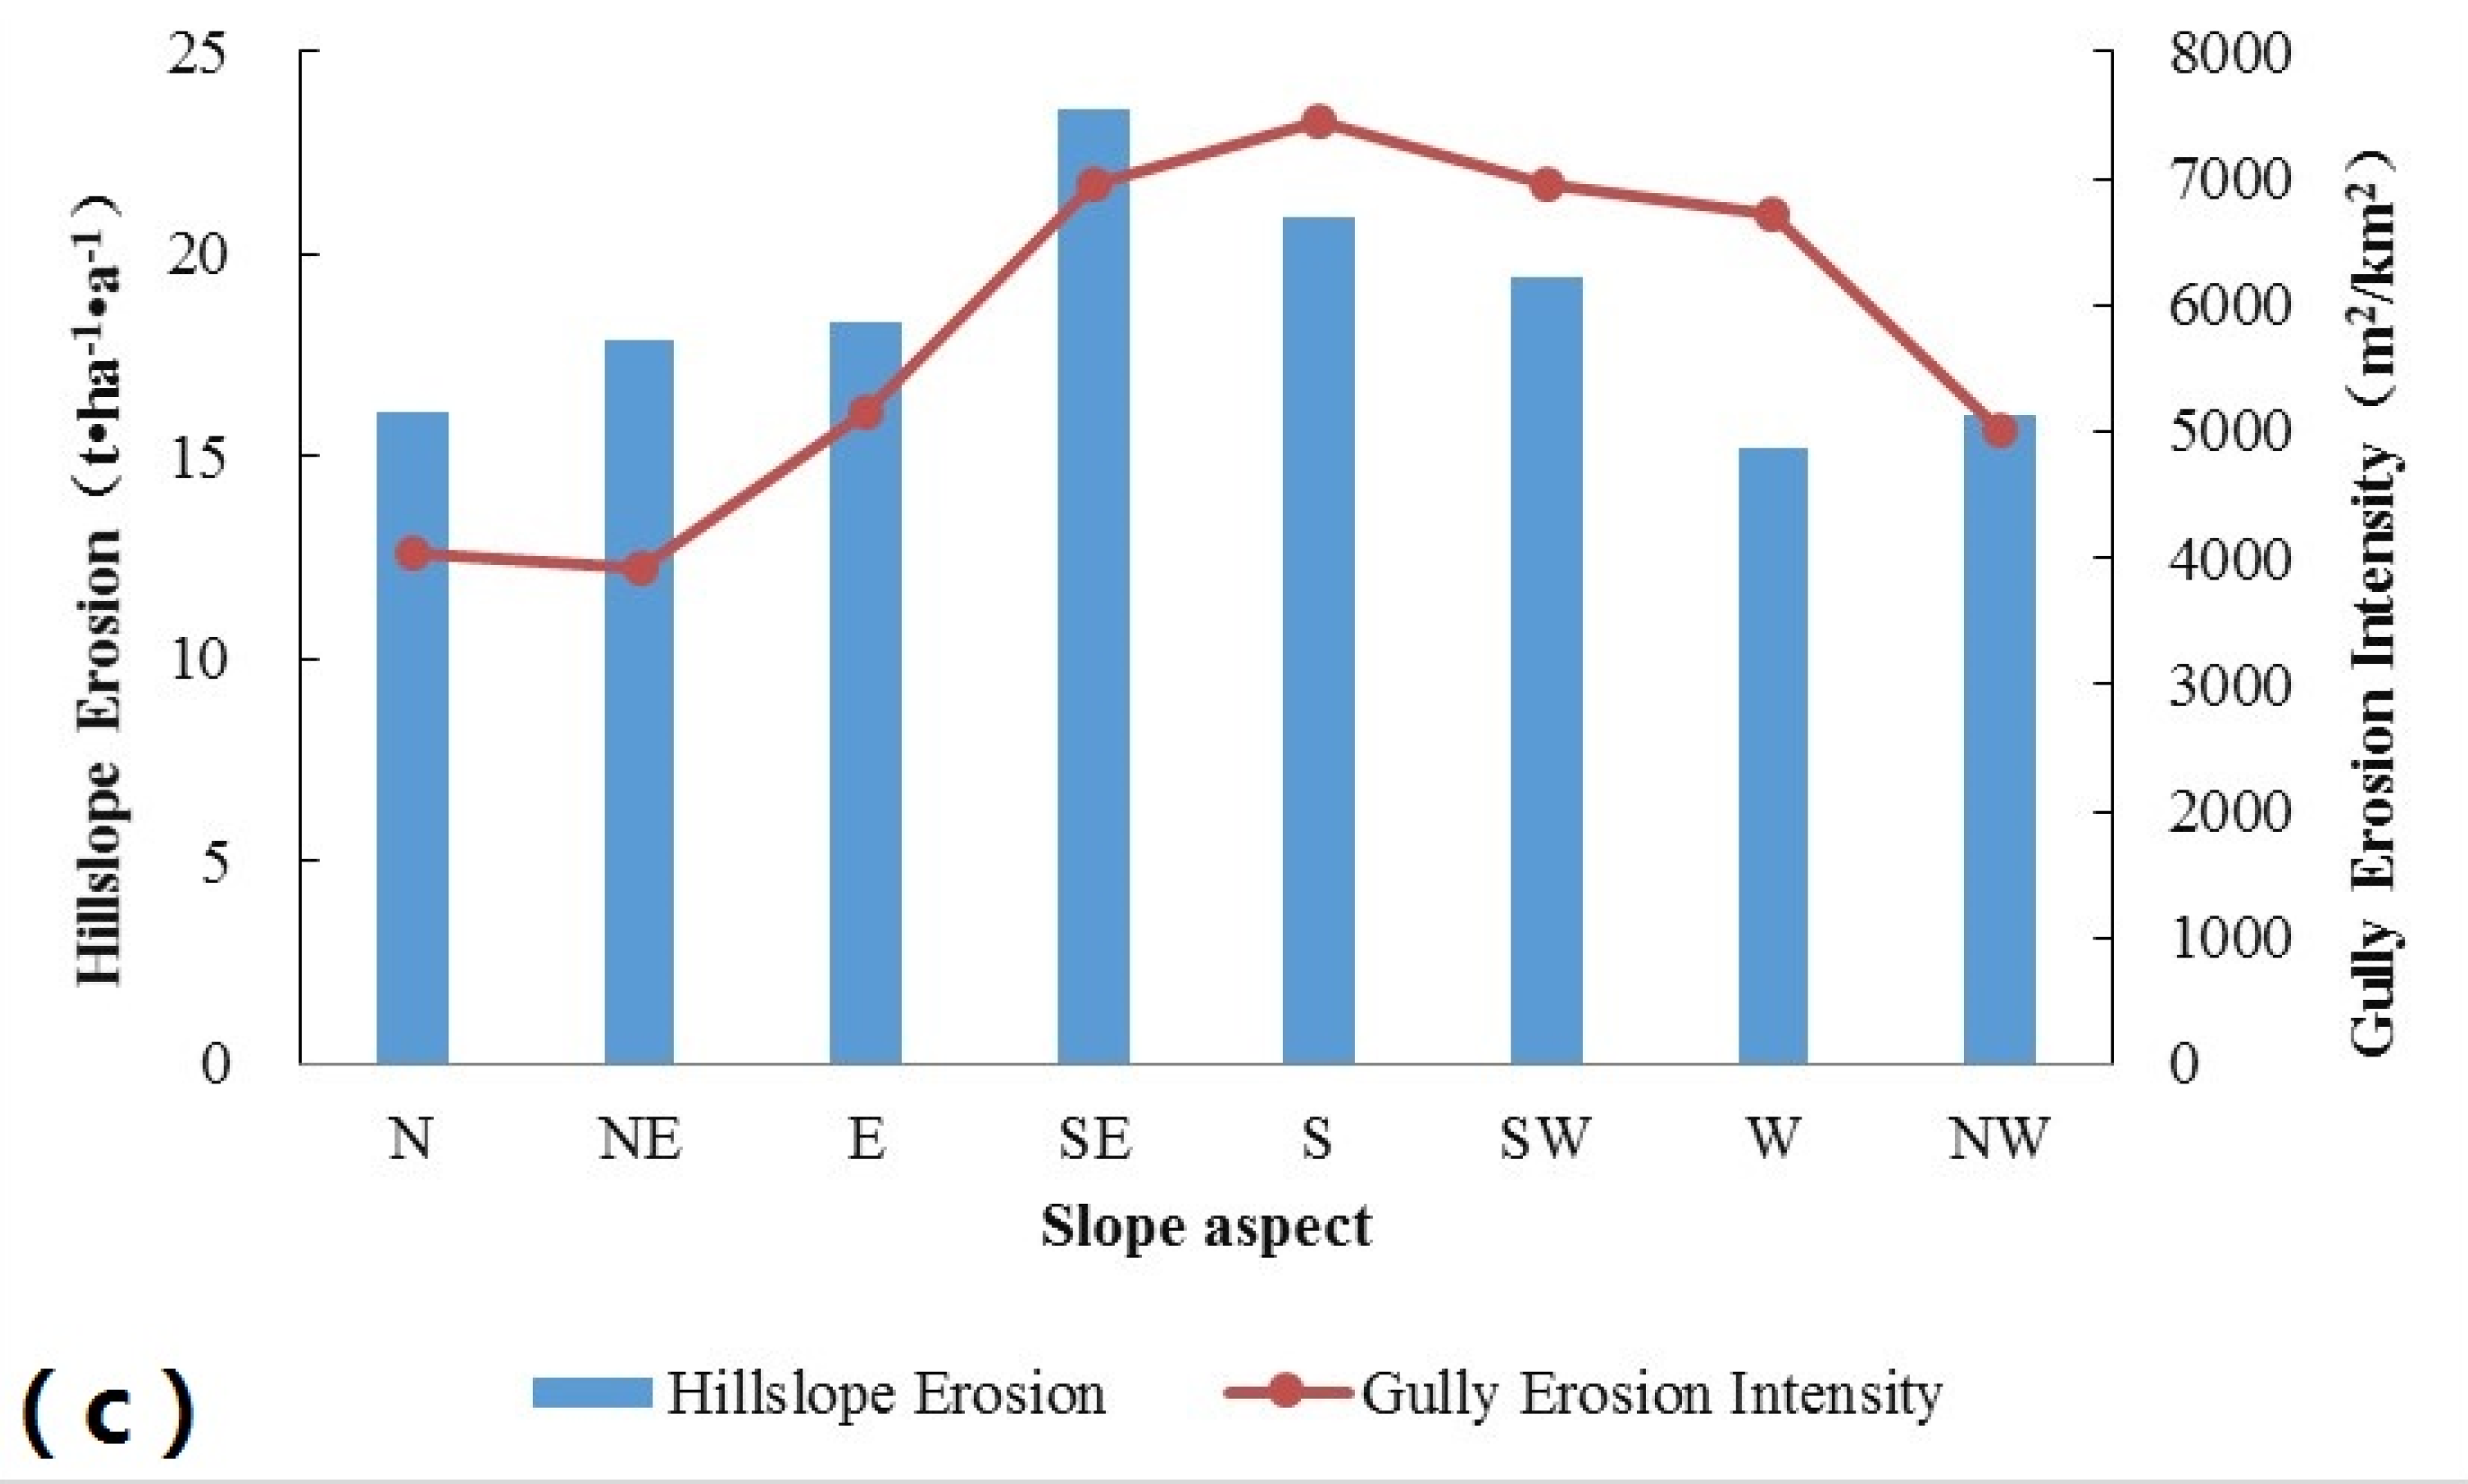
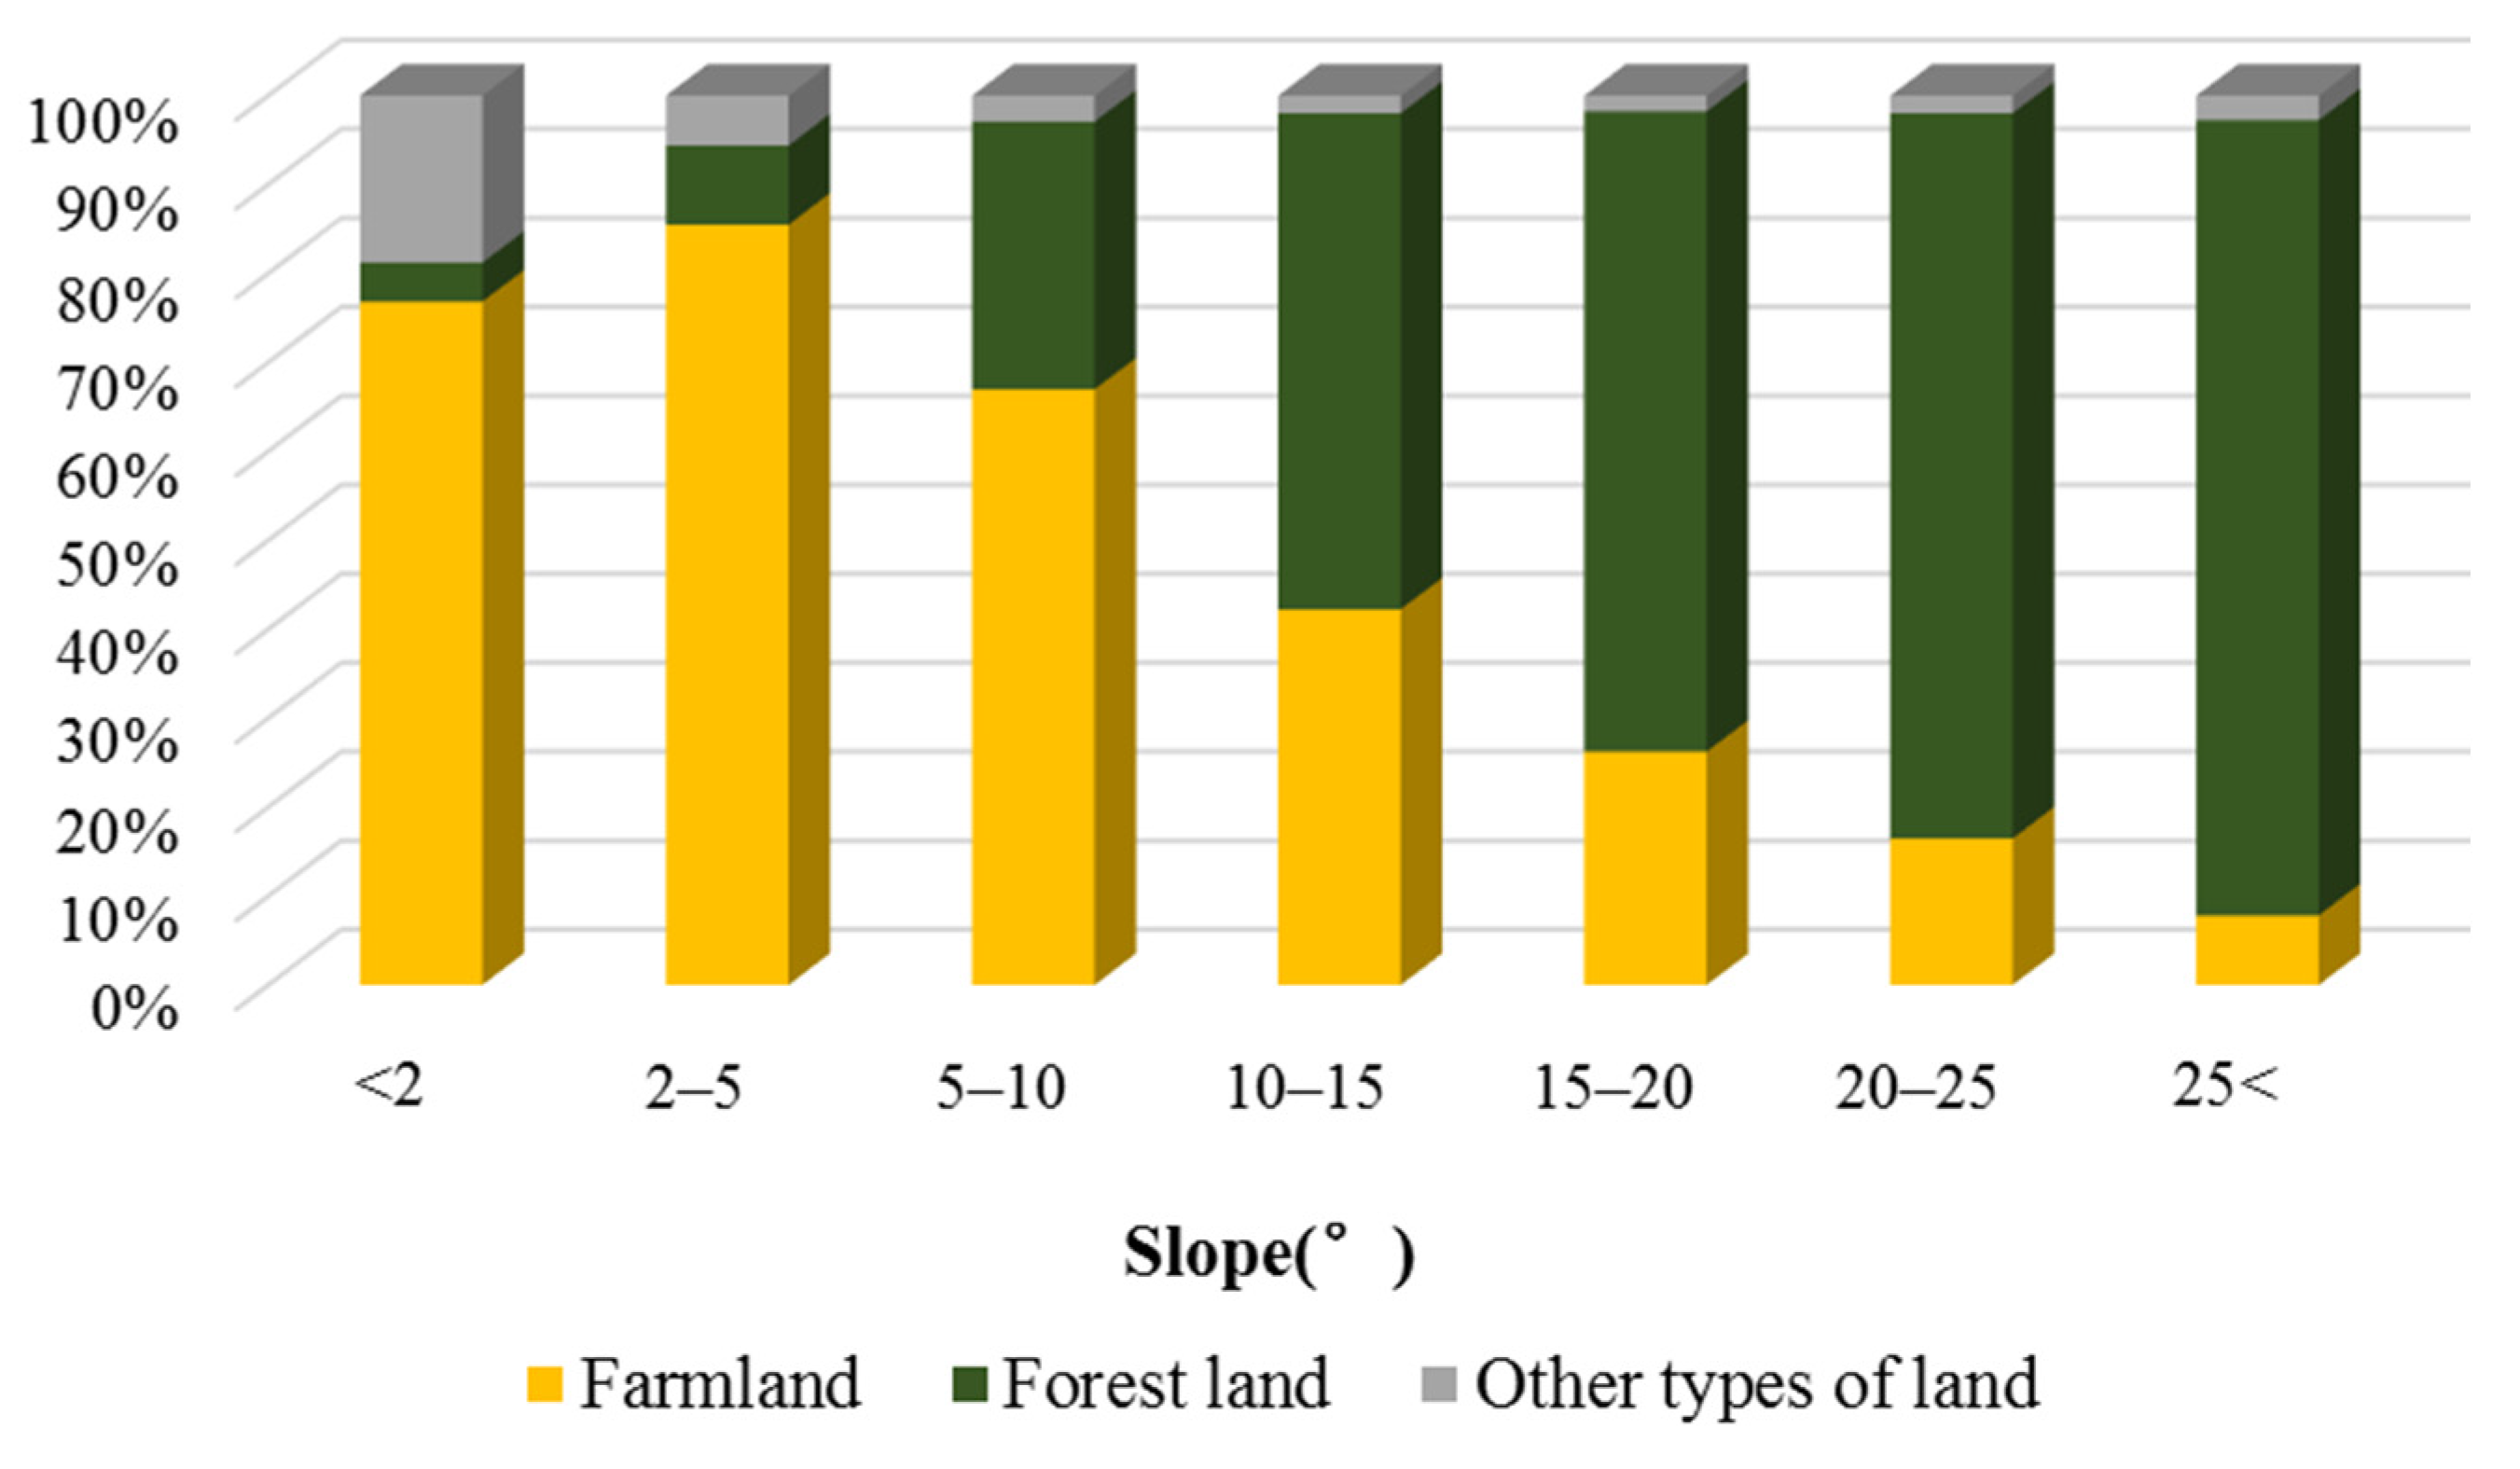
4.2. Topographic Differentiation of Hillslope and Gully Erosion

The differentiation of hillslope and gully erosion on various elevations is demonstrated in Figure 7a. In the vertical direction, the hillslope and gully erosion showed a layered distribution, increasing first and then decreasing as the altitude increases. This result indicates that the geomorphic types of lower elevations (e.g., valley plain) were dominated by modern deposition. No significant erosion occurs at higher elevations (e.g., hill) due to the small catchment area, while slope land between the abovementioned regions was the main level of the occurrence and distribution of soil erosion [66]. Moreover, the magnitude of gully erosion intensity (at 225–250 m) was lower than that of hillslope erosion intensity (at 250–275 m). We assume that, compared to slope erosion, gully erosion is not only affected by the slope but also by the catchment area and other topographic factors. The lower slope land is more conducive to the formation and development of gully erosion due to a longer slope and larger catchment area [10,56].
The relation of hillslope and gully erosion on different slope is shown in Figure 7b. When the slope was less than 10–15 degrees, the hillslope erosion and gully erosion intensity both increased significantly with increasing slope. However, the hillslope erosion slightly decreased in steeper slopes at 20–25 degrees with an inverse trend. Forest land plays a predominant role in the control of soil loss compared with farmland. Although with increasing slope gravity-caused soil erosion increased and very steep slopes did not hold much soil [31], the dominant position of forest land gradually increased such that the proportion even exceeded 80% at 20–25 degrees (Figure 8), and forest land reduced the soil loss. When the slope was greater than 15 degrees, the gully intensity decreased significantly as the slope increased. Although the steeper slope will increase the shear force of the soil particles [67], the slope is not the main factor restricting erosion; it is more affected by slope length, catchment area, slope shape, and other terrain factors [16] when the slope is greater than 15 degrees.
The relation of hillslope and gully erosion depending on different slope aspects was analyzed (Figure 7c). The results indicate that slope aspect has a consistent influence on gully erosion intensity and hillslope erosion. The hillslope and gully erosion on a sunny slope (S, SE, SW) were stronger than those on a shady slope (N, NE, NW) considering the monsoons, total solar radiation, diurnal temperature difference, and freezing and thawing [10].

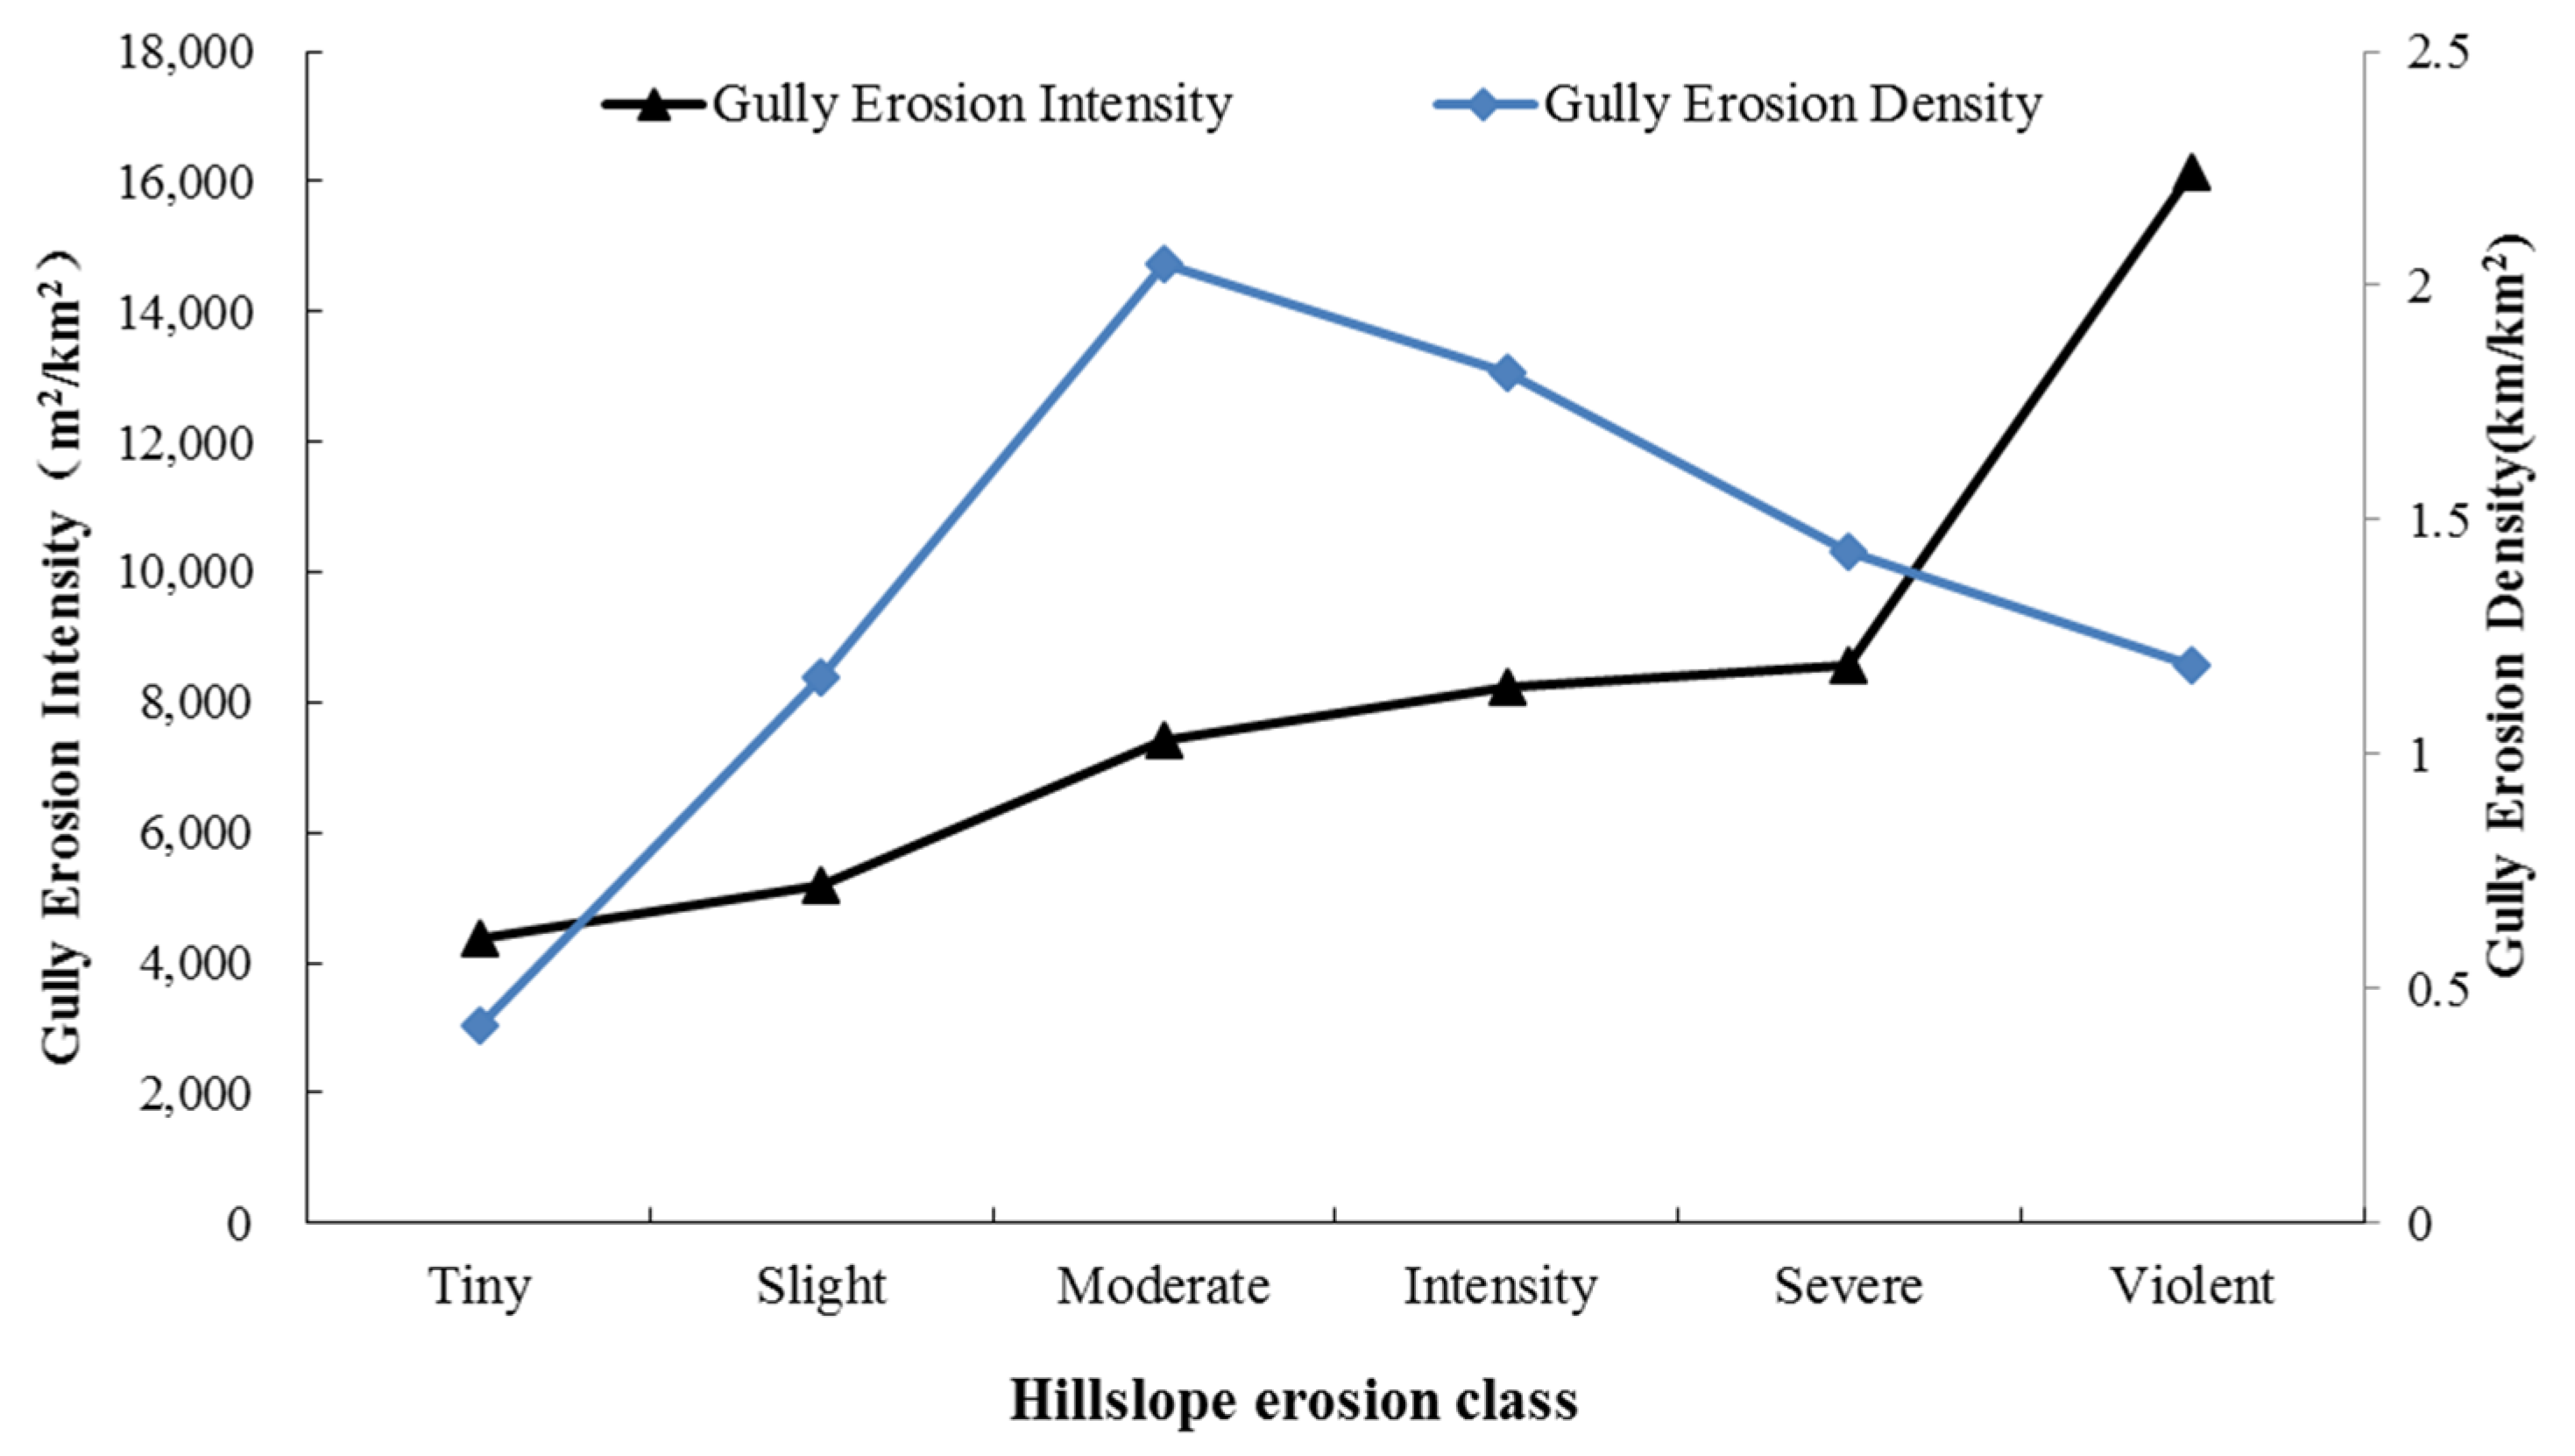
4.3. The Relationship between Gully and Hillslope Erosion

The relationship between hillslope and gully erosion is illustrated in Figure 9. Gully erosion density and intensity represent gully length and area per unit area, respectively. The variation of gully erosion intensity and density is not consistent with soil erosion intensity. Gully intensity increases with slope erosion intensity, in particular rapidly increasing in the severe–violent erosion area. Gully erosion density reaches a peak at moderate erosion and then begins to decrease. This finding indicates that the control measures of hillslope erosion can effectively prevent the formation and development of erosion gully in the slight–moderate erosion area [16]. However, the control measures need to be combined with other prevention and cure measures for gully erosion in moderate–violent erosion regions, where the lateral erosion of the gully erosion is significant, which results in notable widening of ditch sides and an increase in the area.

5. Conclusions

To our knowledge, this study was one of the first studies to attempt to integrate gully erosion and hillslope erosion. The following main conclusions can be drawn: (1) although the study area as a whole had slight erosion due to rill and sheet erosion, the catchment suffered more serious gully erosion, which mainly occurred in the cultivated land; (2) GCM contributed to the overall improvement of the RUSLE model soil erosion assessment, particularly the C and P factor mapping and the recognition of ephemeral gully, in hilly black soil regions of Northeast China in which slope farmland is dominant. However, the RUSLE model likely overestimates the erosion rate in dry land; (3) topographic differentiation characteristics of hillslope and gully erosion are not completely similar. The hillslope and gully erosion were stronger on a sunny slope than on a shady slope, and occurred and distributed mainly at slope land of middle elevations. When the slope was greater than 15 degrees, the slope was not the main factor restricting the erosion, while at steeper slopes, the dominant forest land significantly reduced the soil loss; (4) trends of gully erosion intensity and density are not consistent with the change in soil erosion intensity. The control measures of hillslope erosion can effectively prevent the formation and development of erosion gully in the slight–moderate erosion area, but in moderate–violent erosion regions the measures need to be combined with other prevention measures for gully erosion.
The findings of this study contribute decisively towards improving our ability to better understand the spatial coupling relationships between hillslope erosion and gully erosion. The present study also indicates that using GCM, RS, and GIS technologies simultaneously results in an effective assessment of hillslope and gully erosion in a considerably short time and at low cost for large watersheds. The results might be helpful for decision makers developing sustainable land use plans and comprehensive soil and water conservation management in the study area.

Acknowledgments

This research was funded by the National Natural Science Foundation of China (No. 41271416; 41301467) and the research project of the Jilin Province Geographical Conditions Monitoring Engineering Research Center. The paper was completed with support from the Jilin Province Geomatics Center. The authors would like to thank Tingxiang Liu, Fei Li, Cong Guan, Qing Wang, and Dan Chen for their fieldwork. The authors also thank Bolin Fu, Yuanyuan Yang, Bing Zhang, and Chen Cao for valuable suggestions and writing assistance.

Author Contributions

Ranghu Wang, Shuwen Zhang, and Jiuchun Yang designed the research; Ranghu Wang and Luoman Pu processed and analyzed the data; Luoman Pu, Chaobin Yang, Lingxue Yu, Liping Chang, and Kun Bu collected the data; Ranghu Wang wrote the paper.

Conflicts of Interest

The authors declare no conflict of interest.

References

  1. Rahman, M.R.; Shi, Z.H.; Cai, C.F. Soil erosion hazard evaluation—An integrated use of remote sensing, GIS and statistical approaches with biophysical parameters towards management strategies. Ecol. Model. 2009, 220, 1724–1734. [Google Scholar] [CrossRef]
  2. Oldeman, L.R. The global extent of soil degradation. In Soil Resilience and Sustainable Land Use; CAB International: Wallingford, CT, USA, 1994; pp. 99–118. [Google Scholar]
  3. Lin, C.; Zhou, S.L.; Wu, S.H.; Liao, F.Q. Relationships between intensity gradation and evolution of soil erosion: A case study of Changting in Fujian province, china. Pedosphere 2012, 22, 243–253. [Google Scholar] [CrossRef]
  4. Kirkby, M. Sustaining the Global Farm. Available online: http://topsoil.nserl.purdue.edu/nserlweb-old/isco99/pdf/ISCOdisc/tableofcontents.htm (accessed on 25 March 2016).
  5. Liverman, D.; Rockström, J.; Visbek, M.; Leemans, R.; Abrahamse, T.; Becker, B.; D’Sousa, R.; Jones, K.; Mooney, H.; Niang, I. Future earth initial design. Available online: http://www.icsu.org/future-earth/media-centre/relevant_publications/future-earth-initial-design-report (accessed on 25 March 2016).
  6. Song, Y. Eco-environment protection and construction of green community in northeast china. Sci. Geogr. Sin. 2002, 22, 655–659. (In Chinese) [Google Scholar]
  7. Liu, B.; Yan, B.; Shen, B.; Wang, Z.; Wei, X. Current status and comprehensive control strategies of soil erosion for cultivated land in the Northeastern black soil area of China. Sci. Soil Water Conserv. 2008, 6, 1–8. (In Chinese) [Google Scholar]
  8. Zhang, X.; Liang, A.; Shen, Y.; Li, W.; Zhang, X.; Wang, Y.; Xie, Y.; Liu, F.; Yang, X. Erosion characteristics of black soils in northeast china. Sci. Geogr. Sin. 2006, 26, 687–692. (In Chinese) [Google Scholar]
  9. Zhang, X.; Xu, J.; Lu, X.; Deng, Y.; Gao, D. A study on the Soil Loss Equation in Heilongjiang Province. Bull. Soiland Water Conserv. 1992, 12, 1–10. (In Chinese) [Google Scholar]
  10. Yan, Y.; Zhang, S.; Li, X.; Yue, S. Temporal and spatial variation of erosion gullies in kebai black soil region of Heilongjiang during the past 50 years. Acta Geogr. Sin. 2005, 60, 1015–1020. (In Chinese) [Google Scholar]
  11. Wu, Y.; Cheng, H. Monitoring of gully erosion on the loess plateau of china using a global positioning system. Catena 2005, 63, 154–166. (In Chinese) [Google Scholar] [CrossRef]
  12. Hu, G.; Wu, Y.; Liu, B.; Yu, Z.; You, Z.; Zhang, Y. Short-term gully retreat rates over rolling hill areas in black soil of northeast china. Catena 2007, 71, 321–329. [Google Scholar] [CrossRef]
  13. Zhang, S.; Wang, W.; Li, Y.; Bu, K.; Yan, Y. Dynamics of hillslope soil erosion in the sanjiang plain in the past 50 years. Resour. Sci. 2008, 30, 843–849. (In Chinese) [Google Scholar]
  14. Wang, W.; Zhang, S.; Deng, R. Gully status and relationship with landscape pattern in black soil area of northeast china. Trans. Chin. Soc. Agr. Eng. 2011, 27, 192–198. (In Chinese) [Google Scholar]
  15. Sheng, M.; Fang, H.; Guo, M. Modeling soil erosion and sediment yield using watem/sedem model for the black soil region of northeast china. Resour. Sci. 2015, 37, 815–822. (In Chinese) [Google Scholar]
  16. Wang, W.; Zhang, S.; Fang, H. Coupling mechanism of slope-gully erosion in typical black soil area of northeast china. J. Nat. Resour. 2012, 27, 2113–2122. (In Chinese) [Google Scholar]
  17. Zhang, J.X.; Li, W.S.; Zhai, L. Understanding geographical conditions monitoring: A perspective from china. Int. J. Digit Earth 2015, 8, 36–55. [Google Scholar] [CrossRef]
  18. Osman, K.T. Soil erosion by water. In Soil degradation, conservation and remediation; Springer: Dordrecht, The Netherlands, 2014; pp. 69–101. [Google Scholar]
  19. Ghadiri, H. Crater formation in soils by raindrop impact. Earth Surf. Process. Landf. 2004, 29, 77–89. [Google Scholar] [CrossRef]
  20. Luffman, I.E.; Nandi, A.; Spiegel, T. Gully morphology, hillslope erosion, and precipitation characteristics in the Appalachian valley and ridge Province, Southeastern USA. Catena 2015, 133, 221–232. [Google Scholar] [CrossRef]
  21. Prasannakumar, V.; Shiny, R.; Geetha, N.; Vijith, H. Spatial prediction of soil erosion risk by remote sensing, gis and rusle approach: A case study of siruvani river watershed in Attapady valley, Kerala, India. Environ. Earth Sci. 2011, 64, 965–972. [Google Scholar] [CrossRef]
  22. Wischmeier, W.H.; Smith, D.D. Predicting Rainfall Erosion Losses—A Guide to Conservation Planning. Available online: http://naldc.nal.usda.gov/download/CAT79706928/PDF (accessed on 25 March 2016).
  23. Renard, K.G.; Foster, G.; Weesies, G.; McCool, D.; Yoder, D. Predicting Soil Erosion by Water: A Guide to Conservation Planning with the Revised Universal Soil Loss Equation (Rusle); United States Department of Agriculture: Washington, DC, USA, 1997; Volume 703.
  24. Laflen, J.M.; Lane, L.J.; Foster, G.R. Wepp: A new generation of erosion prediction technology. J. Soil Water Conserv. 1991, 46, 34–38. [Google Scholar]
  25. Morgan, R.P.C.; Quinton, J.N.; Smith, R.E.; Govers, G.; Poesen, J.W.A.; Auerswald, K.; Chisci, G.; Torri, D.; Styczen, M.E. The european soil erosion model (eurosem): A dynamic approach for predicting sediment transport from fields and small catchments. Earth Surf. Proc. Land 1998, 23, 527–544. [Google Scholar] [CrossRef]
  26. De Jong, S.; Paracchini, M.; Bertolo, F.; Folving, S.; Megier, J.; De Roo, A. Regional assessment of soil erosion using the distributed model semmed and remotely sensed data. Catena 1999, 37, 291–308. [Google Scholar] [CrossRef]
  27. Li, S.; Lobb, D.A.; Lindstrom, M.J.; Farenhorst, A. Tillage and water erosion on different landscapes in the northern north american great plains evaluated using 137 cs technique and soil erosion models. Catena 2007, 70, 493–505. [Google Scholar] [CrossRef]
  28. Zhang, X.; Xu, Q.; Pei, Y. Preliminary research on the bp networks foreasting model of watershed runoff and sediment yielding. Adv. Water Sci. 2001, 12, 17–22. (In Chinese) [Google Scholar]
  29. Alexakis, D.D.; Hadjimitsis, D.G.; Agapiou, A. Integrated use of remote sensing, GIS and precipitation data for the assessment of soil erosion rate in the catchment area of “yialias” in Cyprus. Atmos. Res. 2013, 131, 108–124. [Google Scholar] [CrossRef]
  30. Ozsoy, G.; Aksoy, E. Estimation of soil erosion risk within an important agricultural sub-watershed in Bursa, Turkey, in relation to rapid urbanization. Environ. Monit. Assess. 2015, 187, 1–14. [Google Scholar] [CrossRef] [PubMed]
  31. Karamesouti, M.; Petropoulos, G.P.; Papanikolaou, I.D.; Kairis, O.; Kosmas, K. Erosion rate predictions from pesera and rusle at a mediterranean site before and after a wildfire: Comparison & implications. Geoderma 2016, 261, 44–58. [Google Scholar]
  32. Pan, J.H.; Wen, Y. Estimation of soil erosion using rusle in Caijiamiao watershed, China. Nat. Hazards 2014, 71, 2187–2205. [Google Scholar] [CrossRef]
  33. Kumar, A.; Devi, M.; Deshmukh, B. Integrated remote sensing and geographic information system based rusle modelling for estimation of soil loss in western Himalaya, India. Water Resour. Manag. 2014, 28, 3307–3317. [Google Scholar] [CrossRef]
  34. Pandey, A.; Mathur, A.; Mishra, S.K.; Mal, B.C. Soil erosion modeling of a Himalayan watershed using RS and GIS. Environ. Earth Sci. 2009, 59, 399–410. [Google Scholar] [CrossRef]
  35. Biswas, S. Estimation of soil erosion using remote sensing and GIS and prioritization of catchments. Int. J. Emerg. Technol. Adv. Engs. 2012, 2, 124. [Google Scholar]
  36. Karydas, C.G.; Sekuloska, T.; Sarakiotis, I. Fine scale mapping of agricultural landscape features to be used in environmental risk assessment in an olive cultivation area. IASME Trans. 2005, 4, 582–589. [Google Scholar]
  37. Wang, W.; Zhang, S.; Li, Y.; Bu, K.; Yan, Y. Application of high-resolution images on soil loss quantitative estimation—A case of quickbird. Syst. Sci. Compr. Stud. Agr. 2008, 24, 441–446. (In Chinese) [Google Scholar]
  38. Merritt, W.S.; Letcher, R.A.; Jakeman, A.J. A review of erosion and sediment transport models. Environ. Model. Softw. 2003, 18, 761–799. [Google Scholar] [CrossRef]
  39. Kinnell, P. Event soil loss, runoff and the universal soil loss equation family of models: A review. J. Hydrol. 2010, 385, 384–397. [Google Scholar] [CrossRef]
  40. Kapalanga, T.S. A review of land degradation assessment methods. Land Restor. Train. Program. Keldnaholt 2008, 112, 17–68. [Google Scholar]
  41. Karydas, C.G.; Sekuloska, T.; Silleos, G.N. Quantification and site-specification of the support practice factor when mapping soil erosion risk associated with olive plantations in the mediterranean island of crete. Environ. Monit. Assess. 2009, 149, 19–28. [Google Scholar] [CrossRef] [PubMed]
  42. Poesen, J.; Nachtergaele, J.; Verstraeten, G.; Valentin, C. Gully erosion and environmental change: Importance and research needs. Catena 2003, 50, 91–133. [Google Scholar] [CrossRef]
  43. Casali, J.; Loizu, J.; Campo, M.A.; De Santisteban, L.M.; Alvarez-Mozos, J. Accuracy of methods for field assessment of rill and ephemeral gully erosion. Catena 2006, 67, 128–138. [Google Scholar] [CrossRef]
  44. Castillo, C.; Perez, R.; James, M.R.; Quinton, J.N.; Taguas, E.V.; Gomez, J.A. Comparing the accuracy of several field methods for measuring gully erosion. Soil Sci. Soc. Am. J. 2012, 76, 1319–1332. [Google Scholar] [CrossRef] [Green Version]
  45. Ionita, I. Gully development in the moldavian plateau of Romania. Catena 2006, 68, 133–140. [Google Scholar] [CrossRef]
  46. Hu, G.; Wu, Y.Q.; Liu, B.Y.; Zhang, Y.G.; You, Z.M.; Yu, Z.T. The characteristics of gully erosion over rolling hilly black soil areas of northeast china. J. Geogr. Sci. 2009, 19, 309–320. [Google Scholar] [CrossRef]
  47. Zhang, J.; Zheng, F.; Wen, L.; Yu, F.; An, J.; Li, G. Methodology of dynamic monitoring gully erosion process using 3d laser scanning technology. Bullet. Soil Water Conserv. 2011, 31, 89–94. (In Chinese) [Google Scholar]
  48. Xu, G.; Zhou, P. The application of stereoscopic photogrametry on ground in monitoring valley erosion evolution. Mem. NISWC Acad. Sin. 1988, 1, 97–102. (In Chinese) [Google Scholar]
  49. Vandekerckhove, L.; Poesen, J.; Govers, G. Medium-term gully headcut retreat rates in southeast spain determined from aerial photographs and ground measurements. Catena 2003, 50, 329–352. [Google Scholar] [CrossRef]
  50. Bouchnak, H.; Felfoul, M.S.; Boussema, M.R.; Snane, M.H. Slope and rainfall effects on the volume of sediment yield by gully erosion in the souar lithologic formation (Tunisia). Catena 2009, 78, 170–177. [Google Scholar] [CrossRef]
  51. Vrieling, A.; Rodrigues, S.; Bartholomeus, H.; Sterk, G. Automatic identification of erosion gullies with aster imagery in the Brazilian cerrados. Int. J. Rem. Sens. 2007, 28, 2723–2738. [Google Scholar] [CrossRef]
  52. Vrieling, A.; de Jong, S.M.; Sterk, G.; Rodrigues, S.C. Timing of erosion and satellite data: A multi-resolution approach to soil erosion risk mapping. Int. J. Appl. Earth Observ. Geoinform. 2008, 10, 267–281. [Google Scholar] [CrossRef]
  53. Shruthi, R.B.V.; Kerle, N.; Jetten, V.; Abdellah, L.; Machmach, I. Quantifying temporal changes in gully erosion areas with object oriented analysis. Catena 2015, 128, 262–277. [Google Scholar] [CrossRef]
  54. Gomez-Gutierrez, A.; Schnabel, S.; Berenguer-Sempere, F.; Lavado-Contador, F.; Rubio-Delgado, J. Using 3d photo-reconstruction methods to estimate gully headcut erosion. Catena 2014, 120, 91–101. [Google Scholar] [CrossRef]
  55. Stocker, C.; Eltner, A.; Karrasch, P. Measuring gullies by synergetic application of UAV and close range photogrammetry—A case study from Andalusia, Spain. Catena 2015, 132, 1–11. [Google Scholar] [CrossRef]
  56. Zhang, S.; Li, F.; Li, T.; Yang, J.; Bu, K.; Chang, L.; Wang, W.; Yan, Y. Remote sensing monitoring of gullies on a regional scale: A case study of kebai region in Heilongjiang Province, China. Chin. Geogr. Sci. 2015, 25, 602–611. [Google Scholar] [CrossRef]
  57. Li, H.; Zhang, X.; Liu, S.; Yury, K.; Kateryna, I.; Li, X.; Chen, Q. Evolvement of gully erosion in village scale in the typical black soil area. Sci. Soil Water Conserv. 2012, 10, 21–28. (In Chinese) [Google Scholar]
  58. Ma, Y.; Yan, P.; Wang, G.; Song, Y.; Wang, Y.; Yang, H.; Zhu, M. Preliminary results of gully erosion by remote sensing monitoring in Weiliantan, Gonghe basin, Qinghai Province. Res. Soil Water Conserv. 2009, 16, 1–5. (In Chinese) [Google Scholar]
  59. Li, Z.; Zhang, Y.; Yao, W.; Zhu, Q. Estimating gully development rates in hilly loess region of western shanxi province based on quickbird images. Trans. Chin. Soc. Agr. Eng. 2012, 28, 141–148. (In Chinese) [Google Scholar]
  60. Gong, Z.; Lei, W.; Chen, Z.; Gao, Y.; Zeng, S.; Zhang, G.; Xiao, D.; Li, S. Chinese soil taxonomy. Bullet. Chin. Acad. Sci. 2007, 21, 36–38. [Google Scholar]
  61. Sun, J.-M.; Liu, T. Desertification in the northeastern china. Quaternary Sci. 2001, 21, 72–78. [Google Scholar]
  62. Wu, Y.; Zheng, Q.; Zhang, Y.; Liu, B.; Cheng, H.; Wang, Y. Development of gullies and sediment production in the black soil region of Northeastern China. Geomorphology 2008, 101, 683–691. [Google Scholar] [CrossRef]
  63. Wischmeier, W.H.; Smith, D.D. Rainfall energy and its relationship to soil loss. Eos Trans. Am. Geoph. Union 1958, 39, 285–291. [Google Scholar] [CrossRef]
  64. Foster, G.; McCool, D.; Renard, K.; Moldenhauer, W. Conversion of the universal soil loss equation to si metric units. J. Soil Water Conserv. 1981, 36, 355–359. [Google Scholar]
  65. Williams, J.; Nearing, M.; Nicks, A.; Skidmore, E.; Valentin, C.; King, K.; Savabi, R. Using soil erosion models for global change studies. J. Soil Water Conserv. 1996, 51, 381–385. [Google Scholar]
  66. Li, T. A Cause Study and Module Simulation of Gully erosion in Black Soil Region. Ph.D.’s Thesis, Graduate University of Chinese Academy of Sciences (Northeast Institute of Geography and Agroecology), Beijing, China, 2012. [Google Scholar]
  67. Ranzi, R.; Le, T.H.; Rulli, M.C. A rusle approach to model suspended sediment load in the Lo River (Vietnam): Effects of reservoirs and land use changes. J. Hydrol. 2012, 4223, 17–29. [Google Scholar] [CrossRef]
  68. Hickey, R. Slope angle and slope length solutions for GIS. Cartography 2000, 29, 1–8. [Google Scholar] [CrossRef]
  69. Van Remortel, R.D.; Hamilton, M.E.; Hickey, R.J. Estimating the ls factor for rusle through iterative slope length processing of digital elevation data within arclnfo grid. Cartography 2001, 30, 27–35. [Google Scholar] [CrossRef]
  70. Da Silva, R.M.; Montenegro, S.M.G.L.; Santos, C.A.G. Integration of GIS and remote sensing for estimation of soil loss and prioritization of critical sub-catchments: A case study of tapacurá catchment. Nat. Hazards 2012, 62, 953–970. [Google Scholar] [CrossRef]
  71. Park, S.; Oh, C.; Jeon, S.; Jung, H.; Choi, C. Soil erosion risk in Korean watersheds, assessed using the revised universal soil loss equation. J. Hydrol. 2011, 399, 263–273. [Google Scholar] [CrossRef]
  72. Feng, Q.; Zhao, W. The study on cover-management factor in usle and rusle: A review. Acta Ecol. Sin. 2014, 34, 4461–4472. (In Chinese) [Google Scholar] [CrossRef]
  73. Fu, B.; Zhao, W.; Chen, L.; Zhang, Q.; Lu, Y.; Gulinck, H.; Poesen, J. Assessment of soil erosion at large watershed scale using rusle and GIS: A case study in the loess plateau of china. Land Degrad. Dev. 2005, 16, 73–85. [Google Scholar] [CrossRef]
  74. Stone, R.P.; Hilborn, D. Universal Soil Loss Equation (USLE). Available online: http://www.omafra.gov.on.ca/english/engineer/facts/12-051.htm (accessed on 29 March 2016).
  75. Yang, X.; Zhang, X.; Deng, W.; Fang, H. Black soil degradation by rainfall erosion in Jilin, China. Land Degrad. Dev. 2003, 14, 409–420. (In Chinese) [Google Scholar] [CrossRef]
  76. Wang, Z.; Jian, J.; Jiao, J.; Su, Y. Estimation of sediment delivery ratio in different soil erosion regions in the songhua river basin based on rusle. Resear. Soil Water Conserv. 2013, 20, 50–56. (In Chinese) [Google Scholar]
  77. Liu, B.; Tao, H.; Song, C.; Guo, B.; Shi, Z.; Zhang, C.; Kong, B.; He, B. Temporal and spatial variations of rainfall erosivity in China during 1960 to 2009. Geogr. Res. 2013, 32, 245–256. (In Chinese) [Google Scholar]
  78. Schmid, A. Spatial and temporal variability of rainfall erosivity factor for Switzerland. Hydrol. Earth Syst. Sci. Discuss. 2011, 16, 167–177. [Google Scholar]
  79. Zhang, H.; Wang, Q.; Dai, L.; Shao, G.; Tang, L.; Wang, S.; Gu, H. Quantifying soil erosion with GIS-based rusle under different forest management options in jianchang forest farm. Sci. Chin. 2006, 49, 160–166. [Google Scholar] [CrossRef]
  80. d’Oleire-Oltmanns, S.; Marzolff, I.; Tiede, D.; Blaschke, T. Detection of gully-affected areas by applying object-based image analysis (obia) in the region of Taroudannt, Morocco. Rem. Sens. Basel 2014, 6, 8287–8309. [Google Scholar] [CrossRef]
  81. Wang, T.; He, F.H.; Zhang, A.D.; Gu, L.J.; Wen, Y.M.; Jiang, W.G.; Shao, H.B. A quantitative study of gully erosion based on object-oriented analysis techniques: A case study in Beiyanzikou Catchment of Qixia, Shandong, China. Sci. World J. 2014, 2014, 417325. [Google Scholar] [CrossRef] [PubMed]
Figure 1. The location map of the study area. (a) Location of Northeast China; (b) Jiutai District located at the southeastern edge of the black soil region; (c) spatial distribution of national meteorological stations; (d) location map of Mushi River sub-catchment with DEM data of the Jiutai District; (e) the detailed Pleiades-1A RGB image with 3, 2, 1 band combination covering the study area.
Sustainability 08 00317 g001
Figure 2. LULC map. (a) from GCM and (b) from Landsat 8.
Sustainability 08 00317 g002
Figure 3. Schematic diagram for the ridge direction. (The black line represents the boundary between the plots and the red line indicates the direction of the ridge.)
Sustainability 08 00317 g003
Figure 4. Spatial distribution of factors of RUSLE. (a) The R factor map; (b) the K factor map; (c) the LS factor map; (d) the C factor map; (e) the P factor map.
Sustainability 08 00317 g004
Figure 5. The hillslope soil erosion map of the study area.
Sustainability 08 00317 g005
Figure 6. The distribution of (a) erosion gullies and (b) erosion gully density in the Mushi River subcatchment.
Sustainability 08 00317 g006
Figure 7. Relation of hillslope and gully erosion depending on different (a) elevations, (b) slopes, and (c) slope aspects.
Sustainability 08 00317 g007aSustainability 08 00317 g007b
Figure 8. Land use types in each slope class.
Sustainability 08 00317 g008
Figure 9. Relation between gully erosion and hillslope erosion.
Sustainability 08 00317 g009
Table 1. C factor for different LULC classes.
Land Use/Land Cover ClassC ValuesArea (%)
Paddy field0.181.09
Dry land0.2665.08
Garden0.050.14
Arbor forests0.00525.41
Shrubbery0.070.76
Sparse forest and other woodland0.050.05
Mixed forest of arbor and shrubbery0.060.13
High coverage grassland0.041.81
Artificial grassland0.20.04
Housing construction area01.27
Road00.60
Structures00.40
Artificial stacked substance and quarry0.010.12
Desert and bare ground10.20
Water area02.91
Table 2. Interpretation signs on Pleiades.
LocationGully TypesPleiades ImagesGround Photos
126.157°E
44.356°N
Ephemeral gully Sustainability 08 00317 i001 Sustainability 08 00317 i002
126.136°E
44.212°N
Permanent gully Sustainability 08 00317 i003 Sustainability 08 00317 i004
126.262°E
44.301°N
Permanent gully Sustainability 08 00317 i005 Sustainability 08 00317 i006
Table 3. Area and soil loss under different hillslope erosion classes in the study area.
Hillslope Erosion ClassNumeric Range (t·ha–1·a–1)AreaSoil Loss
km2%104 t·a–1%
Tiny<285.2433.770.651.42
Slight2–25110.3443.7110.7523.56
Moderate25–5031.3512.4211.0924.32
Intense50–8014.065.578.8219.35
Severe80–1509.203.659.6621.19
Violent>1502.210.874.6410.17
Table 4. Status of gully erosion in the study area.
Numbers of GullyThe Minimum Length (m)The Maximum Length (m)The Total Length (km)The Total Area (hm2)Gully Intensity (m2/km2)Gully Density (km/km2)
167411.93087.5271.08140.925574.961.07
Table 5. Comparison between observed data from Zhang et al. [9] and the calculation of RUSLE in this study.
PlotsVegetation Cover and Preservation PracticeSlope Length(m)Slope (°)The Mean Annual Hillslope Erosion (t·ha–1·a–1)Deviation (%)
Observed Data in Experimental AreasCalculation of Similar Plots in This Study
1Mixed forest of arbor and shrub (P = 1)619.91.040.96−7.69
2Soybean and corn (Contour Ridge,P = 0.352)2344.4610.3572.50
3Soybean, corn, and sorghum (Contour Ridge, P = 0.352)2015.27.9614.1177.26
4Soybean, corn, and millet (Contour Ridge, P = 0.352)688.432.5854.9968.78

