Article

Spatio-Temporal Differentiation of Urban-Rural Equalized Development at the County Level in Chengdu

1
School of Resource and Environmental Sciences, Wuhan University, 129 Luoyu Road, Wuhan 430079, China
2
Key Laboratory of GIS, Ministry of Education, Wuhan University, 129 Luoyu Road, Wuhan 430079, China
3
Key Laboratory of Digital Mapping and Land Information Application Engineering, National Administration of Surveying, Mapping and Geo-information, Wuhan University, 129 Luoyu Road, Wuhan 430079, China
4
Collaborative Innovation Center of Geospatial Technology, Wuhan University, 129 Luoyu Road, Wuhan 430079, China
5
Fuzhou Investigation and Surveying Institute, 188 Hudong Road, Fuzhou 350003, China
*
Author to whom correspondence should be addressed.
Sustainability 2016, 8(5), 422; https://0-doi-org.brum.beds.ac.uk/10.3390/su8050422
Submission received: 28 January 2016 / Revised: 20 April 2016 / Accepted: 21 April 2016 / Published: 29 April 2016

Abstract

:
Urban-rural equalized development (URED) is recognized as strongly contributing to the narrowing of societal, economic, life, and environmental gaps between urban and rural areas and is also an effective way to solve the “three rural issues” of rapid industrialization and urbanization in China. This paper explores the spatio-temporal patterns of URED in the state-designated experimental zone of Chengdu at a county level by using quantitative survey data from 2004 to 2013. The major findings are as follows: (1) the regions that are closer to the central city of Chengdu had a more optimistic urban-rural equalized development outlook (i.e., the three-tier geographical distribution phenomenon); (2) this distribution characteristic was gradually broken up in the process of urban and rural integration, and the differences between the three tiers has been narrowing; and (3) the gap between urban and rural areas has been significantly improved and exhibited a higher dynamic degree in the second and third tiers than in the first tier, which suggests a new development mode that exhibits better quality and higher sustainability. Given these results, the development orientation and strategy of each tier are discussed according to the characteristics of urban and rural equalized development.

1. Introduction

Development is a spatially uneven process driven by geographical difference in density, distance, and division [1]. In regional development, urban and rural areas are two non-homogeneous geographical economic entities that interact with and mutually influence each other. Urban-rural equalized development (URED) describes how urban and rural areas, which are two types of socio-economic units and human settlement spaces with different characteristics, seek to integrate development and coexist within one interdependent region and to smoothly accomplish the distinctive equalization of urban-rural economic investment, social service, quality of life, and ecological environment [2,3,4]. As the advanced stage of urbanization, URED considers the city and the countryside as a unified whole, and is a dynamic process of both promoting the free flow and optimized allocation of production factors and realizing the integration under market-oriented reform between urban and rural areas, which contribute to the formation of a new urban-rural pattern of equal status, mutual coordination, common prosperity, and all-around sustainable development [5,6,7].
Since the establishment of the People’s Republic in 1949, China has followed a central-planning model of development with collectivized agricultural production in rural areas and a concentration of heavy industry in urban areas based on the condition of undeveloped agricultural country. These urban-biased policies have prioritized urban development and opportunities over agriculture and peasants during the first three decades [8,9]. Within policy reflected in measures such as the household registration system, urban and rural areas were separated into two unrelated entities in Chinese social and economic development, and a “dual track” structure including a series of unequal social systems was induced [10,11,12]. After the reform was launched in 1978, the traditional central-planning economy was changed into a market-based one, Chinese rural economy achieved significant growth under the “household responsibility system” and the emergence of township and village enterprises (TVES) in the early 1980s, while the market-oriented economy strategy and open door policies with trade and foreign direct investment provided urban areas with great inherent development advantages [13]. There is no doubt that China has had significant success in economic and social development over the past three decades; by the end of 2013, the per capita GDP has increased to 43,320 which was 113.40 times that of 1978, and nearly 53.73% of the population was urban residents, which was 5.05 and 3 times that of 1949 and 1978, respectively (Figure 1). However, the dual socio-economic structure has not been eliminated from this rapid and unprecedented process of urbanization because urban-biased policies such as fiscal revenue and expenditure, land acquisition, social insurance, and financial intermediation have not substantially changed [14].
The dual structure led to a series of differences between the urban and rural sectors, which was especially reflected in economic development, social progress, political rights, and life quality. The ratios of urban and rural incomes were 2.57, 3.231, and 3.03 in 1978, 2003, and 2013 at the national level, respectively (Figure 1), and the absolute difference of urban and rural consumption expenditure rose to 11,397.1 in 2013, furthermore, 82.49 million rural residents still lived in poverty in 2013, which was the hardest issue to tackle for the poverty alleviation programme and was not conducive to the stability of society. Rural residents faced with the shortage of public service such as social security and infrastructure construction, which further expanded the differences. Data showed that one urban NPC representative represents one quarter of the citizens represented by a rural representatives. Unlike farmers living under poor conditions, urban residents live in rich and modern conditions with an intensive distribution of public facilities, such as libraries, cinemas, and stadiums. These factors put rural areas at a disadvantage in competition with urban. Furthermore, these expanding differences are quite different from the eastern coast to the central and western China and were concentrated on the “three rural issues” (San Nong in Chinese; issues concerning agriculture, countryside & farmers) [15].
Industrialization and urbanization is the only road that lead to China’s modernization, current rapid industrialization and urbanization has caused rural hollowing and depopulation, the rural brain-drain phenomenon, in which 0.9 million natural villages have disappeared in China from 2000 to 2010, which is equivalent to nearly 250 per day, and urban-rural contradictions have increasingly become more prominent [16,17]. Additionally, the balance between economic growth and environmental protection for sustainable urbanization has been destroyed because the natural environment has been seriously polluted both in urban and rural areas, particularly in recent years, the megacities have been faced with grand challenges in achieving environmental sustainability, and the occurrence of urban pollution transfer to rural areas is widespread, which significantly threatens rural ecological functions [18,19]. The continuously expanding urban-rural gap and worsening rural environment due to the dual-track structure in socio-economic development not only inhibits the urbanization process but also triggers a series of risks to social stability, which have become bottlenecks to sustainable social and economic development in China [20,21]. The most notable issue is the extreme lack of coordination in economic development, social justice, and resource allocation between urban and rural areas which led to inefficient agriculture, backward countrysides, and poor farmers in rural areas, and the difference is so significant that it has obstructed China’s overall development [4]. With these points put into consideration, urban and rural development can no longer be seen isolated or conflicting, more coordinated and sustainable urbanization strategies are needed [22].
With the goal of eliminating the gap between urban and rural areas and solving the “three rural issues”, the Chinese government has made various exploration efforts. From 2004 to 2015, the topic of the No. 1 document of the CCP Central Committee of each year focused on the “three rural issues,” which promoted coordinated urban-rural development to solve rural development issues. The scientific outlook of urban-rural integration was proposed in the third plenary session of the 16th CCP Central Committee, emphasizing the “Five Coordinations,” in which the “coordination of urban-rural development” is on the top of the agenda. “Building a socialist countryside” was proposed in the fifth plenary session of the 16th CCP Central Committee and is the embodiment of the policy that promoted urban and rural integration, implementation of industry nurturing agriculture, and cities supporting rural areas to coordinate urban and rural development [23]. The 18 central committees of the CPC in 2012, aimed to seek coordinated development and promote common prosperity between urban and rural areas to solve the “three rural issues”, URED as a major strategy of rural sustainable development was proposed [24].
As described above, the prominent feature, core, essence, and fundamental solution of the “three rural issues” are the widening gap between urban-rural areas, too many farmers with low income in the countryside, the lag in rural market reform, and urban-rural dual structure adjustment, respectively [7,25,26]. First, based on the consideration of the urban and rural sectors as a unified whole, URED breaks the administrative boundaries to change the dual structure for promoting the free flow of all kinds of production factors and the free migration of residents between urban and rural areas according to the market orientation, which is conductive to reducing the number of farmers by the orderly transfer of rural surplus labor force [27]. Second, URED adjusts the development policy to rural incline reasonably, aiming to promote agricultural industrialization and rural industrialization under cities supporting the countryside, which will significantly enhance the rural economy and increase farmers’ income steadily [28,29]. Moreover, URED adopts unified urban and rural planning, and improves the rural conditions by strengthening rural infrastructure, which will accelerate the process of rural urbanization [30,31]. Finally, URED gradually deepens system reforms, such as land acquisition, household registration, and social security, to further improve basic public services in the countryside, and to improve the quality of life of rural residents constantly [5,32,33]. As the advanced stage and a new type of urbanization, URED is the correct choice and fundamental way to solve the “three rural issues” under the special national conditions in China.
In recent years, many scholars have conducted detailed studies of China’s urban-rural equalized development from multiple perspectives that considered development models and manners [34,35,36,37], spatio-temporal patterns [3], and land system reform [38,39,40]. Most studies used qualitative analyses and descriptions in certain aspects of URED, and the majority of these studies were focused on the eastern coastal region of China; therefore, quantitative study of urban-rural equalized development in the western region of China is of great theoretical and practical significance. This study aims to develop an evaluation index system, and multi-dimensional methods were introduced to explore URED conditions and spatio-temporal patterns of the city of Chengdu at a county-level from 2004 to 2013. This study may serve as a scientific reference regarding decision-making in urban-rural equalized development and new types of urbanization elsewhere in China.

2. Materials and Methods
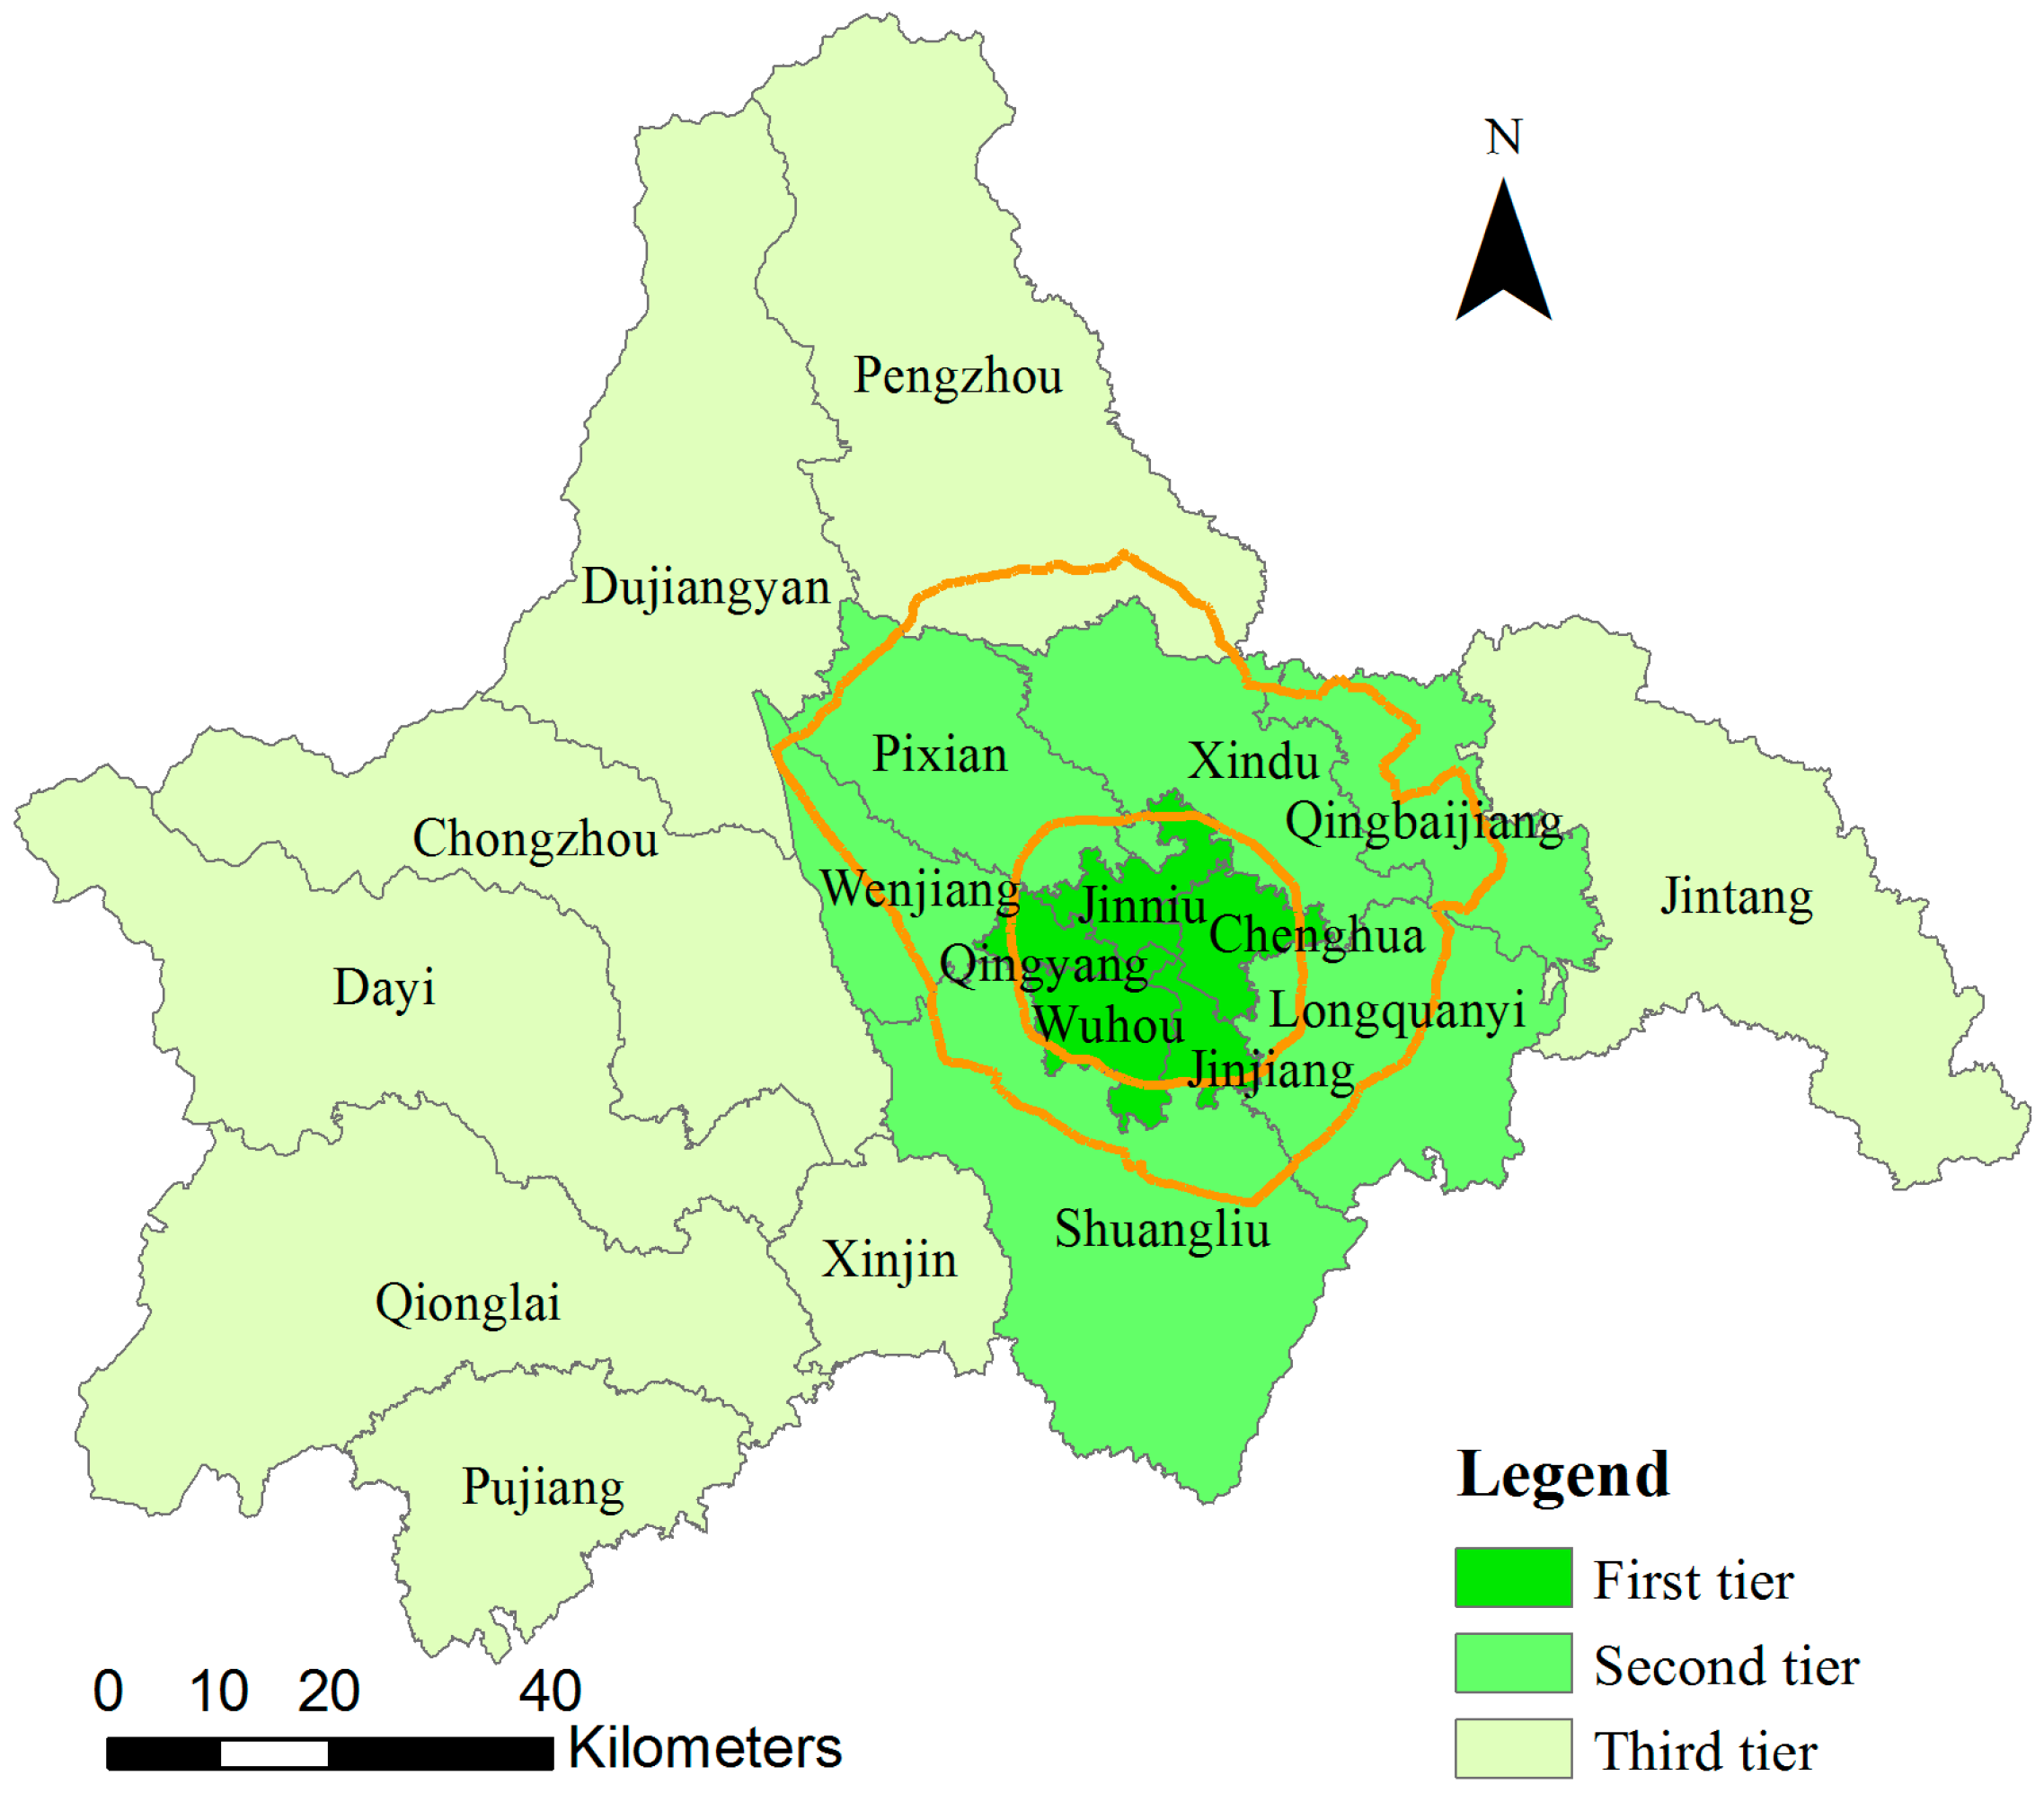
2.1. About Chengdu

Chengdu city is located in southwest China from 102°54′ to 104°53′E longitude and between 30°05′ and 31°26′N latitude in the center of Sichuan province and is also the political, economic, and cultural center of Sichuan. Chengdu is a typical mega city with an area of approximately 1.21 × 10⁴ km2 and a population of 11.73 million at the end of 2013. The Chengdu Municipality is composed of nine districts (Jinjiang, Qingyang, Jinniu, Wuhou, Chenghua, Longquanyi, Qingbaijiang, Xindu, and Wenjiang), six counties (Jintang, Shuangliu, Pixian, Dayi, Pujiang and Xinjin), and four county-level cities (Dujiangyan, Pengzhou, Qionglai, and Chongzhou) under its administration. Figure 2 shows the geographic distribution of Chengdu City, the yellow lines are extracted from the main link roads, the first tier is the central city, the second tier is the peripheries and the third tier is the remote counties and towns.
Since the reform, Chengdu has experienced rapid urbanization and industrialization. At the end of 2002, Chengdu’s GDP ranked fourth among the 15 sub-provincial cities, and the per capita GDP was 16,277, which was 36.25 times that of 1978. However, it was still a typical metropolitan city with a large rural area. The non-agriculture population proportion accounted for 35.6% of the total. Compared to the central city with an area of 3681 km2, which produced 73% of the GDP with a population of 5.8 million, the outer suburban districts were 2.37 times larger and produced the remaining 27% of the GDP with 5.4 million people. The ratio of urban and rural incomes was further widened to 2.66. Thus, the urban-rural development was so imbalanced that the process of urbanization faced with many socio-economic risks.
Under this situation, aimed to narrow the urban-rural gap and achieve urban-rural equalized development, Chengdu has performed comprehensive reform in coordinating the development between urban and rural areas since 2003. The core strategy was “Three Concentrations”: the concentration of rural residents in the township, the concentration of land to realize scale economies, and the concentration of firms in the organized industrial zone. Under this guideline, a series of policies and institutions from different aspects of economic and social development were introduced into practice step by step, including the reform of the household registration system; the development planning of global Chengdu; the construction of s new countryside pilot zone and the modern garden city pilot line in social reform; the funding of cultivated land protection; the comprehensive consolidation of land resources; the right conformation and certificate granting of land-use rights in land management; the “21 + 10 consolidated industrial development areas;” and the “one area, one key industry” policy based on their own comparative advantage and the capacity of the land resources and environment of each region in economic development. The gap between urban-rural areas and the worsening environment, which constrains sustainable development and urbanization, were significantly improved in Chengdu, URED has been shown to be an effective strategy to drive rural development. Chengdu has promoted URED which was a multi-level, multi-factor, and multi-faceted process for more than 10 years as a state designated national pilot area [41]. Thus, it is of significant theoretical and practical interest to choose Chengdu as the study area.

2.2. Data Resources

This study used data about Chengdu from 2004 to 2013, and the data of the 19 districts in 2004, 2007, 2010, and 2013. These four typical years were significant in Chengdu’s URED. In 2004, the municipal government of Chengdu officially made a strategic plan: coordinated urban-rural socio-economic development, and the integration of urban and rural areas. The government also gradually introduced a series of measures, such as the household registration system reform. In 2007, Chengdu was approved to be the national urban-rural comprehensive reform pilot area, and the “global Chengdu” development plan was first proposed. In 2010, which was the last year in the 11th five-year plan, and also the beginning year of construction of the world’s modern garden city. In 2013, a total scheme, roadmap, and schedule of the coordinated development between urban and rural areas over the next five years in Chengdu were created. Thus, these four years were particularly useful for studying URED in Chengdu. The socio-economic data used in this study were derived from the Sichuan Statistical Yearbook (2005–2014), the Statistical Yearbook of Chengdu (2005–2014), the National Bureau of Economic and Social Development (2005–2014), and the annual government work report of each region in this period. Any data used in this study were from unified statistical sources and were standardized before analyses were performed. Spatial data processing and visualization were programmed in ArcGIS 10.1.

2.3. Evaluating Indicator System and Methodology

2.3.1. Establishment of an Appraisal Indicator System of URED

As mentioned above, URED should consider human, economic, environmental, and social development between urban and rural areas as a whole so it cannot be evaluated by a single indicator; thus, this paper uses multiple indicators [23]. We first performed a frequency analysis of the appraisal indicators from 46 studies between 2010 and 2015 on this related topic, and then considered the regional characteristics and natural conditions of Chengdu. An appraisal indicator system consisting of 17 variables that described spatial allocations, economic development, social services, quality of life, and ecological environment was established (Table 1).

2.3.2. Methodology

The indicators in the appraisal indicator system cannot be compared because they have different units. A normalization process was used to standardize the evaluation index data to eliminate the impact of different dimensions. The formula is as follows:
  Z j = { X j X m i n   X m a x X m i n   ( Positive indicator ) X m a x   X j   X m a x   X m i n   ( Negative Indicator )
where Xj, Xmax, Xmin, and Zj are the original, maximum, minimum, and standardized value of the jth evaluation index, respectively [41].
Principal component analysis was used to screen out certain principal indicators that had a larger influence upon the assessment of urban-rural equalized development. SPSS version 19 for Windows was used to analyze the URED state based on the collected socio-economic data of 19 districts; the results of this analysis were used to create an urban-rural equalized development index (UREDI), which was calculated using the following weighted average:
U R E D I =   i = 1 i = m w i j = 1 j = n u i j Z j
where m is the number of components extracted by SPSS , n is the number of indicators, wi is the weight of the ith component, and uij is the score coefficient of the jth indicator for the ith component.
To describe the URED state at a given time, the evaluation model of the URED dynamic degree is established:
K = ( U R E D I f   U R D E I i ) / ( | U R E D I i   ×   T | )
where K is the dynamic degree of URED during a given time; UREDIi and UREDIf are the initial and final UREDI of the study period, respectively; and T is the duration of the dynamic change in years [42].

3. Results and Discussion

3.1. Evaluation of URED

3.1.1. Factor Identification for Evaluation of URED

Before the principal component analysis was performed, the common KMO (Kaiser-Meyer-Olkin) and Bartlett’s tests were conducted, and their results showed that the KMO value of economic benefit indicators was 0.870, which was greater than 0.85, indicating that the sample was suitable for principal component analysis [43]. The four predominant components were extracted from the 17 original indices with the varimax rotation method; the first four principal components can explain 81.861% of the total variance (Table 2).
Based on the rotated component matrix, component I primarily describes the urban-rural social development degree, which consists of the consumption of chemical fertilizer, per capita cultivated land area, non-agriculture population proportion, percentage of rural nonfarm payrolls, average number of hospital beds per 100 inhabitants, and persons receiving lowest cost-of living per 100 inhabitants with 29.125% of the total variance [3,40,44,45]. Component II, which is composed of the per capita public-budgetary expenditure, per capita fixed-asset investment, per capita domestic product, green coverage rate of built-up area and highway net density, is related to the degree of economic development and accounts for 27.397% of total variance [41,46,47]. The ration of urban-rural residents’ income, per capita retail sales of consumer goods and ratio of urban-rural residents’ consumption expenditure compose component III, which accounts for 16.437% of the total variance. These three indicators primarily describe the life conditions between urban and rural residents [7,44,48]. Component IV consists of the remaining average number of full-time teachers per each 100 regular Secondary School students and index of urban-rural productivity of dual track structure, which accounts for 8.902% of the total variance, and primarily describes the quality of the equalized development between the urban and rural areas [33,47].

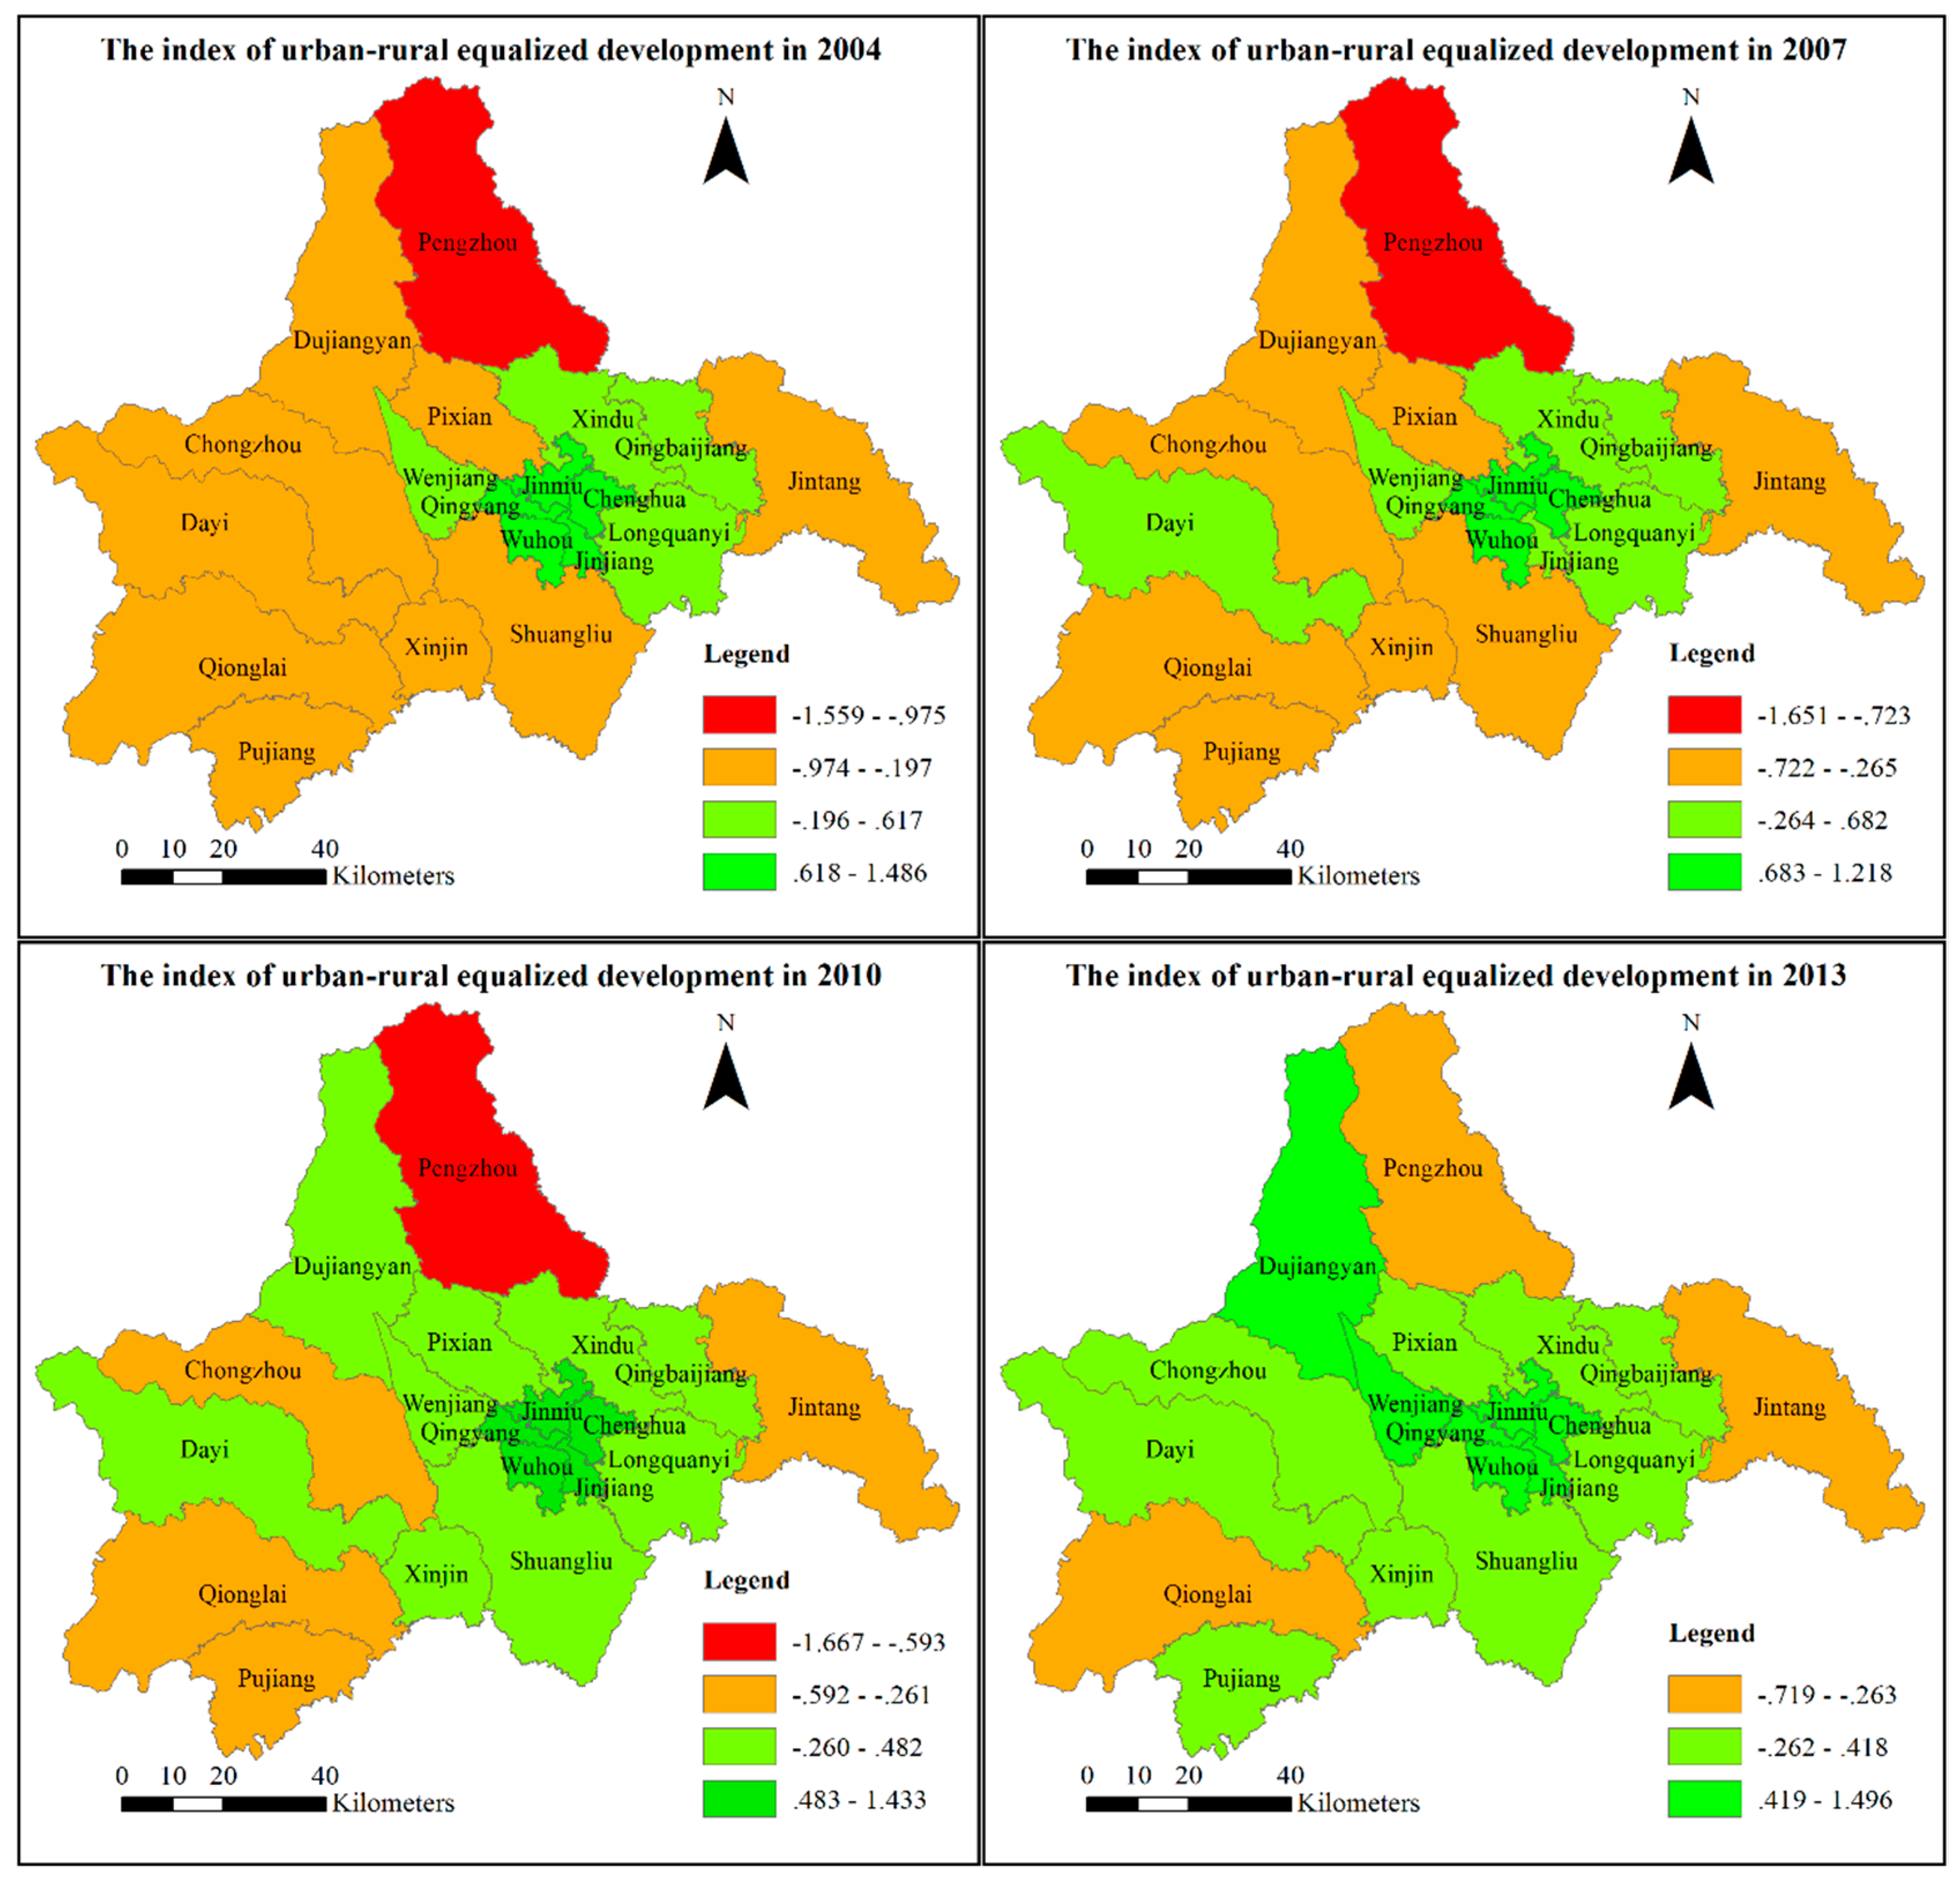
3.1.2. Spatio-Temporal Patterns of URED

Based on formula 2, we calculated the UREDI of the 19 districts in 2004, 2007, 2010, and 2013, and the systematic cluster method was applied to cluster the UREDI of these years into four categories, as shown in Table 3. Category I describes a high-integration area; category II describes a medium-integration area; category III describes a low-integration area; and category IV describes a very-low-integration area. Furthermore, the urban-rural equalized development state of each district in these four years is geographically shown according to the UREDI values in Figure 3. Regions with dark green, light green, dark yellow, and dark red represent categories I–IV, respectively. As shown in Figure 3, the URED state of Chengdu showed a well-defined geographical distribution: the urban-rural equalized development index was higher in areas that were nearer to the city center, this geographical distribution phenomenon was gradually broken down along with the implementation of URED from 2004 to 2013. More specific details regarding these four years are discussed below. Additionally, the variation coefficient of UREDI decreased from 5.370 in 2004 to 1.938 in 2013, demonstrating that the regional difference in the 19 districts declined.
In 2004, the URED of Chengdu exhibited a pronounced three-tier geographical distribution; the geographical distribution characteristic indicated that urban and rural areas developed separately. The four categories accounted for 26.32%, 21.05%, 47.37%, and 5.26% of the total districts, respectively, and most fell into category III (Table 3), with nine in the low-integration state.
By 2007, the overall urban-rural integration level of Chengdu regressed to a certain degree, particularly in the first circle, while the second tier showed some extensive progress, the differences between the three circles were still very significant (Figure 3). The ratios of the districts in each of the four categories to the total 19 districts were 21.05%, 31.58%, 42.11%, 5.26%, respectively, and category III was still dominant, although the number of districts had decreased. With rapid industrialization and urbanization, regions that were not in the first tier in Chengdu began to gradually make progress in this time period. For example, Dayi, which is located in the third circle, reached category II, which was the first time that regions in the third tier improved from category III or IV.
In 2010, there were five, nine, four, and one districts in categories I, II, III and IV, respectively, which accounted for 26.32%, 47.37%, 21.05%, and 5.26% of the total number of districts, respectively. Category II accounted for the largest proportion, and the geographical distribution of the three circles was uneven, with the third tier showing great improvement (Figure 3). Rural development has improved since the pilot area was established, and the overall urban-rural equalized development level of Chengdu has improved accordingly.
By the end of 2013, most of Chengdu surpassed the low-integration level, and no region belonged to category IV (Table 3). Categories I, II, and III accounted for 36.84%, 47.37%, and 17.79% of the total number of districts, respectively. The three-tier geographical-distribution phenomenon further disintegrated, and regional differences have decreased with the accelerated integration process. Wenjiang and Dujiangyan have made significant progress during the observed period, particularly, which performed better in their own tier. However, the extent of equalized urban-rural development in remote and mountainous areas, such as Pengzhou, Jintang, and Qionglai, were still not yet high; thus, more attention should be devoted to these districts.

3.2. Dynamic Degree of URED

To further qualitatively analyze the dynamic evolution pattern of URED in Chengdu, the value of K was calculated based on formula 3 and the mean value was 0.353 while the mean value of regions with a dynamic degree of URED lower than 0.353 was 0.07. According to the value of K, each region was grouped into one of four types: type I was assigned to regions with a dynamic degree <0 (i.e., downward region); type II was assigned to regions with a dynamic degree of 0.000–0.07 (i.e., slowly upward regions), type III was assigned to regions with a dynamic degree of 0.07–0.353 (i.e., stably upward regions), and type IV was assigned to regions with a dynamic degree >0.353 (i.e., rapidly upward regions). The overall dynamic patterns of Chengdu during the study period are shown in Figure 4, each of the four colors represent the corresponding type as shown in the legend.

3.2.1. Dynamic Degree of URED during 2004–2007

Most of the 19 regions in Chengdu were type I, while only nine regions were types II–IV in the period of 2004–2007; among the nine upward districts, only Wenjiang was classified as type IV (Figure 4). In terms of economic development, with development set as the highest priority, all districts in Chengdu made substantial improvement due to rapid urbanization and industrialization. Urban areas, particularly those that were the first tier, had priority development. The ratio of urban-rural residents’ income in Chengdu reached a peak at 2.632 in 2007, and all five districts in the first tier exhibited a declining UREDI value in 2007 compared to that of 2004. Social development did not show substantial progress, which was reflected in the sum of the three tiers in 2007, compared to that of 2004, it has decreased 3.09, 1.63, and 0.19, respectively. This factor was the primary reason for the deterioration of the UREDI. Certain areas in the second tier, such as Wenjiang, Qingbaijiang, and Xindu, made significant improvement, while only few regions in the third tier exihibted changes during this period.

3.2.2. Dynamic Degree of URED during 2007–2010

Between 2007 and 2010, the “global Chengdu” plan was proposed and implemented; the urban and rural comprehensive reform was further developed; and urban-rural equalized development in Chengdu achieved profound success. With the exception of Jinniu, Chenghua, and Pengzhou, all of the districts in Chengdu achieved a clear upward trend while promoting urban-rural equalized development, particularly in the second tier, in which all the six districts showed either stable or rapid upward development; this spatial aggregation was significant (Figure 4). Additionally, the third tier initially showed certain significant changes, even though these changes lagged behind those of the second tier. The growth of the per capita net rural income accelerated even more quickly, and the gap of quality of life between urban and rural areas gradually decreased as the agricultural economy of the rural area improved.

3.2.3. Dynamic Degree of URED during 2010–2013

The urban-rural equalized development in Chengdu maintained a stable trend during 2010–2013. In general, five districts ascended one level, two regions that did not belong to the first tier (Wenjiang and Dujiangyan) reached a high-integration state (Figure 3), and the economic gap between the first and second tiers was drastically reduced. During this period, as the primary group with a higher dynamic degree, 57.14% of the area in the second and third tiers showed rapid upward development, and 35.71% showed stable upward development (Figure 4). Compared to 2010, the sum of component III of the three tiers in 2013 have increased 1.80, 1.08, and 2.16, for the first , second and third tiers, respectively, which indicated that the quality of life of residents was further improved, but social development still lagged far behind the economic success according to the sum of component I. More than half of the 19 districts (73.68%) showed a higher dynamic degree during this period than during the period of 2007–2010; which indicates the strong potential of sustainable urban-rural equalized development in Chengdu. The gap between the three tiers was gradually disappearing, indicating that the “global Chengdu” plan made significant achievements in the overall integration development in Chengdu, and the location advantage was not as significant as it had been in the past.

3.3. Strategy to Promote URED

In the process of urban-rural comprehensive reform from 2004 to 2013, Chengdu made significant efforts in multiple aspects as mentioned above, and all of these policies and institutions have significantly improved the gap between urban and rural areas in Chengdu; in fact, the ratio of urban-rural income decreased to 2.308 and the non-agricultrre populatin proportion rose to 61.34% in 2013 (Figure 5). The three-tier geographical distribution phenomenon and the spatial aggregation characteristics of Chengdu are still present but are not as significant as previously observed, demonstrating a gradual downward trend (Figure 3).
For a long time, first-tier regions in Chengdu showed better integration conditions due to the location advantages of this region for social development, good infrastructure for economic growth, easy access to the central city for rural residents, and preferential policies in regional development. Rural residents in these five districts exhibited a greater probability of being employed in non-agricultural industries with higher incomes; easier access to enjoying a city lifestyle with social security, welfare, and public services; and a more significant opportunity to be a citizen. Conversely, rural residents that live in the second- and third-tier regions experienced difficulties in enjoying equal opportunities because of the remote distance from the central city’s sphere of influence, fewer non-farm job opportunities, scattered handicraft industries with lower salaries and a reduced opportunity to be a citizen. The differences between the urban and rural sectors in these areas were thus more significant than the first-tier districts. In the end of 2013, the per capita GDP of the three tiers were 72,705, 69,991, and 32,657; meanwhile, the non-agriculture population proportions were 100%, 56.3%, and 36.4% (Figure 6). Therefore, the three tiers of districts should adopt different optimized strategies to guide URED in the coming years.
(1) The five districts in the first tier should increase their focus on the quality of URED and steadily strengthen social development, take the lead in industrial transformation , optimize the industrial structure, and increase lower energy consumption and high-value industries to improve economic competitiveness. It is also necessary to vigorously develop characteristic agriculture and promote rural development according to their unique location advantage of these regions to improve agricultural productivity and strengthen the strict protection of environmental and land resources to ensure the development potential and further improve the life quality of residents.
(2) Compared to the first tier, the six regions in the second tier have achieved great success in economic development: the per-capital GDP of the second tier was almost equal to the first tier in 2013 (Figure 6). Unlike the first tier, in which the tertiary and service industry was the leading industry, industrial manufacturing was the leading industry in the second tier. Therefore, the second tier should speed up the upgrading of industrial transformation, enhance industrial competitiveness, and strengthen the environmental protection for sustainable development to provide more public resources for social development, as the second tier currently falls behind first-tier areas in this field, and improve the conditions for the urbanization of rural residents [41]. Furthermore, it is necessary to significantly improve the people’s livelihoods, which, at their current state, severely restrict the progess of urban-rural integration in these regions.
(3) Compared with regions of tiers 1 and 2, the primary problem of third-tier regions is undeveloped economies (Figure 6); thus, their primary goal is development. Under the guidelines of scientific and sustainable development, these areas should emphasize the development of a characteristic economy that is based on their own environmental capacity and regional advantages as soon as possible, develop a scaled economy and provide more non-farm job opportunities to accumulate wealth for increasing the rate of development of infrastructure and public service infrastructure for social development. Additionally, both the second and third tier should provide more pathways to city residency for rural residents. The municipal government of Chengdu should provide more support in public finance with their autonomy in resource allocation, urban planning, and economic policy, such as increasing fiscal spending and investment in fixed assets in a reasonable manner, which will significantly improve the investment environment in these areas [49,50].

4. Conclusions

China has entered a phase of new-type urbanization, urban-rural equalized development not only plays an important role in breaking up dual structures in social and economic development, but also makes a strong contribution to achieve coordinated and balanced development between the urban and rural sectors. This approach is an effective manner by which Chinese industries nurture agriculture and cities support rural areas to solve the “three rural issues” in a scientific and sustainable way. It is also of great significance to ensure sustainability during this new-type of urbanization. Up until now, there has been a lack of spatio-temporal analysis of URED at county-level in the existing literature especially in western China, this study attempts to fill this gap.
In our study, unlike the subjective evaluated methods such as the AHP and Delphi, PCA avoided the limitation of human subjectivity and the problem of the repeated weighting of the each evaluation index because of the correlation between them, which strongly contributed to ensuring the scientific nature of this study under the respect of the integrity of the 17 indicators. Additionally, UREDI not only accurately reflected the overall condition of URED, but also revealed detailed information for each factor corresponding to the specific value of each component, this has important implications for policy makers in identifying the overall regional development pattern [51]. Moreover, the PCA method used in synergy with GIS technology made it possible to simulate URED temporal aspects in a spatially explicit manner, which strongly contributes to ensuring sustainability in regional development, especially in developing countries like China with unequal development between cities and rural areas [52,53,54,55,56].
By using principal component analysis, we explored the saptio-temporal differentiation of urban-rural equalized development in Chengdu, as the state-designated experimental zone to promote urban-rural comprehensive reform, which has experienced rapid industrialization and urbanization, has explored the theory and practice of URED since 2003 to more effectively urbanize Chengdu and significantly decrease the gap between urban and rural areas compared to the national level (Figure 1 and Figure 5). In the proposed study, 17 indicators of five categories were identified to develop the UREDI for the urban-rural equalized development conditions of the 19 county-level districts under Chengdu’s administration, and the dynamic degree was calculated to further analyze the spatial dynamic patterns from 2004 to 2013. This study revealed the dynamic evolution of URED in both spatial and temporal dimensions in the example study area, and provided insights into decision-making process and policy actions in regional development [52,57,58].
The findings indicate that Chengdu has made significant progress in urban-rural integration during these 10 years (Figure 3, Figure 5, and Figure 6). The gap between urban and rural has gradually decreased (Figure 5 and Figure 6), and the three-tier geographical phenomenon was disintegrated (Figure 3 and Table 3); the second- and third-tier areas showed a higher dynamic degree than the first-tier areas (Figure 4), and all three tiers displayed a favourable sustainable integration development mode during the study period. Each tier should adopt different development strategies based on their own natural conditions and present characteristics of urban and rural equalized development to promote urban and rural equalized development in the coming years (Figure 6). Besides, the Chengdu municipal government should further strengthen policy support and guidance of the urbanization and industrialization in the third tier, so as to promote the integration and coordination of global Chengdu.
Urban-rural equalized development is highly multidimensional, dynamic over long periods, and difficult to quantify, this study has explored the spatio-temporal differentiation of URED reasonably and reliably in the example study area at county-level [59,60]. This identified methodology can be adopted to assess and monitor the spatio-temporal pattern of URED in wide time span, especially at county-level. However, only 17 potential indictors were chosen due to the availability of good quality data with the necessary temporal and spatial resolution, the evaluation index system is required to further add relevant indicators. As URED usually occurs over a wider time span, the case study with a time span of just 10 years was not enough to understand the dynamics of long-run processes of URED [61]. Additionally, it should be noted that this study was conducted just in Chengdu at county-level, this methodology requires further study to increase their level of applicability and efficiency at all spatial and temporal scales, which might give some new insights [62,63,64]. The authors are aware that a single case study cannot prove a theoretical framework; nevertheless, the findings can serve as a useful reference to monitor dynamic changes in sustainable urban and rural development for planners and policy makers.

Acknowledgments

This study was supported by the National Natural Science Foundation of China (Project No. 41371427/D0108 and 41271455/D0108).

Author Contributions

Deng Chen, Yanxia Wang, Fu Ren, and Qingyun Du worked collectively. Specifically, Qingyun Du developed the original idea for the study and conducted the organization of the content. Deng Chen conducted the experiments of measuring the urban-rural equalized development and performed the analysis of the results. Yanxia Wang and Fu Ren provided literature guidance and developed a proposal for the study. All of the co-authors drafted and revised the article collectively, and all authors read and approved the final manuscript.

Conflicts of Interest

The authors declare no conflict of interest.

References

  1. James, T.M. The socio-spatial dynamics of development: Geographical insights beyond the 2009 World Development Report. Camb. J. Reg. Econ. Soc. 2011, 4, 175–188. [Google Scholar]
  2. Gao, Z. Development path of urban-rural integration. Asian Agric. Res. 2012, 4, 53–89. [Google Scholar]
  3. Liu, Y.S.; Lu, S.S.; Chen, Y.F. Spatio-temporal change of urban–rural equalized development patterns in China and its driving factors. J. Rural Stud. 2013, 32, 320–330. [Google Scholar] [CrossRef]
  4. Yu, A.T.W.; Wu, Y.Z.; Zheng, B.B.; Zhang, X.L.; Shen, L.Y. Identifying risk factors of urban-rural conflict in urbanization: A case of China. Habitat Int. 2014, 44, 177–185. [Google Scholar] [CrossRef]
  5. Li, Y.H.; Hu, Z.C. Approaching Integrated Urban-Rural Development in China: The Changing Institutional Roles. Sustainability 2015, 6, 7031–7048. [Google Scholar] [CrossRef]
  6. André, T.; Frédéric, W. Towards New Paths for Regional and Territorial Development in Rural Areas. Eur. Plan. Stud. 2015, 23, 650–677. [Google Scholar]
  7. Tong, G.J.; Wang, T.K. The Estimated and Assessed Study on Urban-Rural Integration Course in Northeast China. In Future Wireless Networks and Information Systems; Springer: Berlin, Heidelberg, Germany, 2015; Volume 144, pp. 637–644. [Google Scholar]
  8. Su, C.W.; Liu, T.Y.; Chang, H.L.; Jiang, X.Z. Is urbanization narrowing the urban-rural income gap? A cross-regional study of China. Habitat Int. 2015, 48, 79–86. [Google Scholar] [CrossRef]
  9. Wang, J.G.; Wang, X.P. New urbanization: A new vision of China’s urban–rural development and planning. Frontiers of Architectural Research. 2015, 4, 166–168. [Google Scholar] [CrossRef]
  10. Afridi, F.; Li, S.X.; Ren, Y.F. Social identity and inequality: The impact of China’s hukou system. J. Public Econ. 2015, 123, 17–29. [Google Scholar] [CrossRef]
  11. Li, Y.H. Urban–rural interaction patterns and dynamic land use: Implications for urban-rural integration in China. Reg. Environ Chang. 2012, 12, 803–812. [Google Scholar] [CrossRef]
  12. Liu, Z.Q. Institution and inequality: The hukou system in China. J. Comp. Econ. 2005, 33, 133–157. [Google Scholar] [CrossRef]
  13. Chen, Y.P.; Liu, M.; Zhang, Q. Development of financial intermediation and the dynamics of urban-rural disparity in China, 1978–1998. Reg. Stud. 2010, 44, 1171–1187. [Google Scholar] [CrossRef]
  14. Long, H.L.; Zou, J.; Jessica, P.; Li, Y.R. Analysis of rural transformation development in China since the turn of the new millennium. Appl. Geogr. 2011, 31, 1094–1105. [Google Scholar] [CrossRef]
  15. Li, M.N.; Han, X.P. Financing Problems in China’s Rural Areas. J. Northeast Agric. Univ. (Engl. Ed.) 2014, 21, 80–89. [Google Scholar]
  16. Zhang, X.Y. Two Sessions Observation: 0.9 million Villages have Disappeared in Ten Years and Ancient Villages Need Urgent Protection in China. Available online: http://china.huanqiu.com/hot/2015-03/5878357.html (accessed on 11 May 2015). (In Chinese)
  17. Hayashi, T. Measuring rural–urban disparity with the Genuine Progress Indicator: A case study in Japan. Ecol. Econ. 2015, 120, 260–271. [Google Scholar] [CrossRef]
  18. Dai, H.J.; Sun, T.; Zhang, K.; Guo, W. Research on rural nonpoint source pollution in the process of urban-rural integration in the economically-developed area in China based on the improved STIRPAT model. Sustainability 2015, 7, 782–793. [Google Scholar] [CrossRef]
  19. Huang, L.; Yan, L.J.; Wu, J.G. Assessing urban sustainability of Chinese megacities: 35 years after the economic reform and open-door policy. Landsc. Urban Plan. 2016, 145, 57–70. [Google Scholar] [CrossRef]
  20. Liu, Y.S.; Wang, L.J.; Long, H.L. Spatio-temporal analysis of land-use conversion in the eastern coastal China during 1996–2005. J. Geogr. Sci. 2008, 18, 274–282. [Google Scholar] [CrossRef]
  21. Zhai, R.X.; Liu, Y.S. Dynamic evolvement of agriculture system and typical patterns of modern agriculture in coastal China: A case of Suzhou. Chin. Geogr. Sci. 2009, 19, 249–257. [Google Scholar] [CrossRef]
  22. Svein, T. Urban-rural Interrelationship: Conditions for sustainable Development. In Proceedings of the 2nd FIG Regional Conference, Marrakech, Morocco, 2–5 December 2003.
  23. Long, H.L.; Liu, Y.S.; Li, X.B.; Chen, Y.F. Building new countryside in China: A geographical perspective. Land Use Policy 2010, 27, 457–470. [Google Scholar] [CrossRef]
  24. Pablo, G. Ecosystem services: Foundations for a new rural–urban compact. Ecol. Econ. 2007, 62, 383–387. [Google Scholar]
  25. Xue, D.S.; Huang, G.Z.; Guan, J.W.; Lin, J.R. Changing concepts of city and urban planning practices in Guangzhou (1949–2010): An approach to sustainable urban development. Chin. Geogr. Sci. 2014, 24, 607–619. [Google Scholar] [CrossRef]
  26. Li, P.; Liu, S.Q.; Sun, L. Spatial-temporal changes of rurality driven by urbanization and industrialization: A case study of the Three Gorges Reservoir Area in Chongqing, China. Habitat Int. 2016, 51, 124–132. [Google Scholar]
  27. Kawka, R. Growth and Innovation through Urban-Rural Partnership. In Guiding Principles for Spatial Development in Germany; Springer: Heidelberg, Germany, 2009; pp. 1–17. [Google Scholar]
  28. Partridge, M.D.; Ali, K.; Olfert, M.R. Rural-to-Urban Commuting: Three Degrees of Integration. Growth Chang. 2010, 41, 303–335. [Google Scholar] [CrossRef]
  29. Horlings, L.G.; Kanemasu, Y. Sustainable development and policies in rural regions; insights from the Shetland Islands. Land Use Policy 2015, 49, 310–321. [Google Scholar] [CrossRef]
  30. Palmisano, G.O.; Govindan, K.; Loisi, R.V.; Sasso, P.D.; Roma, R. Greenways for rural sustainable development: An integration between geographic information systems and group analytic hierarchy process. Land Use Policy 2016, 50, 429–440. [Google Scholar] [CrossRef]
  31. Zhang, X.; Wu, Y.; Skitmore, M.; Jiang, S. Sustainable infrastructure projects in balancing urban–rural development: Towards the goal of efficiency and equity. J. Clean. Prod. 2014, 107, 445–454. [Google Scholar] [CrossRef]
  32. Tang, Y.; Mason, R.J.; Wang, Y. Governments’ functions in the process of integrated consolidation and allocation of rural–urban construction land in China. J. Rural Stud. 2015, 42, 43–51. [Google Scholar] [CrossRef]
  33. Hong, Y.X. Integrated Urban-Rural Development. In The China Path to Economic Transition and Development; Springer Science & Business Media: Gateway East, Singapore, 2016; pp. 151–169. [Google Scholar]
  34. Chen, A.M.; Gao, J. Urbanization in China and the coordinate development model-the case of Chengdu. Soc. Sci. J. 2011, 48, 500–513. [Google Scholar] [CrossRef]
  35. Shen, L.Y.; Jiang, S.J.; Yuan, H.P. Critical indicators for assessing the contribution of infrastructure projects to coordinated urban–rural development in China. Habitat Int. 2012, 36, 237–246. [Google Scholar] [CrossRef]
  36. Jiang, S.J.; Shen, L.Y.; Zhou, L. Empirical Study on the Contribution of Infrastructure to the Coordinated Development between Urban and Rural Areas: Case Study on Water Supply Projects. Procedia Environ. Sci. 2011, 11, 1113–1118. [Google Scholar]
  37. Long, H.L.; Zou, J.; Liu, Y.S. Differentiation of rural development driven by industrialization and urbanization in eastern coastal China. Habitat Int. 2009, 33, 454–462. [Google Scholar] [CrossRef]
  38. Li, K.; Yang, Q.J. Research of property rights institution in ChengDu’s urban-rural integration development: A case study. Procedia Eng. 2011, 21, 700–706. [Google Scholar]
  39. Zhong, Z.; Guang, Y. Study on the machanism evolution of China’s urban-rural integration development planning and its land system in practice. Energy Procedia 2011, 5, 1852–1858. [Google Scholar] [CrossRef]
  40. Tang, Y.; Mason, R.J.; Sun, P. Interest distribution in the process of coordination of urban and rural construction land in China. Habitat Int. 2012, 36, 388–395. [Google Scholar] [CrossRef]
  41. Liu, Y.S.; Cheng, C.; Li, Y.R. Differentiation regularity of urban-rural equalized development at prefecture-level city in China. J. Geogr. Sci. 2015, 25, 1075–1088. [Google Scholar] [CrossRef]
  42. Liu, Y.S.; Wang, G.G.; Zhang, F.G. Spatial-temporal dynamic patterns of rural area development in eastern coastal China. Chin. Geogr.Sci. 2013, 23, 173–181. [Google Scholar] [CrossRef]
  43. Kaiser, H.F. An index of factorial simplicity. Psychometrika 1974, 39, 31–36. [Google Scholar] [CrossRef]
  44. Liu, Y.S.; Hu, Z.C.; Li, Y.H. Process and cause of urban-rural development transformation in the Bohai Rim Region, China. Integral Transform. Spec. Funct. 2014, 24, 1147–1160. [Google Scholar] [CrossRef]
  45. Jiao, B.F.; Lin, D.; Peng, J.N. The New Construction and Application of the Estimation System of Urban and Rural Integration--The Estimation of Urban and Rural Integration in Yangtze River Delta Area. FUDAN J. (Soc. Sci.) 2010, 4, 75–83. (In Chinese) [Google Scholar]
  46. Huang, S.L.; Wong, J.H.; Chen, T.C. A framework of indicator system for measuring Taipei’s urban sustainability. Landsc. Urban Plan. 1998, 42, 15–27. [Google Scholar] [CrossRef]
  47. Gu, Y.K.; Xu, Y.J. Study on evaluation index system of urban and rural integration. Zhejiang Soc. Sci. 2004, 6, 95–99. (In Chinese) [Google Scholar]
  48. Zhao, J.J.; Chai, L.H. A novel approach for urbanization level evaluation based on information entropy principle: A case of Beijing. Phys. A: Stat. Mech. Appl. 2015, 430, 114–125. [Google Scholar] [CrossRef]
  49. Du, Q.Y.; Wang, Y.X.; Ren, F.; Zhao, Z.Y.; Liu, H.Q.; Wu, C.; Li, L.J.; Shen, Y.R. Measuring and Analysis of Urban Competitiveness of Chinese Provincial Capitals in 2010 under the Constraints of Major Function-Oriented Zoning Utilizing Spatial Analysis. Sustainability 2014, 6, 3374–3399. [Google Scholar] [CrossRef]
  50. Ye, Y.M.; Richard, L.; Qin, B. Coordinated Urban-Rural Development Planning in China. J. Am. Plan. Assoc. 2013, 79, 125–137. [Google Scholar] [CrossRef]
  51. Kew, B.; Lee, B.D. Measuring Sprawl across the Urban Rural Continuum Using an Amalgamated Sprawl Index. Sustainability 2013, 5, 1806–1828. [Google Scholar] [CrossRef]
  52. Cerreta, M.; Poli, G. A Complex Values Map of Marginal Urban Landscapes: An Experiment in Naples (Italy). Int. J. Agric. Environ. Inf. Syst. 2013, 4, 41–62. [Google Scholar] [CrossRef]
  53. Verburg, P.H.; Schot, P.P.; Dijst, M.J.; Veldkamp, A. Land use change modelling: Current practice and research priorities. Geojournal 2004, 61, 309–324. [Google Scholar] [CrossRef]
  54. Romano, B.; Zullo, F. The urban transformation of Italy’s Adriatic coastal strip: Fifty years of unsustainability. Land Use Policy 2014, 38, 26–36. [Google Scholar] [CrossRef]
  55. Jantz, C.A.; Goetz, S.J.; Shelley, M.K. Using the SLEUTH Urban Growth Model to Simulate the Impacts of Future Policy Scenarios on Urban Land Use in the Baltimore-Washington Metropolitan Area. Environ. Plan. B Plan. Des. 2004, 31, 251–271. [Google Scholar] [CrossRef]
  56. Amato, F.; Pontrandolfi, P.; Murgante, B. Supporting planning activities with the assessment and the prediction of urban sprawl using spatiotemporal analysis. Ecol. Inf. 2015, 30, 365–378. [Google Scholar] [CrossRef]
  57. Appiah, D.O.; Schröder, D.; Forkuo, E.K.; Bugri, J.T. Application of Geo-Information Techniques in Land Use and Land Cover Change Analysis in a Peri-Urban District of Ghana. ISPRS Int. J. Geo-Inf. 2015, 4, 1265–1289. [Google Scholar] [CrossRef]
  58. Foley, J.A.; Ruth, D.; Asner, G.P.; Barford, C.; Bonan, G.; Carpenter, S.R.; Chapin, F.S.; Coe, M.T.; Daily, G.C.; Holly, K.; et al. Global consequences of land use. Science 2005, 309, 570–574. [Google Scholar] [CrossRef] [PubMed]
  59. Martellozzo, F.; Clarke, K.C. Measuring urban sprawl, coalescence, and dispersal: A case study of Pordenone, Italy. Environ Plan. B Plan. Des. 2011, 38, 1085–1104. [Google Scholar] [CrossRef]
  60. Grimmond, S. Urbanization and global environmental change:local effects of urban warming. Geogr. J. 2007, 173, 83–88. [Google Scholar] [CrossRef]
  61. Amato, F.; Maimone, B.A.; Martellozzo, F.; Nolè, G.; Murgante, B. The Effects of Urban Policies on the Development of Urban Area. Sustainability 2016. [Google Scholar] [CrossRef] [Green Version]
  62. Koomen, E.; Stillwill, J.; Bakema, A.; Scholten, H.J. Modelling Land-Use Change: Progress and Applications; Springer: Dordrecht, The Netherlands, 2007; pp. 234–318. [Google Scholar]
  63. Romano, B.; Zullo, F. Models of Urban Land Use in Europe: Assessment tools and criticalities. Int. J. Agric. Environ. Inf. Syst. 2014, 4, 80–97. [Google Scholar] [CrossRef]
  64. Ahmed, B.; Hasan, R.; Maniruzzaman, K.M. Urban Morphological Change Analysis of Dhaka City, Bangladesh, Using Space Syntax. ISPRS Int. J. Geo-Inf. 2014, 3, 1412–1444. [Google Scholar] [CrossRef]
Figure 1. The economic and social development of China 1978–2013.
Sustainability 08 00422 g001
Figure 2. The geographic distribution of Chengdu City.
Sustainability 08 00422 g002
Figure 3. Spatial pattern change of urban-rural equalized development in Chengdu.
Sustainability 08 00422 g003
Figure 4. Dynamic degree of URED in Chengdu during 2004–2013.
Sustainability 08 00422 g004
Figure 5. Ratio of urban-rural residents’ income and non-agriculture population proportion of Chengdu 2004–2013.
Sustainability 08 00422 g005
Figure 6. Per capita GDP and non-agricultural population of the three tiers of Chengdu 2004–2013.
Sustainability 08 00422 g006
Table 1. Indicator system evaluating urban-rural equalized development.
Target LayerIndex LayerCalculation Formula
Spatial allocationHighway net density (km/km2)
Non-agriculture population proportion (%)
Length of highway (km)/Area of land (km2)
Non-agriculture population (104 person)/Total population at the year-end (104 person)
Community and village density (unit/km2)Number of communities and villages (unit)/Area of land (km2)
Per capita domestic product (GDP) (RMB104 yuan/person)Gross Domestic Product (GDP) (RMB104 yuan )/ Population at the year-end (person)
Percentage of rural non-farm payrolls (%)Rural non-farm employed persons (104 persons)/Rural employed persons (104 persons)
Economic developmentPer capita fixed-asset investment (RMB104 yuan/person)Total investment (RMB104 yuan)/Population at the year-end(person)
Per capita public-budgetary expenditure (RMB 104 yuan/person)Total public-budgetary expenditure (RMB104 yuan)/ Population at the year-end (person)
Index of urban-rural productivity of dual track structure (%) I = ( E a / V a ) / ( E b / V b ) where I is the index of urban-rural productivity of dual track structure; Va and Vb are the added value of the agriculture industry(RMB 104 yuan) and the added value of non-farm industry (RMB 104 yuan); Ea and Eb are the employed population of the agriculture industry and non-farm industry (104 persons)
Average number of full-time teachers per each 100 Regular Secondary School students (person/102 persons)Full time teachers (person)/Student enrolment of Regular Secondary school at the year-end (102 persons)
Social servicesAverage number of hospital beds per 100 inhabitants (beds /102 persons)Number of hospital beds (beds)/Population at the year-end (102 persons)
Persons receiving lowest cost-of-living per 100 inhabitants (person/102 persons)Number of persons receiving lowest cost-of-living (person) /Population at the year-end (102 persons)
Ratio of urban-rural residents’ income (%) x41Per capita net income of rural households (RMB yuan)/Per capita disposable income of urban households (RMB yuan)
Life qualityPer capita retail sales of consumer goods (RMB104 yuan/person)Total retail sales of consumer goods (RMB104 yuan )/ Population at the year-end (person)
Ratio of urban-rural residents’ consumption expenditure (%)Per capita living expenditure of rural households (RMB yuan)/Per capita living expenditure of urban households (RMB yuan)
EcologicalConsumption of chemical fertilizer (104 ton)Amount of chemical fertilizer use (104 ton)
EnvironmentPer capita cultivated land area (mu/person)Cultivated land area (mu)/Population at the year-end (person)
Green coverage rate of built-up area (%)Green coverage areas (km2)/Built-up Areas (km2)
Table 2. Principal components.
ComponentInitial EigenvalueRotation Sum of Squared Loading
Total% of VarianceCumulative %Total% of VarianceCumulative %
I9.15753.86453.8644.90929.12529.125
II2.62615.44669.3104.66127.39756.522
III1.2837.54576.8552.79016.43772.959
IV 0.8515.00681.8611.5648.90281.861
Table 3. Order and category of URED in Chengdu.
RO2004C2004O2007C2007O2010C2010O2013C2013
Jingjiang5I5II5I5I
Qingyang2I3I3I3I
Jinniu3I2I2I2I
Wuhou1I1I1I1I
Chenghua4I4I4I4I
Longquanyi7II10II8II10II
Qingbaijiang8II7II7II12II
Xindu9II8II9II11II
Wenjiang6II6II6II6I
Jintang15III16III17III18III
Shuangliu13III13III12II8II
Pixian16III17III13II15II
Dayi12III9II11II9II
Pujiang11III15III16III16II
Xinjin14III12III10II13II
Dujiangyan10III11III14II7I
Pengzhou19IV19IV19IV19III
Qionglai18III18III18III17III
Chongzhou17III14III15III14II
O2004, O2007, O2010, and O2013 indicate the order for 2004, 2007, 2010, and 2013, respectively; C2004, C2007, C2010, and C2013 indicate the category, respectively.

