
Human Impact on Vegetation Dynamics around Lhasa, Southern Tibetan Plateau, China


Abstract
:1. Introduction
2. Methods
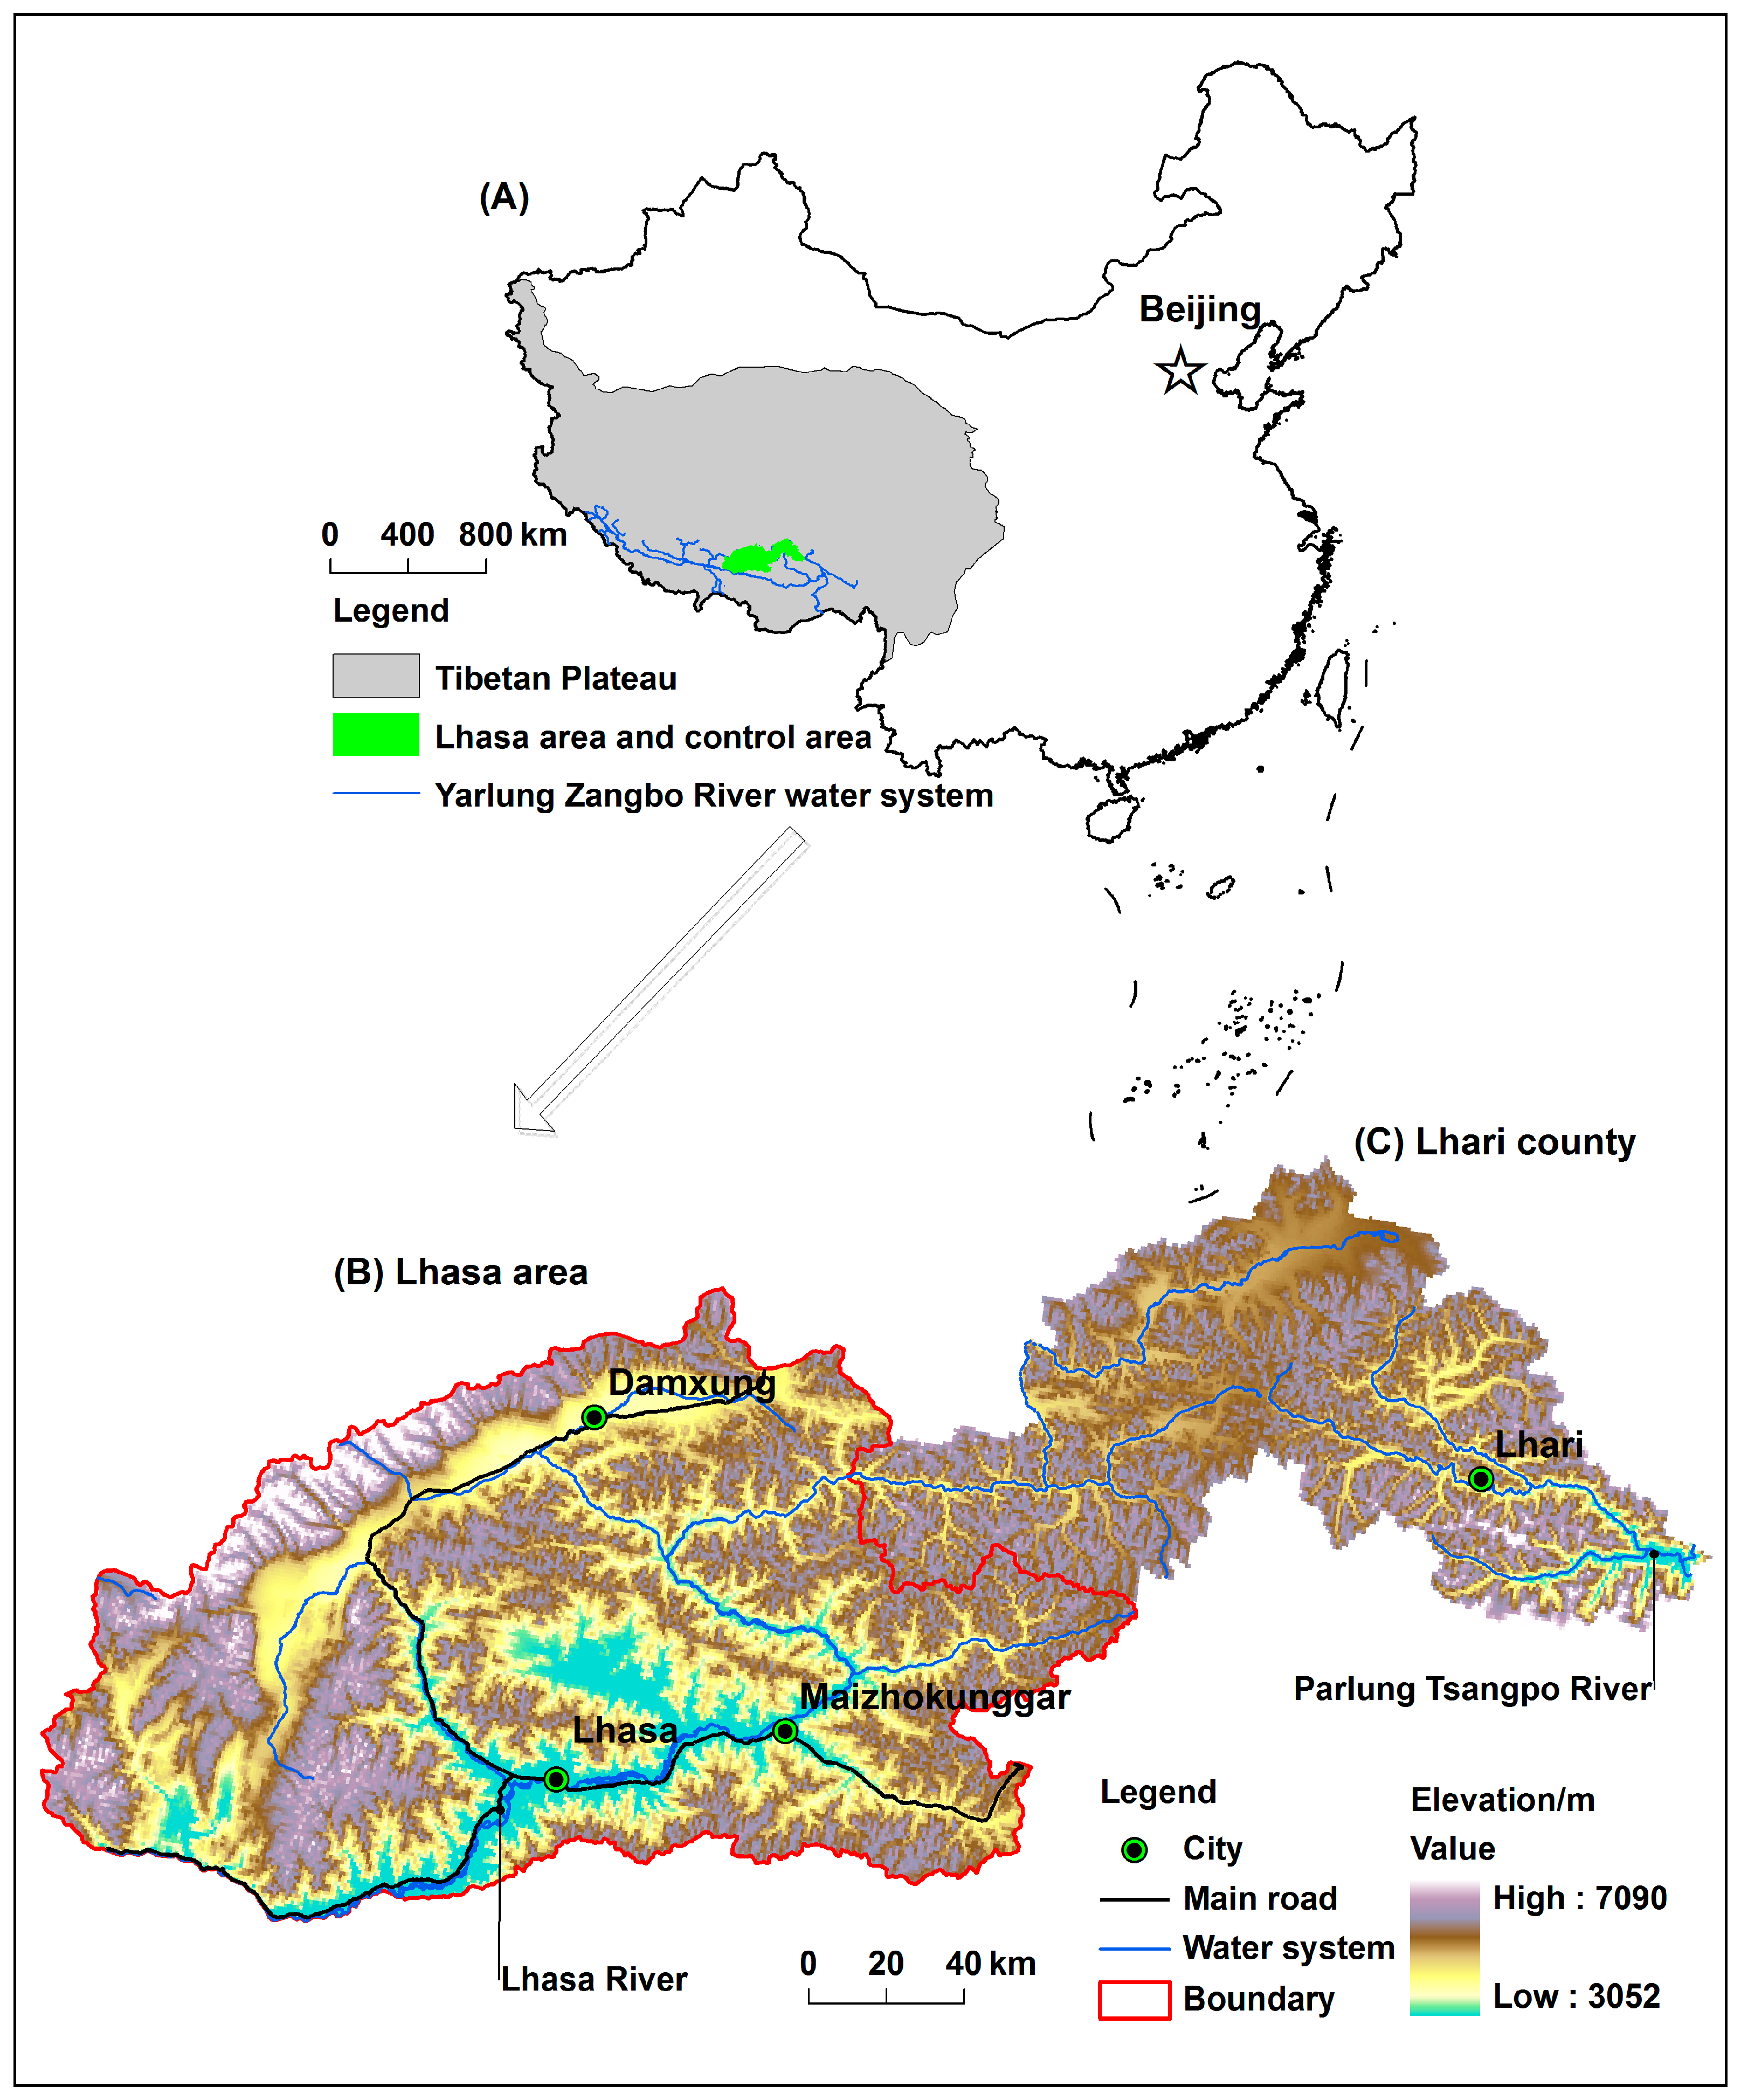
2.1. Study Area
2.2. Data Collection and Analysis
2.2.1. Datasets
2.2.2. Temporal Trend and Correlation Analyses
2.2.3. Spatial Analysis
2.2.4. Grey Relational Analysis
3. Results
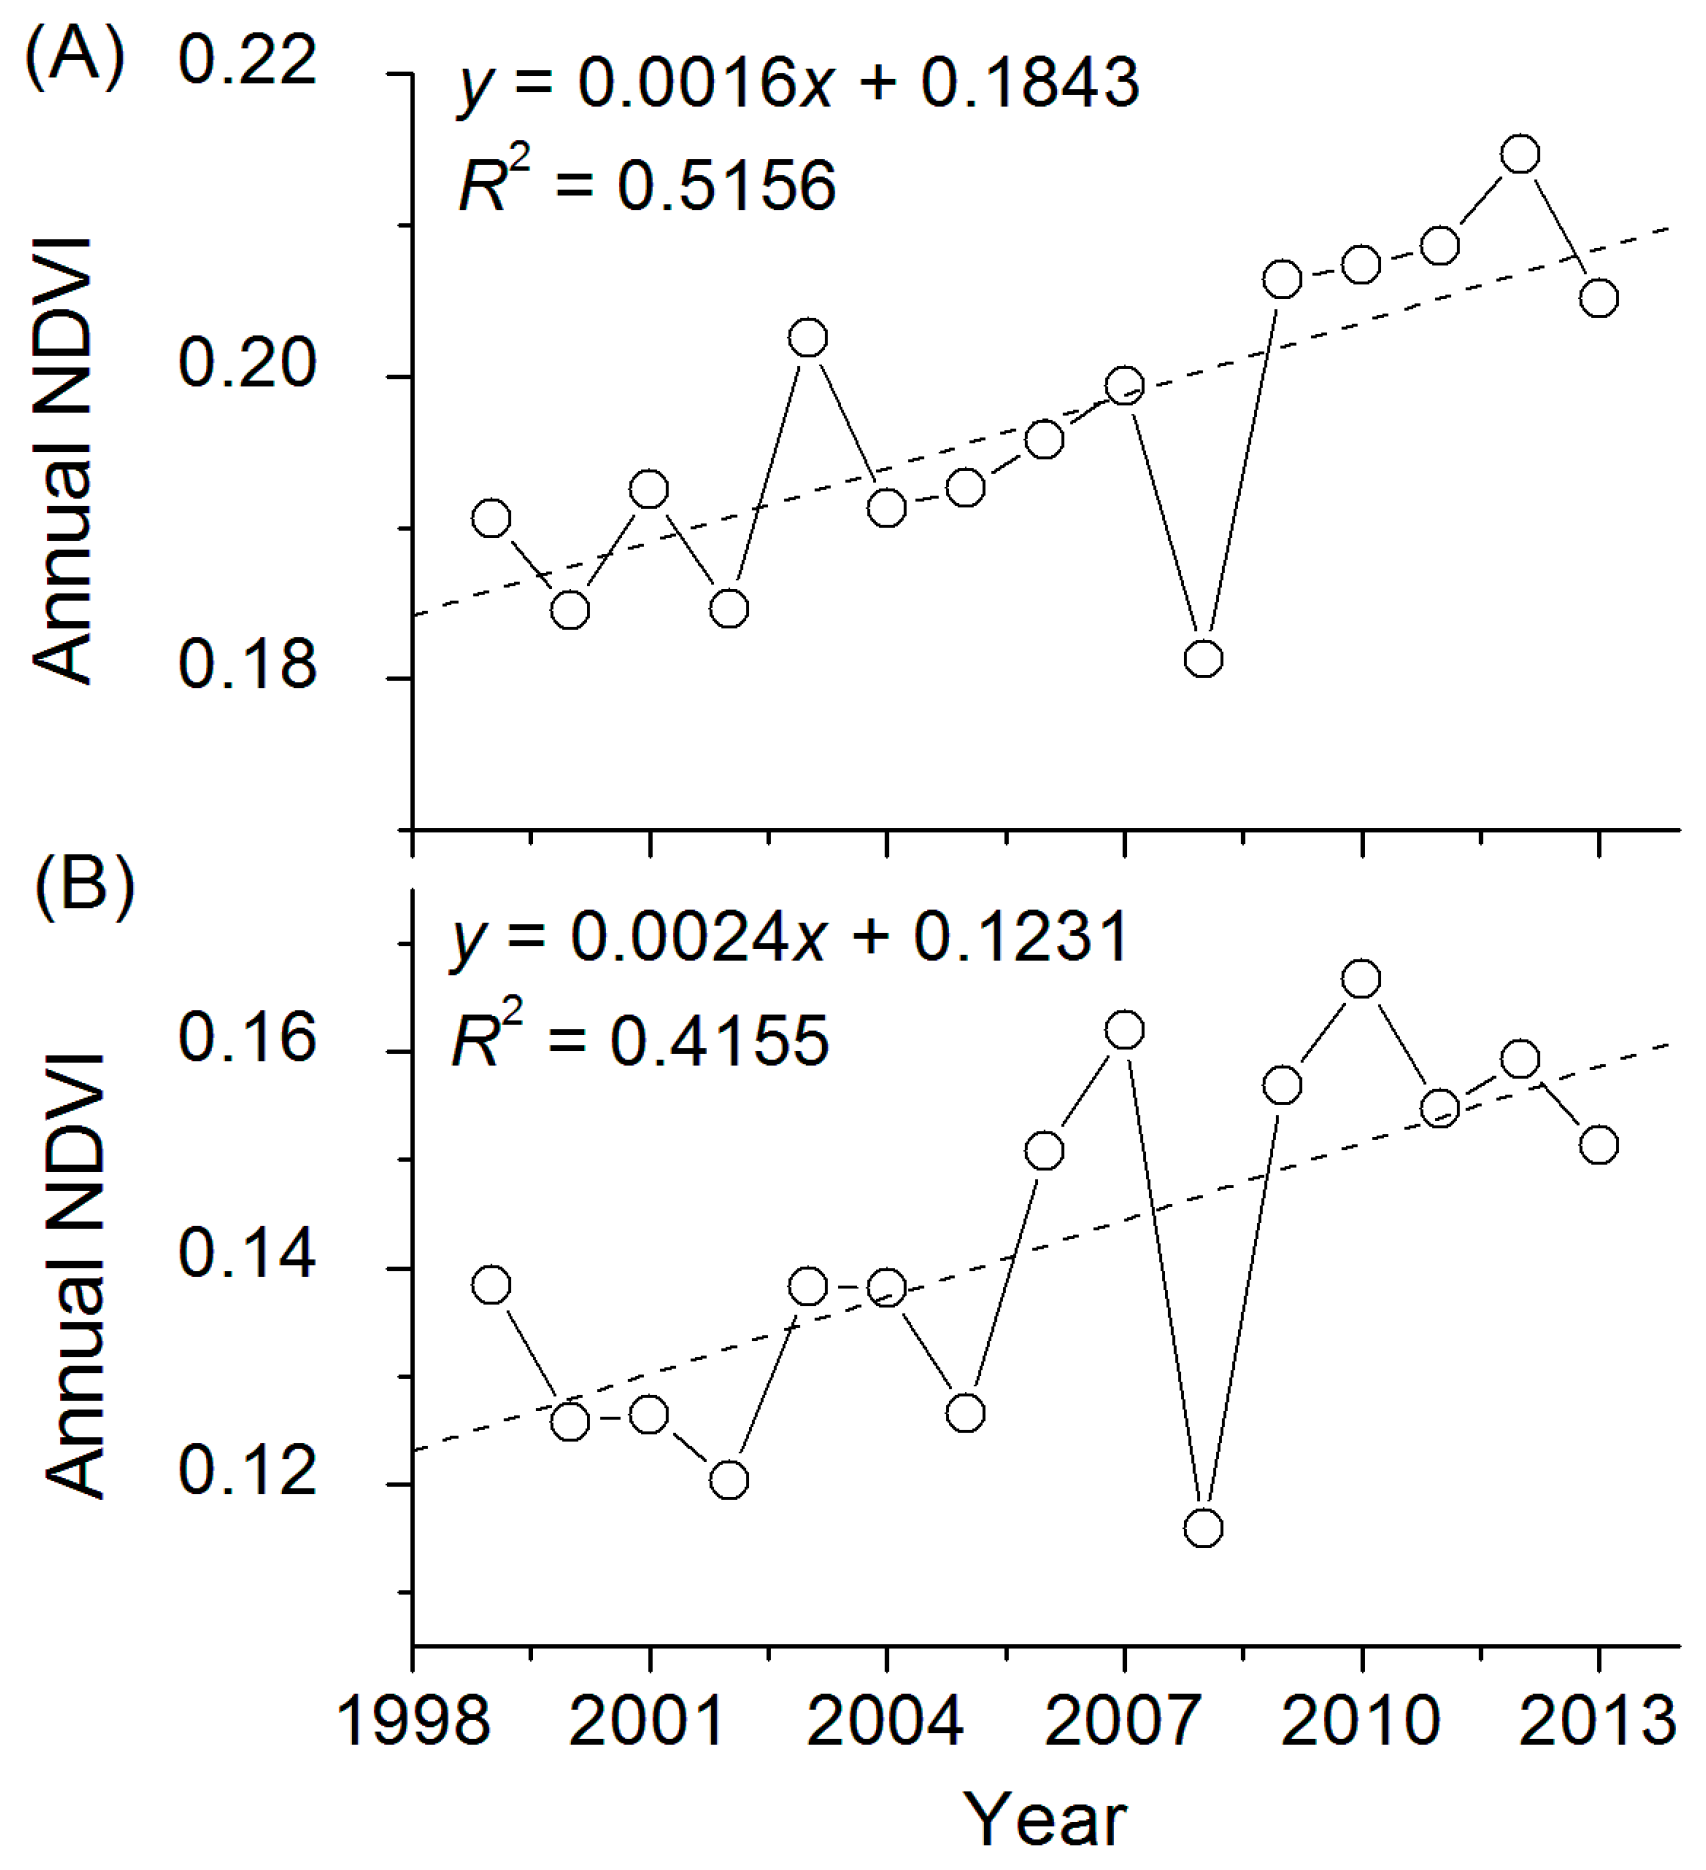
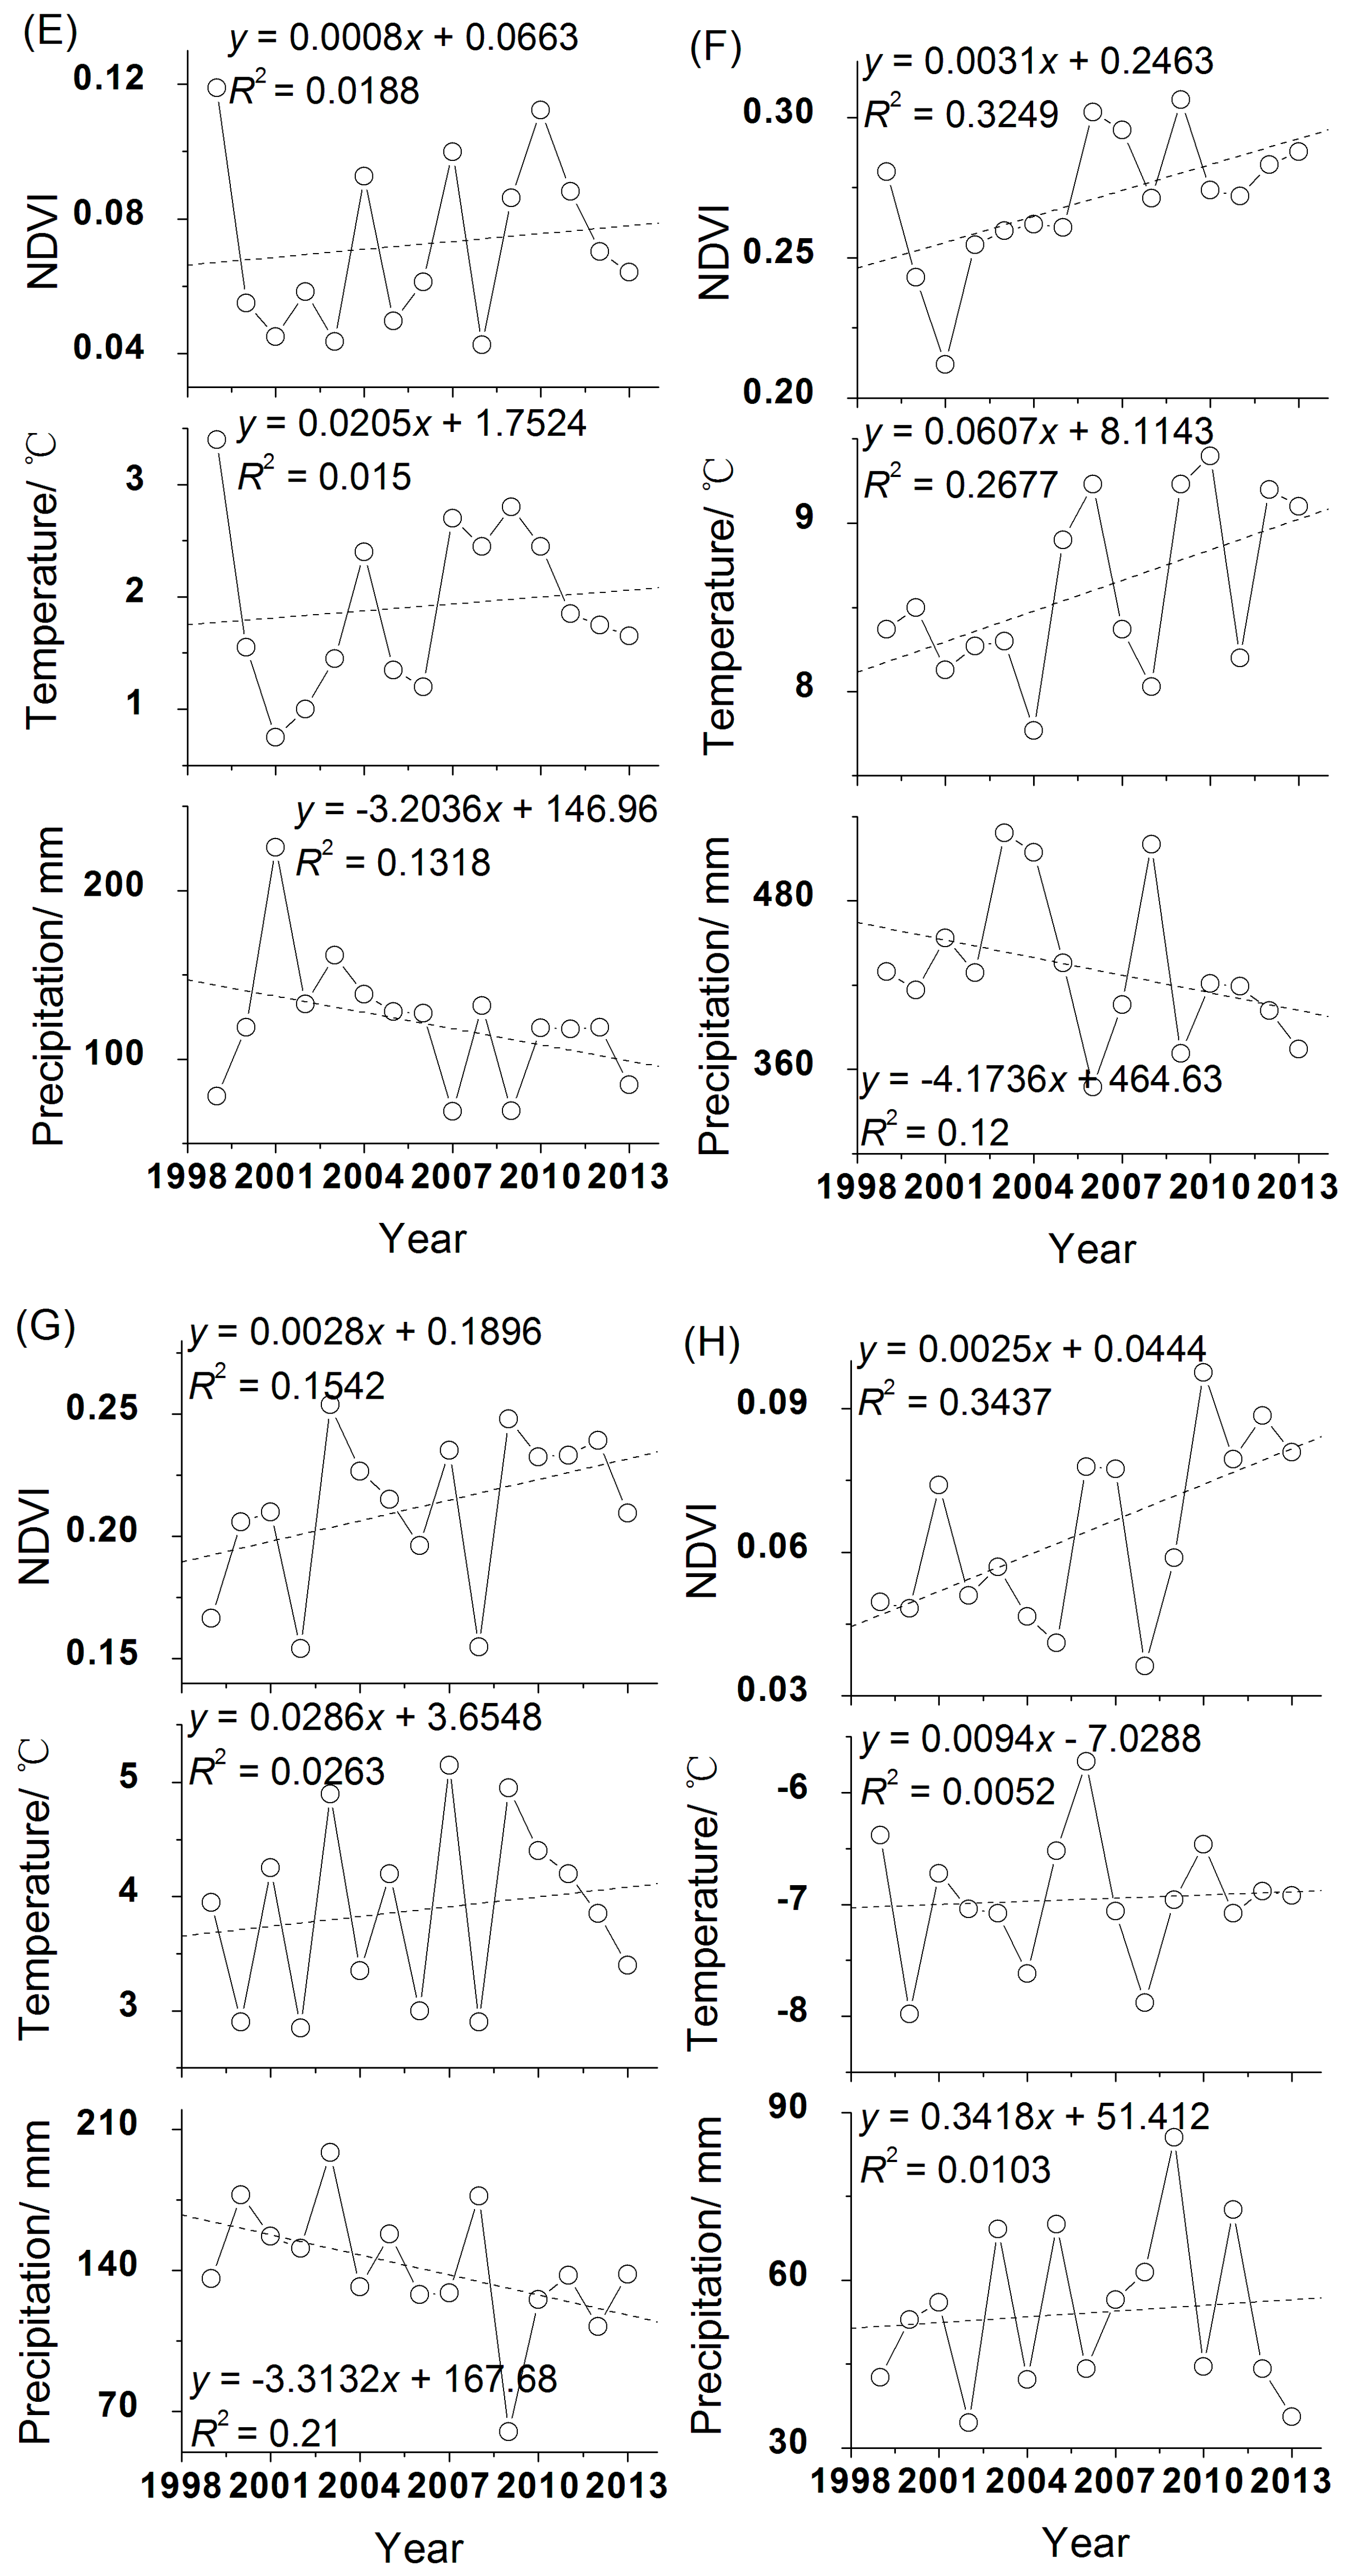
3.1. Temporal Pattern of Annual and Seasonal NDVI Changes
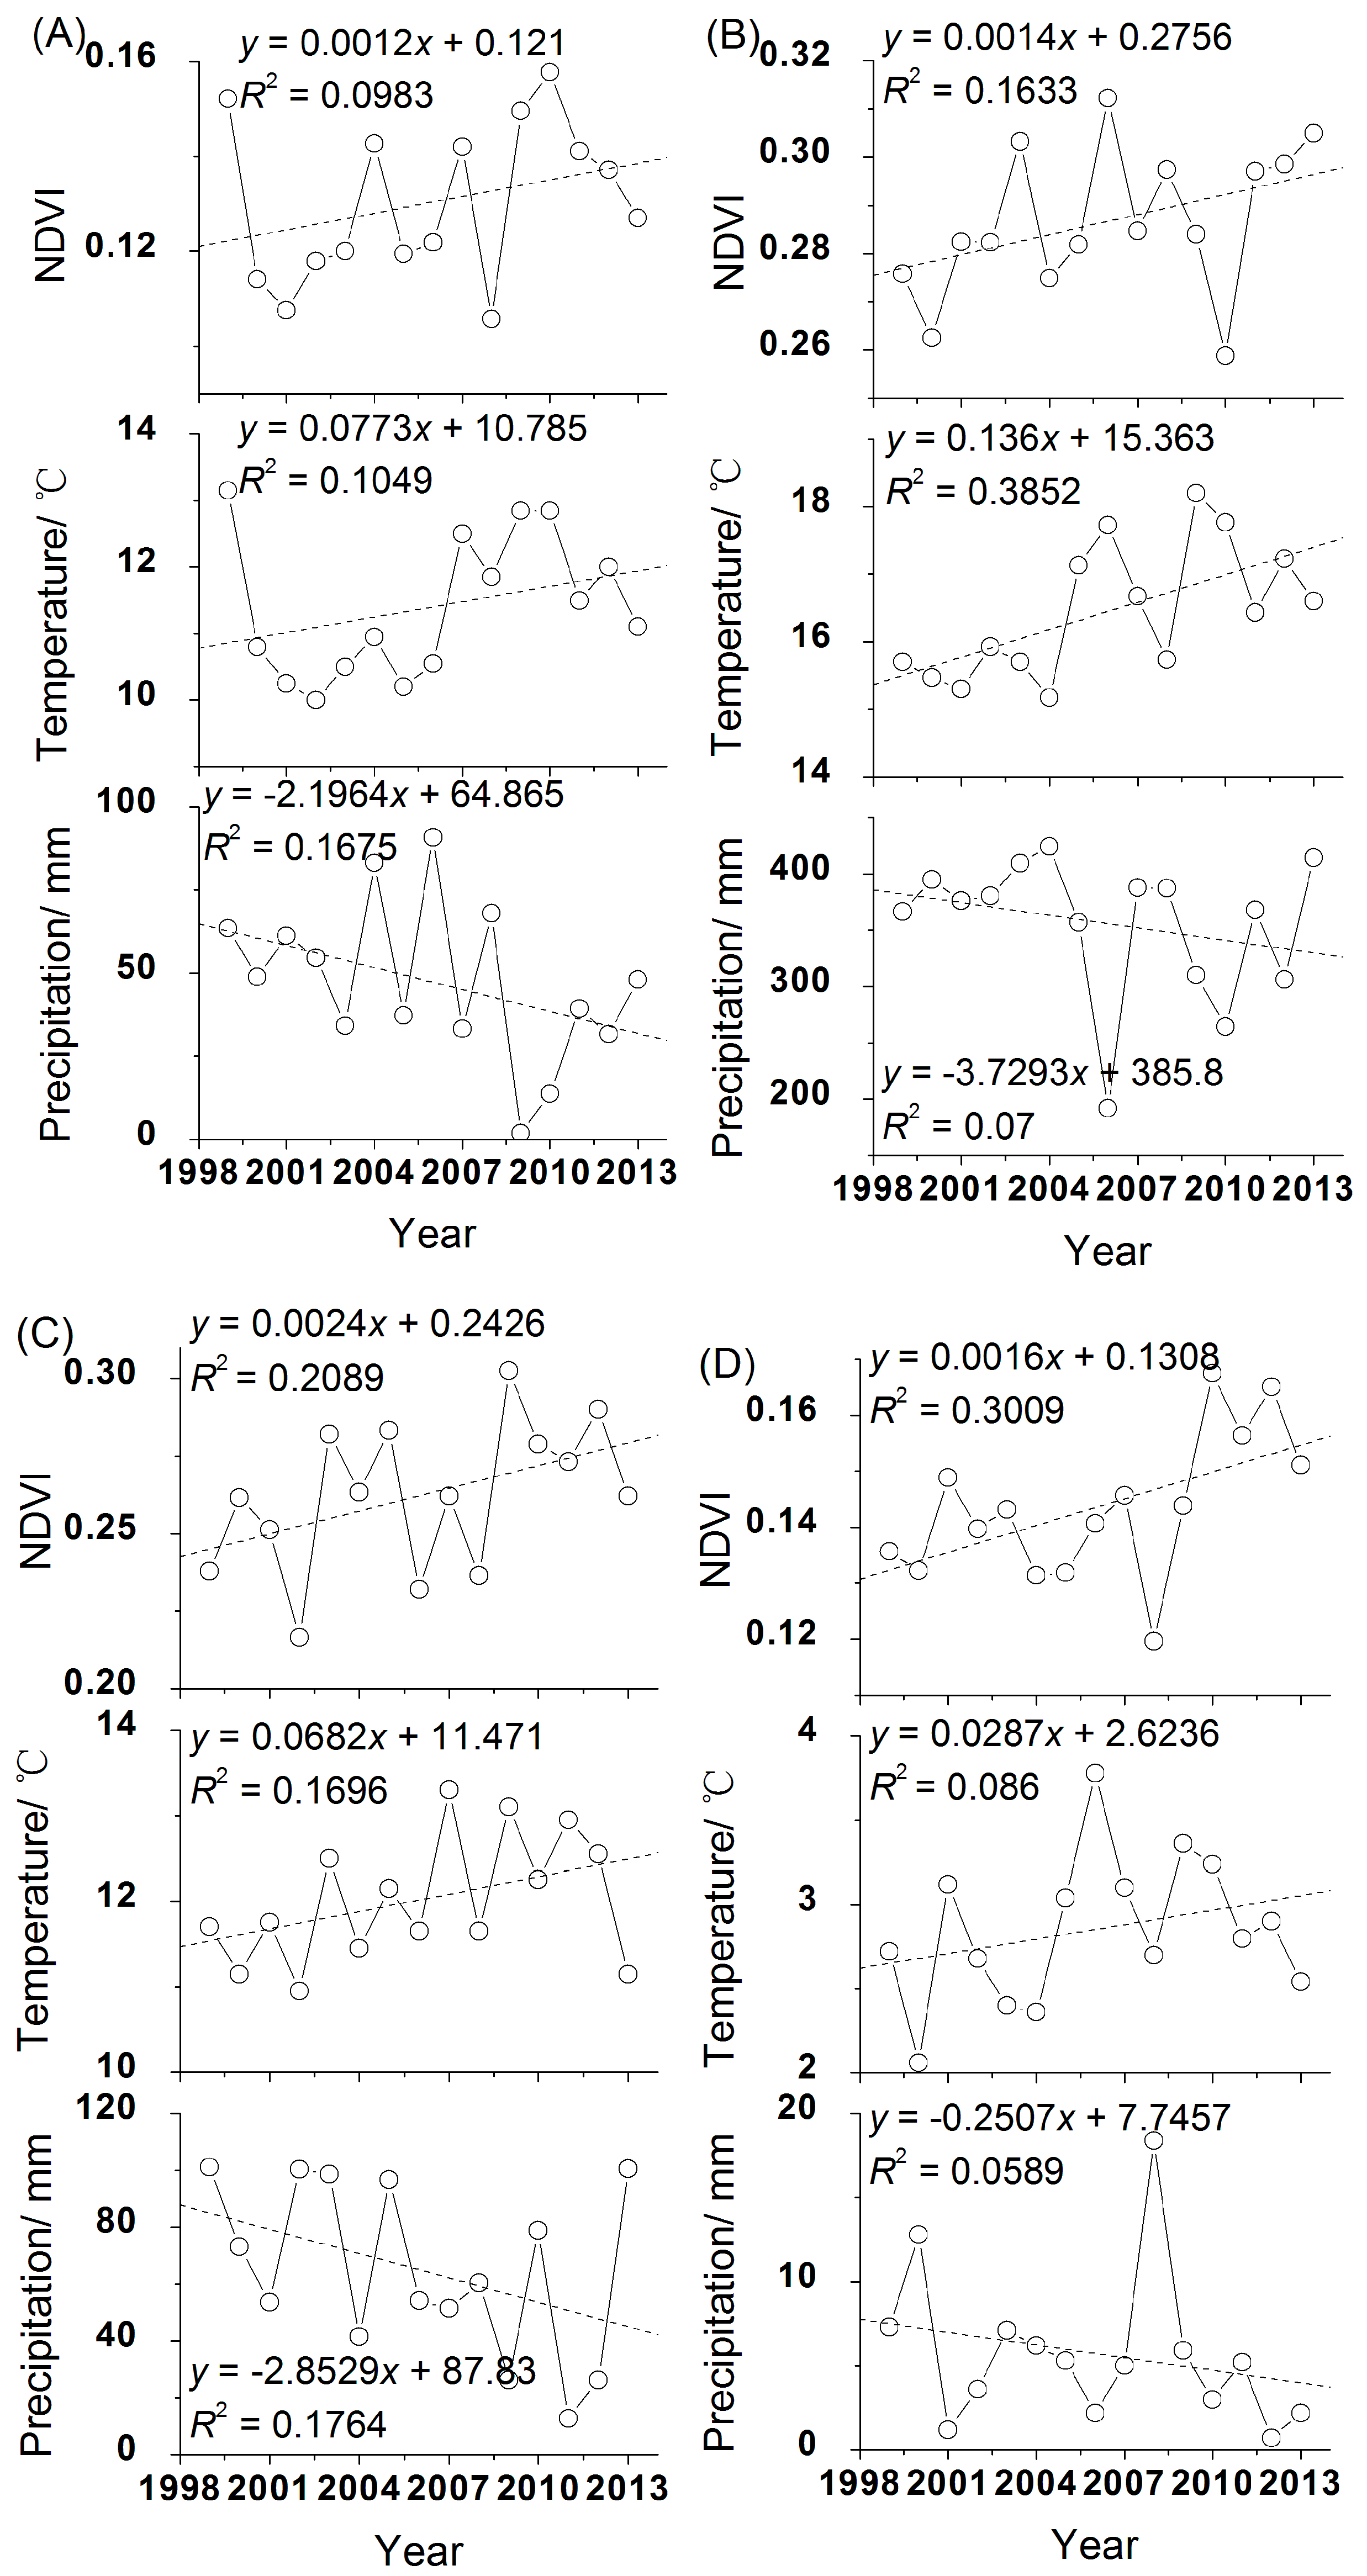
Correlation between NDVI and Climatic Factors
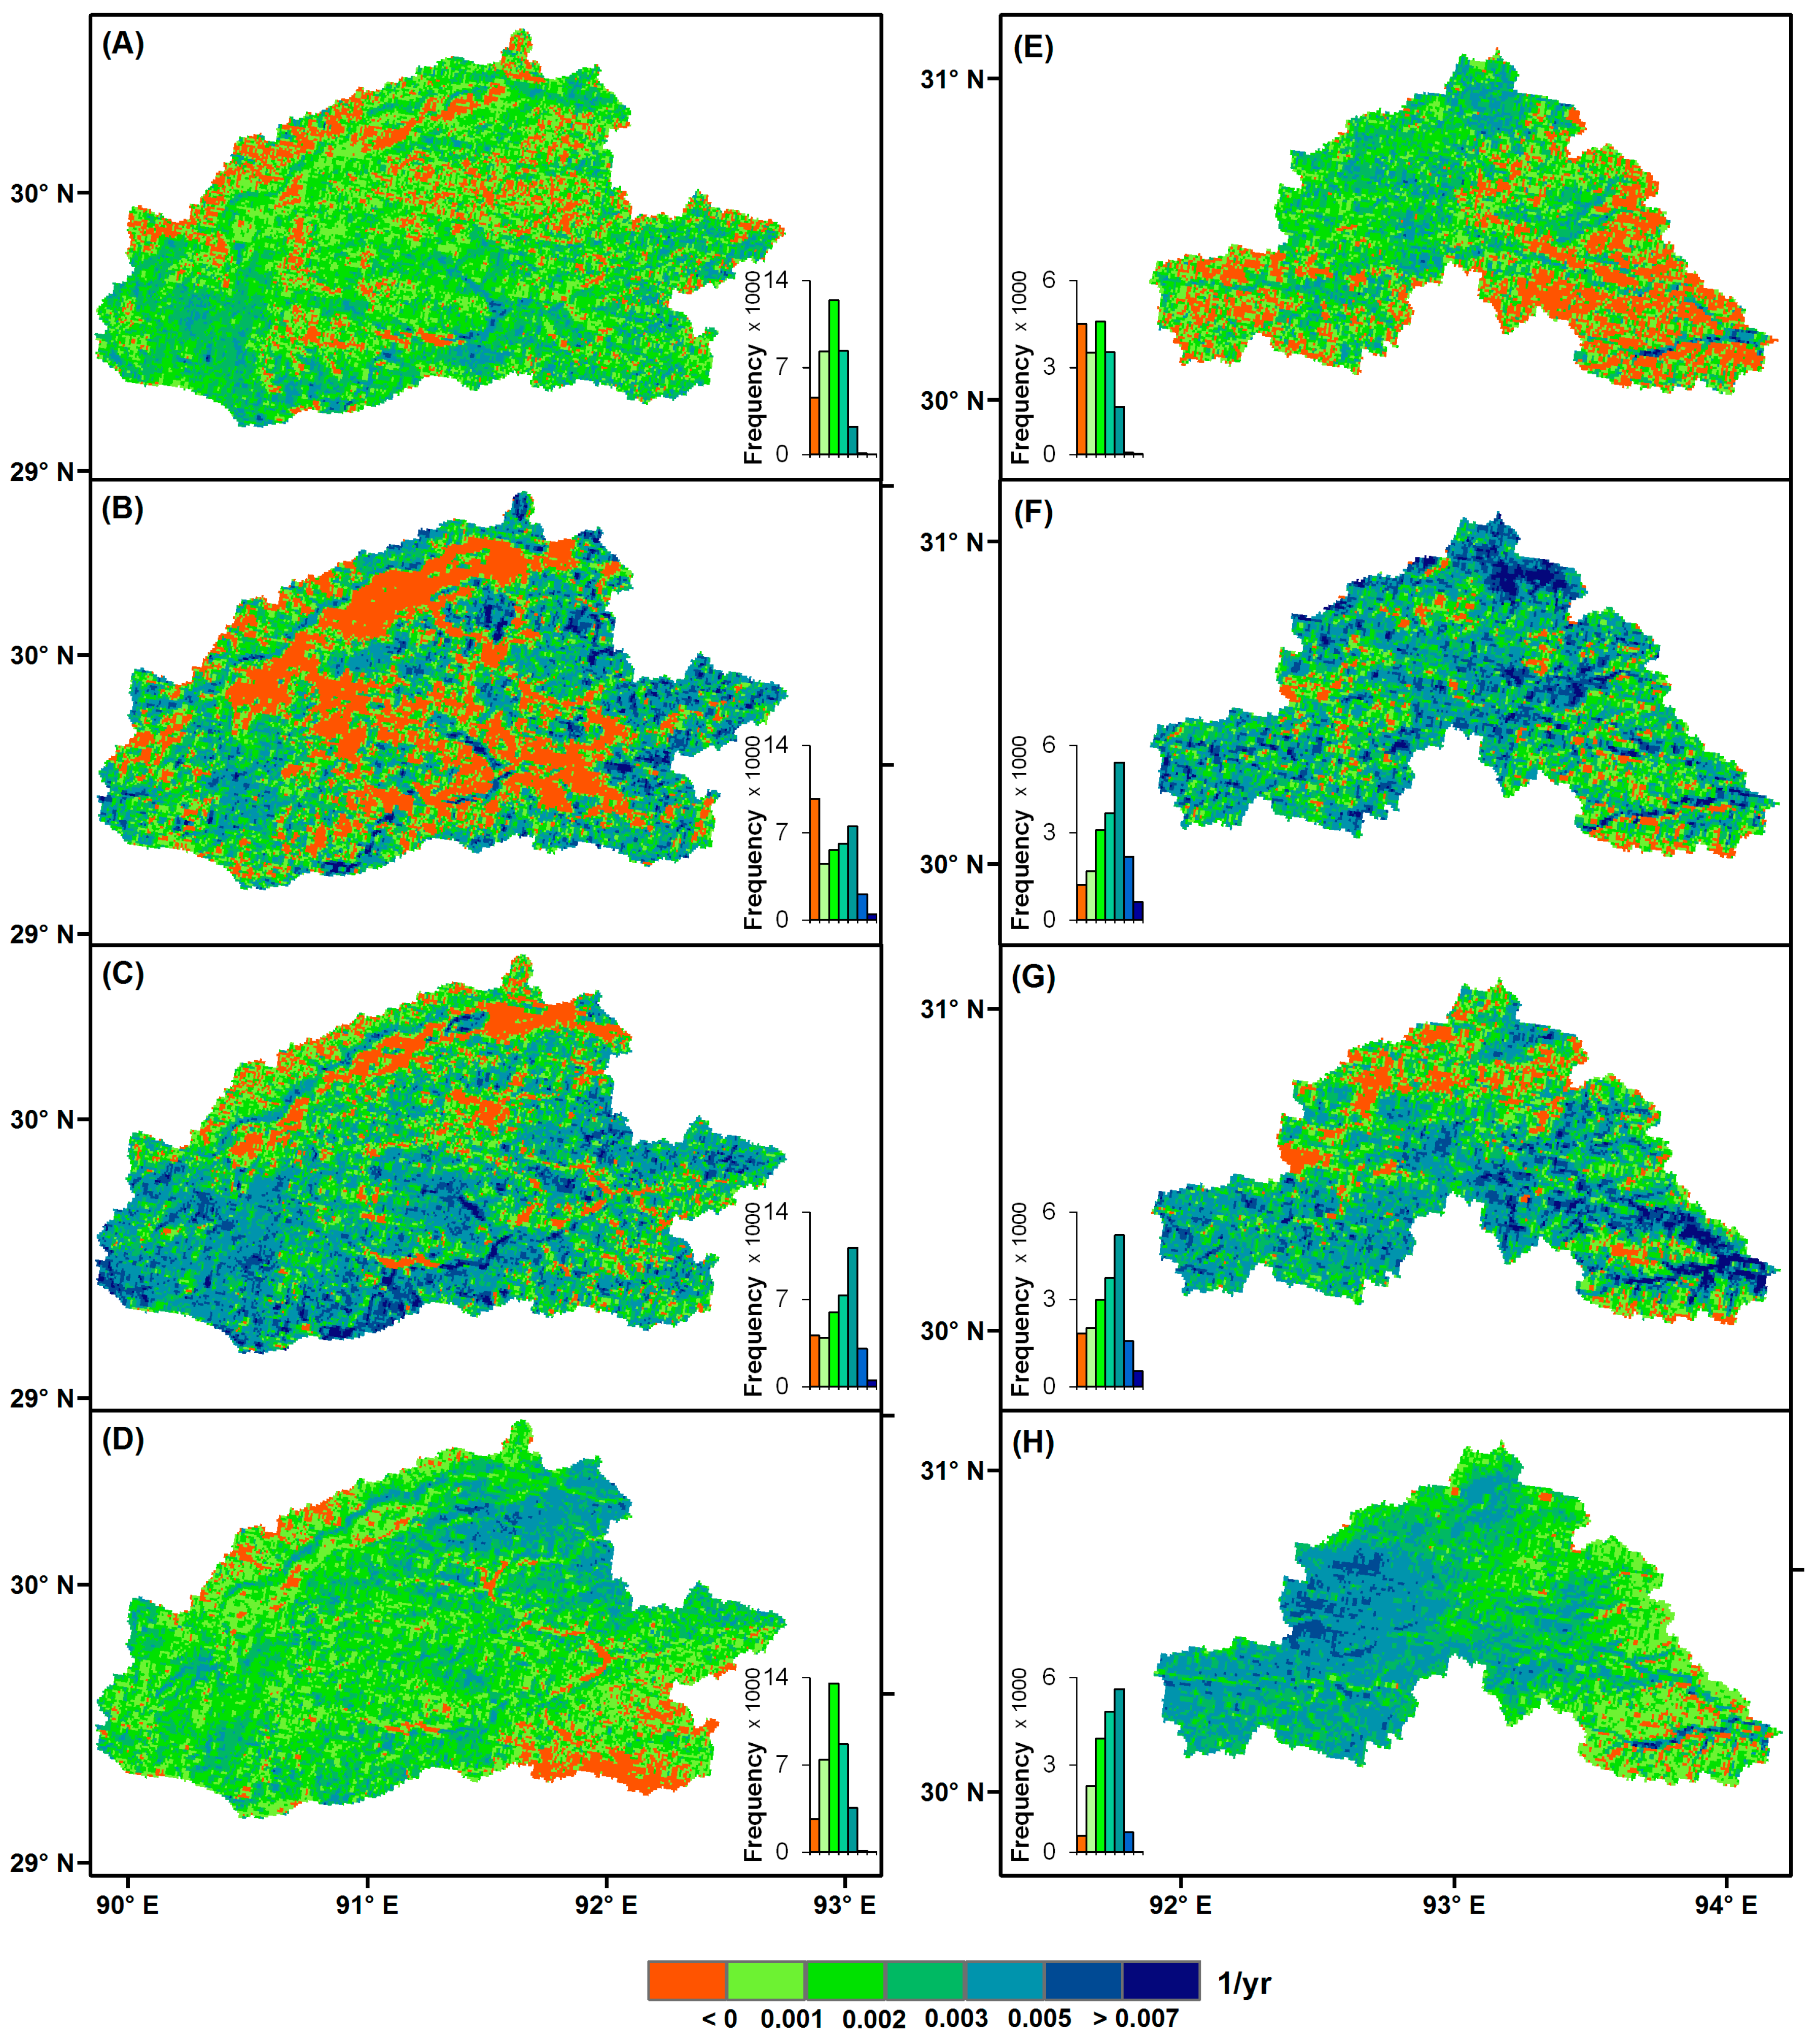
3.2. Spatial Pattern of the NDVI Change
3.2.1. Seasonal Vegetation Greening and Browning
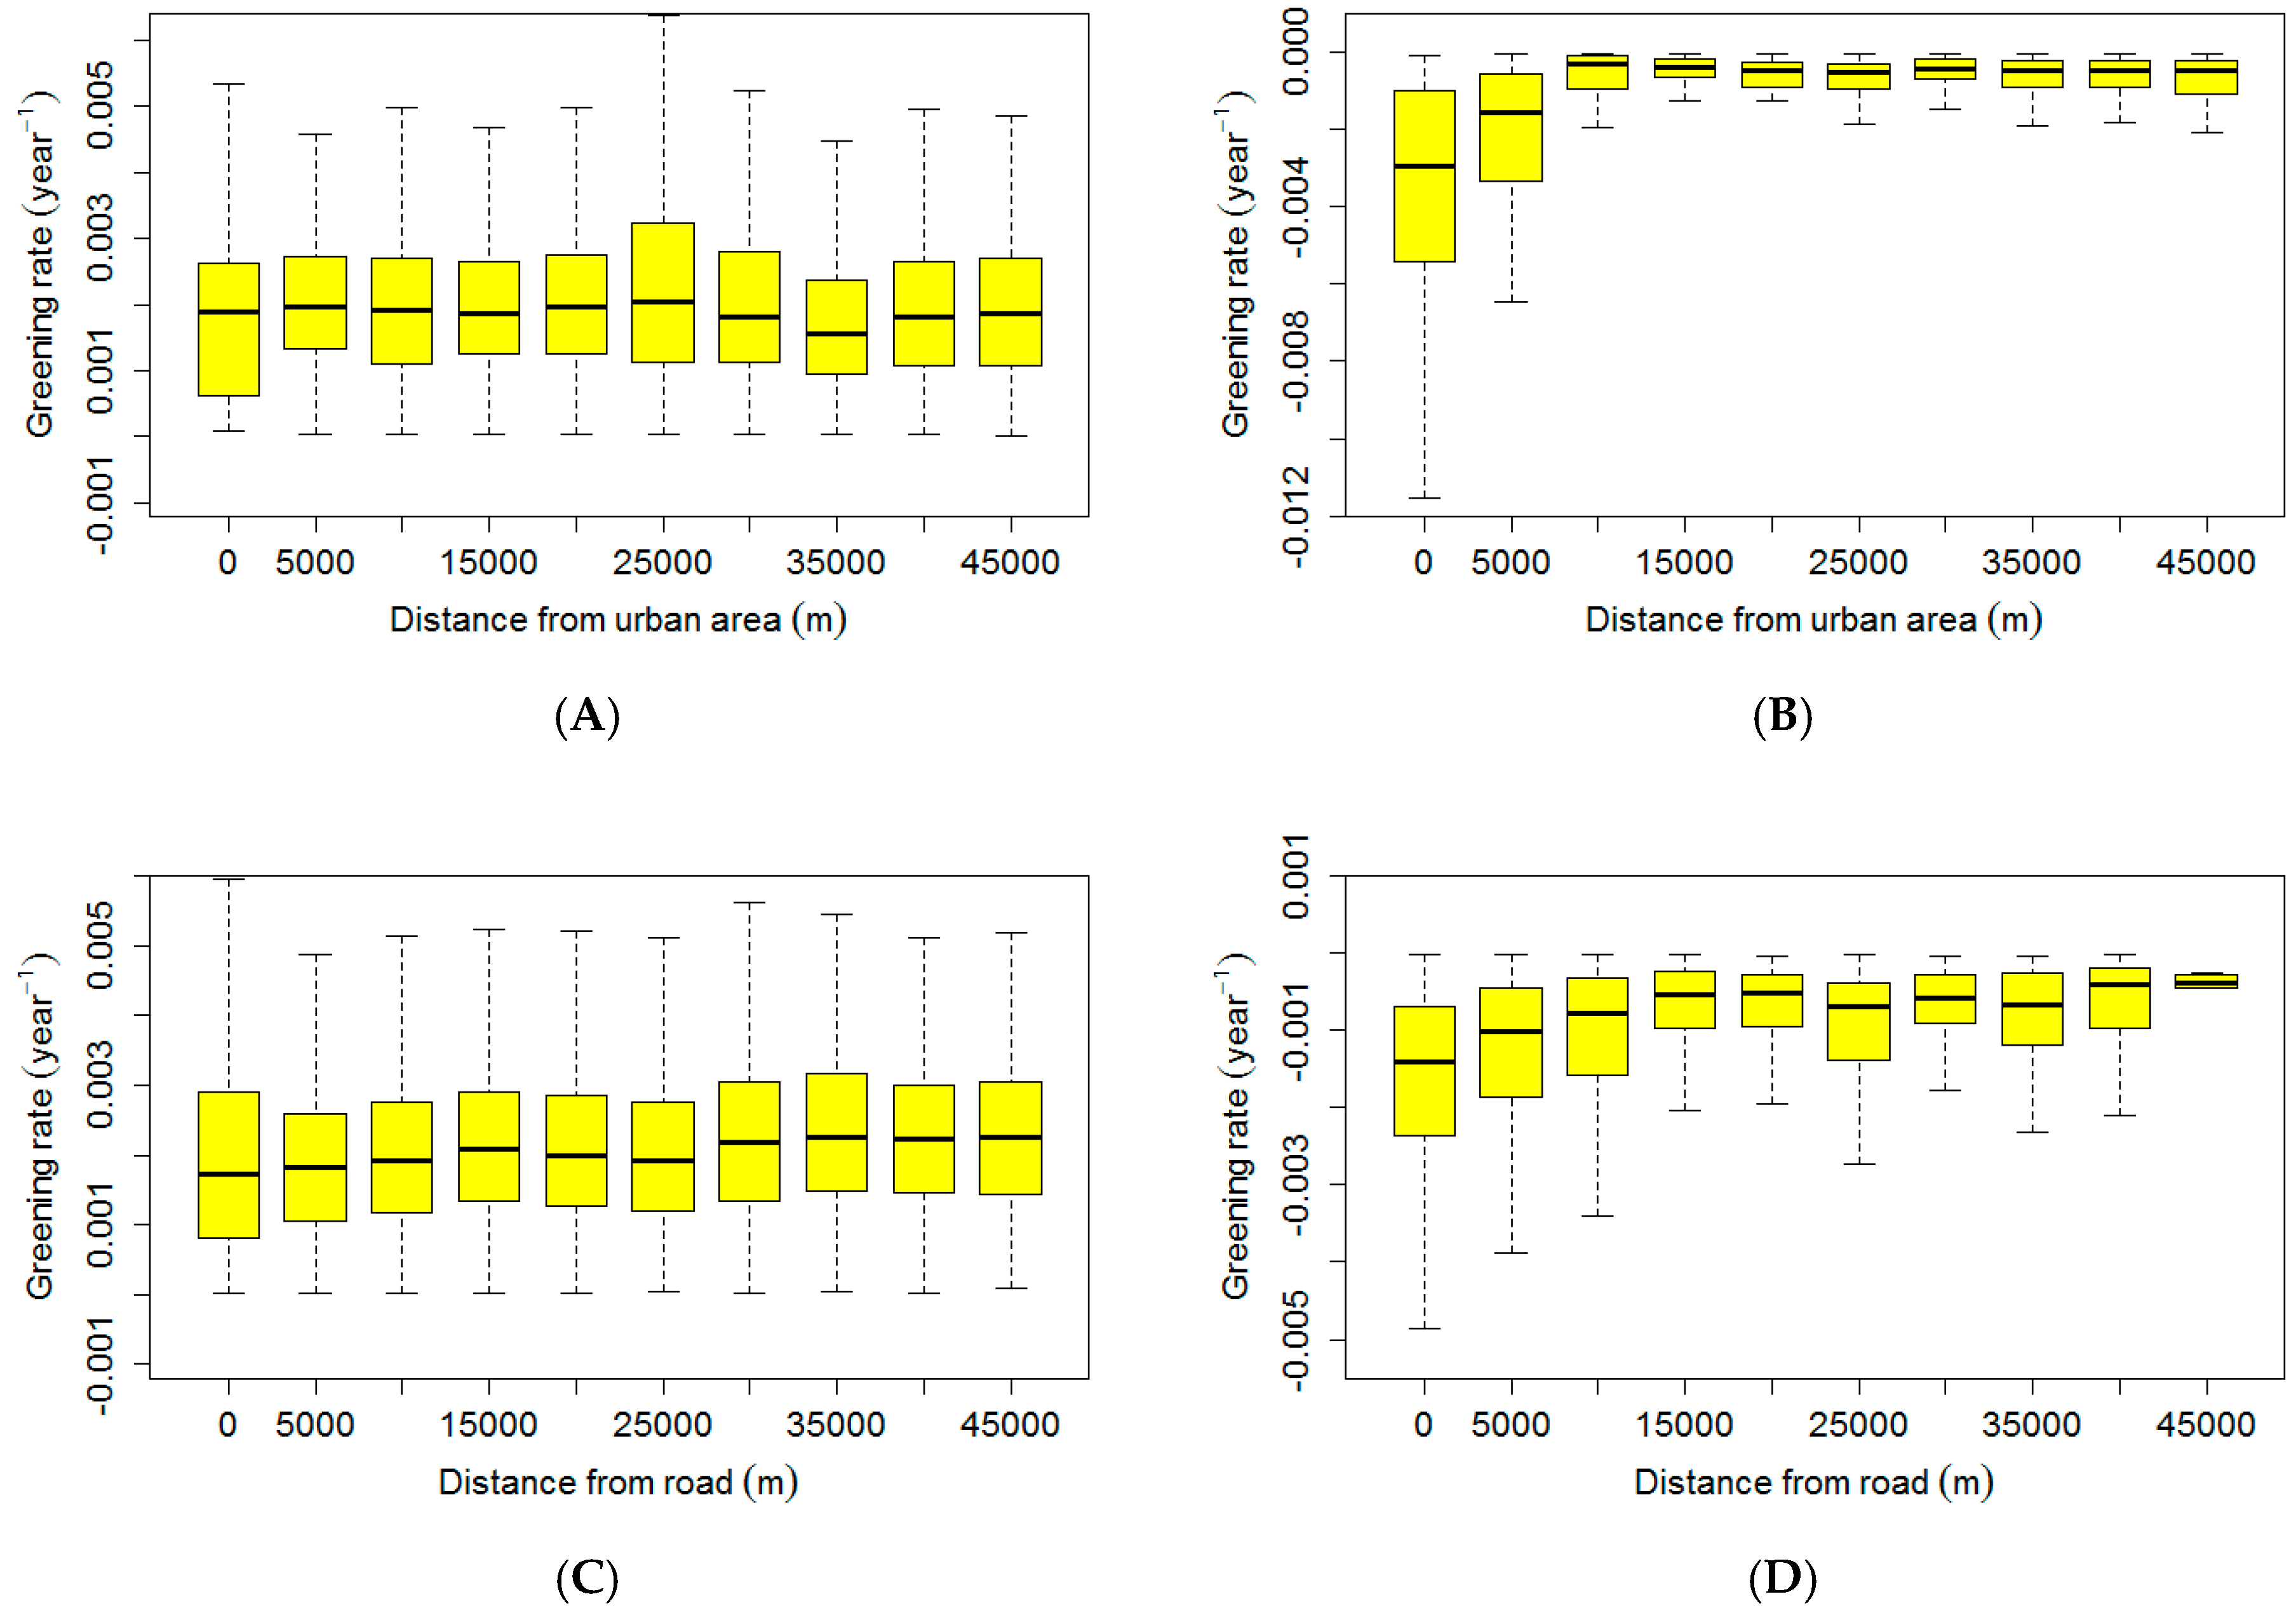
3.2.2. Effects of Urbanization and Road Construction
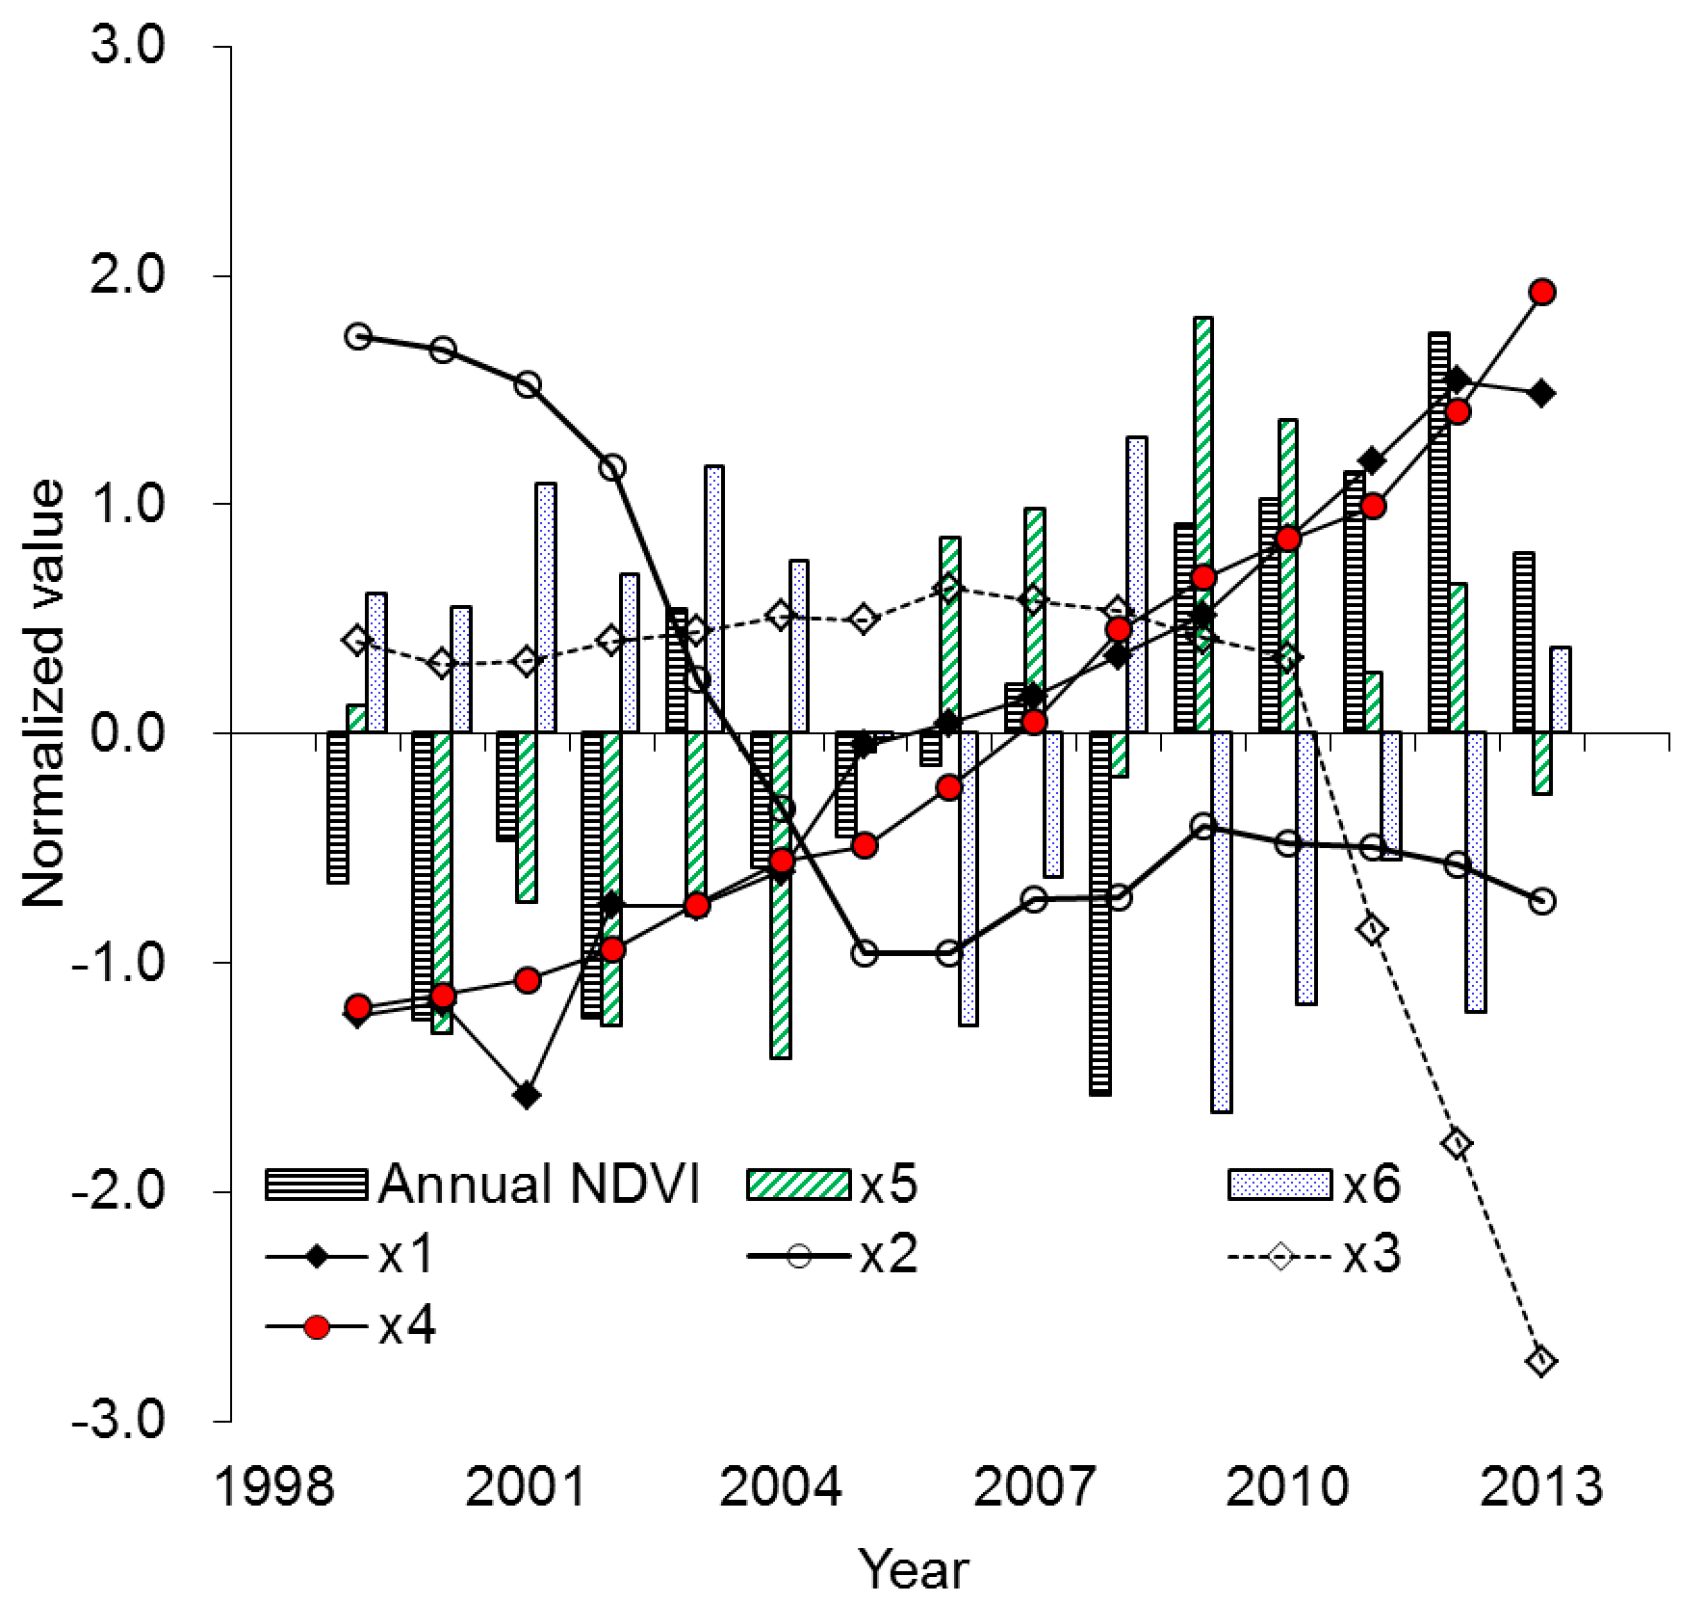
3.3. Contributions of Anthropogenic Factors to NDVI Trend
4. Discussion
5. Conclusions
Acknowledgments
Author Contributions
Conflicts of Interest
References
- Sims, D.A.; Rahman, A.F.; Cordova, V.D.; El-Masri, B.Z.; Baldocchi, D.D.; Bolstad, P.V.; Flanagan, L.B.; Goldstein, A.H.; Hollinger, D.Y.; Misson, L.; et al. A new model of gross primary productivity for North American ecosystems based solely on the enhanced vegetation index and land surface temperature from MODIS. Remote Sens. Environ. 2008, 112, 1633–1646. [Google Scholar] [CrossRef]
- Jong, R.; de Bruin, S.; de Wit, A.; Schaepman, M.E.; Dent, D.L. Analysis of monotonic greening and browning trends from global NDVI time-series. Remote Sens. Environ. 2011, 115, 692–702. [Google Scholar] [CrossRef] [Green Version]
- Verbyla, D. The greening and browning of Alaska based on 1982–2003 satellite data. Glob. Ecol. Biogeogr. 2008, 17, 547–555. [Google Scholar] [CrossRef]
- Jong, R.; Verbesselt, J.; Schaepman, M.E.; Bruin, S. Trend changes in global greening and browning: Contribution of short-term trends to longer-term change. Glob. Chang. Biol. 2012, 18, 642–655. [Google Scholar] [CrossRef]
- Metternicht, G.; Zinck, J.A.; Blanco, P.D.; Del Valle, H.F. Remote sensing of land degradation: Experiences from Latin America and the Caribbean. J. Environ. Qual. 2010, 39, 42–61. [Google Scholar] [CrossRef] [PubMed]
- Zhang, G.; Dong, J.; Xiao, X.; Hu, Z.; Sheldon, S. Effectiveness of ecological restoration projects in Horqin Sandy Land, China based on SPOT-VGT NDVI data. Ecol. Eng. 2012, 38, 20–29. [Google Scholar] [CrossRef]
- Nemani, R.R.; Keeling, C.D.; Hashimoto, H.; Jolly, W.M.; Piper, S.C.; Tucker, C.J.; Myneni, R.B.; Running, S.W. Climate-driven increases in global terrestrial net primary production from 1982 to 1999. Science 2003, 300, 1560–1563. [Google Scholar] [CrossRef] [PubMed]
- Peng, S.; Piao, S.; Ciais, P.; Myneni, R.B.; Chen, A.; Chevallier, F.; Dolman, A.J.; Janssens, I.A.; Peñuelas, J.; Zhang, G.; et al. Asymmetric effects of daytime and night-time warming on Northern Hemisphere vegetation. Nature 2013, 501, 88–92. [Google Scholar] [CrossRef] [PubMed]
- Wu, D.; Zhao, X.; Liang, S.; Zhou, T. Time-lag effects of global vegetation responses to climate change. Glob. Chang. Biol. 2015, 21, 3520–3531. [Google Scholar] [CrossRef] [PubMed]
- Qiu, J. China: The third pole. Nat. News 2008, 454, 393–396. [Google Scholar] [CrossRef] [PubMed]
- Li, H.; Li, Y.; Shen, W.; Li, Y.; Lin, J.; Lu, X.; Xu, X.; Jiang, J. Elevation-dependent vegetation greening of the Yarlung Zangbo River basin in the southern Tibetan Plateau, 1999–2013. Remote Sens. 2015, 7, 16672–16687. [Google Scholar] [CrossRef]
- Li, Y.; Liao, J.; Guo, H.; Liu, Z.; Shen, G. Patterns and Potential Drivers of Dramatic Changes in Tibetan Lakes, 1972–2010. PLoS ONE 2014, 9, 1–12. [Google Scholar] [CrossRef] [PubMed]
- Che, M.; Chen, B.; Innes, J.L.; Wang, G.; Dou, X.; Zhou, T.; Zhang, H.; Yana, J.; Xua, G.; Zhao, H. Spatial and temporal variations in the end date of vegetation growing season throughout the Qinghai-Tibetan Plateau from 1982 to 2011. Agric. For. Meteorol. 2014, 189–190, 81–90. [Google Scholar] [CrossRef]
- Chen, H.; Zhu, Q.; Peng, C.; Wu, N.; Wang, Y.; Fang, X.; Gao, Y.; Zhu, D.; Yang, G.; Tian, J.; et al. The impacts of climate change and human activities on biogeochemical cycles on the Qinghai-Tibetan Plateau. Glob. Chang. Biol. 2013, 19, 2940–2955. [Google Scholar] [CrossRef] [PubMed]
- Shen, M.; Piao, S.; Cong, N.; Zhang, G.; Jassens, I.A. Precipitation impacts on vegetation spring phenology on the Tibetan Plateau. Glob. Chang. Biol. 2015, 21, 3647–3656. [Google Scholar] [CrossRef] [PubMed]
- Rosenzweig, C.; Casassa, G.; Karoly, D.J.; Imeson, A.; Liu, C.; Menzel, A.; Rawlins, S.; Root, T.L.; Seguin, B.; Tryjanowski, P. Assessment of observed changes and responses in natural andmanaged systems. In Climate Change 2007: Impacts, Adaptation and Vulnerability. Contribution of Working Group II to the Fourth Assessment Report of the Intergovernmental Panel on Climate Change; Parry, M.L., Canziani, O.F., Palutikof, J.P., van der Linden, P.J., Hanso, C.E., Eds.; Cambridge University Press: Cambridge, UK, 2007; pp. 79–131. [Google Scholar]
- Sparks, T.H.; Aasa, A.; Huber, K.; Wadsworth, R. Changes and patterns in biologically relevant temperatures in Europe 1941–2000. Clim. Res. 2009, 39, 191–207. [Google Scholar] [CrossRef]
- Lü, Y.; Zhang, L.; Feng, X.; Zeng, Y.; Fu, B.; Yao, X.; Li, J.; Wu, B. Recent ecological transitions in China: Greening, browning, and influential factors. Sci. Rep. 2015. [Google Scholar] [CrossRef] [PubMed]
- Shen, W.S.; Zhang, H.; Zou, C.X.; Cao, X.Z.; Tang, X.Y. Approaches to prediction of impact of Qinghai-Tibet Railway construction on alpine ecosystems alongside and its recovery. Chin. Sci. Bull. 2004, 49, 834–841. [Google Scholar] [CrossRef]
- Shao, Q.; Fan, W.; Liu, J.; Huang, L.; Cao, W.; Xu, X.; Ge, J.; Wu, D.; Zhiqiang, L.; Gong, G.; et al. Assessment on the effects of the first-stage ecological conservation and restoration project in Sanjiangyuan region. Acta Geogr. Sin. 2016, 71, 3–20. (In Chinese) [Google Scholar]
- Qiu, J. Double threat for Tibet. Nature 2014, 512, 240–241. [Google Scholar] [CrossRef] [PubMed]
- Guo, S.; Kang, S.; Huang, J. Seasonal variations of trace elements in precipitation at the largest city in Tibet, Lhasa. Atmos. Res. 2015, 153, 87–97. [Google Scholar] [CrossRef]
- Li, H.; Shen, W.; Zou, C.; Jiang, J.; Fu, L.; She, G. Spatio-temporal variability of soil moisture and its effect on vegetation in a desertified aeolian riparian ecotone on the Tibetan Plateau, China. J. Hydrol. 2013, 479, 215–225. [Google Scholar] [CrossRef]
- Nash, M.S.; Bradford, D.F.; Wickham, J.D.; Wade, T.G. Detecting change in landscape greenness over large areas: An example for New Mexico, USA. Remote Sens. Environ. 2014, 150, 152–162. [Google Scholar] [CrossRef]
- Zhang, Y.; Gao, J.; Liu, L.; Wang, Z.; Ding, M.; Yang, X. NDVI-based vegetation changes and their responses to climate change from 1982 to 2011: A case study in the Koshi River Basin in the middle Himalayas. Glob. Planet. Chang. 2013, 108, 139–148. [Google Scholar] [CrossRef]
- Maisongrande, P.; Duchemin, B.; Dedieu, G. VEGETATOPM/SPOT—An operational mission for the earth monitoring: Presentation of new standard products. Int. J. Remote Sens. 2004, 25, 9–14. [Google Scholar] [CrossRef]
- Cong, N.; Piao, S.; Chen, A.; Wang, X.; Chen, S.; Han, S.; Zhou, G.; Zhang, X. Spring vegetation green-up date in China inferred from SPOT NDVI data: A multiple model analysis. Agric. For. Meteorol. 2012, 165, 104–113. [Google Scholar] [CrossRef]
- Guo, W.; Liu, S.; Yao, X.; Xu, J.; Shangguan, D.; Wu, L.; Zhao, J.; Liu, Q.; Jiang, Z.; Wei, J.; et al. The Second Glacier Inventory Dataset of China (Version 1.0); Cold and Arid Regions Science Data Center at Lanzhou: Lanzhou, China, 2014. [Google Scholar]
- Evans, J.; Geerken, R. Discrimination between climate and human-induced dryland degradation. J. Arid Environ. 2004, 57, 535–554. [Google Scholar] [CrossRef]
- Wessels, K.J.; Prince, S.D.; Malherbe, J.; Small, J.; Frost, P.E.; VanZyl, D. Can human-induced land degradation be distinguished from the effects of rainfall variability? A case study in South Africa. J. Arid Environ. 2007, 68, 271–297. [Google Scholar] [CrossRef]
- Tibet Autonomous Bureau of Statistics; Tibet General Team of Investigation under the NBS. Tibet Statistical Yearbook-2014; Chinese Statistics Press: Beijing, China, 2014. (In Chinese)
- Runnström, M. Is Northern China Winning the Battle against Desertification? J. Hum. Environ. 2009, 29, 468–476. [Google Scholar] [CrossRef]
- Jeong, S.J.; Ho, C.H.; Gim, H.J.; Brown, M.E. Phenology shifts at start vs. end of growing season in temperate vegetation over the Northern Hemisphere for the period 1982–2008. Glob. Chang. Biol. 2011, 17, 2385–2399. [Google Scholar] [CrossRef]
- Shen, M.; Zhang, G.; Cong, N.; Wang, S.; Kong, W.; Piao, S. Increasing altitudinal gradient of spring vegetation phenology during the last decade on the Qinghai-Tibetan Plateau. Agric. For. Meteorol. 2014, 189–190, 71–80. [Google Scholar] [CrossRef]
- Wang, X.; Piao, S.; Ciais, P.; Li, J.; Friedlingstein, P.; Koven, C.; Chen, A. Spring temperature change and its implication in the change of vegetation growth in North America from 1982 to 2006. Proc. Natl. Acad. Sci. USA 2011, 108, 1240–1245. [Google Scholar] [CrossRef] [PubMed]
- Wang, J.; Rich, P.M.; Price, K.P. Temporal responses of NDVI to precipitation and temperature in the central Great Plains, USA. Int. J. Remote Sens. 2003, 11, 2345–2364. [Google Scholar] [CrossRef]
- Piao, S.; Ciais, P.; Friedlingstein, P.; Peylin, P.; Reichstein, M.; Luyssaert, S.; Margolis, H.; Fang, J.; Barr, A.; Chen, A.; et al. Net carbon dioxide losses of northern ecosystems in response to autumn warming. Nature 2008, 451, 49–53. [Google Scholar] [CrossRef] [PubMed]
- Richardson, A.D.; Black, T.A.; Ciais, P.; Delbart, N.; Friedl, M.A.; Gobron, N.; Hollinger, D.Y.; Kutsch, W.L.; Longdoz, B.; Luyssaert, S.; et al. Influence of spring and autumn phenological transitions on forest ecosystem productivity. Philos. Trans. R. Soc. B Biol. Sci. 2010, 365, 3227–3246. [Google Scholar] [CrossRef] [PubMed] [Green Version]
- Piao, S.; Tan, T.; Nan, H.; Ciais, P.; Fang, J.; Wang, T.; Vuichard, N.; Zhu, B. Impacts of climate and CO2 changes on the vegetation growth and carbon balance of Qinghai-Tibetan grasslands over the past five decades. Glob. Planet. Chang. 2012, 98–99, 73–80. [Google Scholar] [CrossRef]


| Regions | NDVI | Seasonal Mean Temperatures | Seasonal Precipitations | ||||||
|---|---|---|---|---|---|---|---|---|---|
| Spring | Summer | Autumn | Winter | Spring | Summer | Autumn | Winter | ||
| Lhasa Area | Spring | 0.765 ** | 0.440 | 0.485 | 0.221 | −0.431 | −0.252 | −0.249 | −0.321 |
| Summer | −0.253 | 0.158 | 0.120 | 0.227 | 0.246 | −0.133 | −0.144 | −0.148 | |
| Autumn | 0.293 | 0.449 | 0.665 ** | 0.045 | −0.756 ** | −0.045 | −0.354 | −0.182 | |
| Winter | 0.274 | 0.476 | 0.413 | 0.314 | −0.529 * | −0.372 | −0.265 | −0.727 ** | |
| Lhari County | Spring | 0.767 ** | 0.140 | 0.341 | 0.230 | −0.595 * | −0.257 | −0.577 * | −0.159 |
| Summer | 0.545 * | 0.537 * | 0.180 | 0.319 | −0.821 ** | −0.518 * | −0.633 * | 0.063 | |
| Autumn | 0.037 | 0.299 | 0.716 ** | 0.042 | −0.045 | −0.086 | −0.309 | 0.454 | |
| Winter | −0.090 | 0.549 * | 0.318 | 0.469 | −0.061 | −0.532 * | −0.392 | −0.217 | |
| Regions | Number of Rural Laborers (x1) | Artificial Forest Areas (x2) | Cultivated Areas (x3) | Livestock Number (x4) | Annual Mean Temperature (x5) | Annual Precipitation (x6) | |
|---|---|---|---|---|---|---|---|
| Name | Elevation/m | ||||||
| Lhasa area | 4818 | 0.711 **/0.817 | 0.711 **/0.829 | −0.466/0.592 | −0.566 */0.618 | 0.615 */0.732 | −0.672 **/0.565 |
| Lhari County | 5047 | 0.388/0.705 | −0.053/0.662 | −0.186/0.614 | 0.709 */0.780 | −0.650 **/0.547 | |
© 2016 by the authors; licensee MDPI, Basel, Switzerland. This article is an open access article distributed under the terms and conditions of the Creative Commons Attribution (CC-BY) license (http://creativecommons.org/licenses/by/4.0/).
Share and Cite
Li, H.; Li, Y.; Gao, Y.; Zou, C.; Yan, S.; Gao, J. Human Impact on Vegetation Dynamics around Lhasa, Southern Tibetan Plateau, China. Sustainability 2016, 8, 1146. https://0-doi-org.brum.beds.ac.uk/10.3390/su8111146
Li H, Li Y, Gao Y, Zou C, Yan S, Gao J. Human Impact on Vegetation Dynamics around Lhasa, Southern Tibetan Plateau, China. Sustainability. 2016; 8(11):1146. https://0-doi-org.brum.beds.ac.uk/10.3390/su8111146
Chicago/Turabian StyleLi, Haidong, Yingkui Li, Yuanyun Gao, Changxin Zou, Shouguang Yan, and Jixi Gao. 2016. "Human Impact on Vegetation Dynamics around Lhasa, Southern Tibetan Plateau, China" Sustainability 8, no. 11: 1146. https://0-doi-org.brum.beds.ac.uk/10.3390/su8111146