2.1. Corrosion Initiation Due to Carbonation
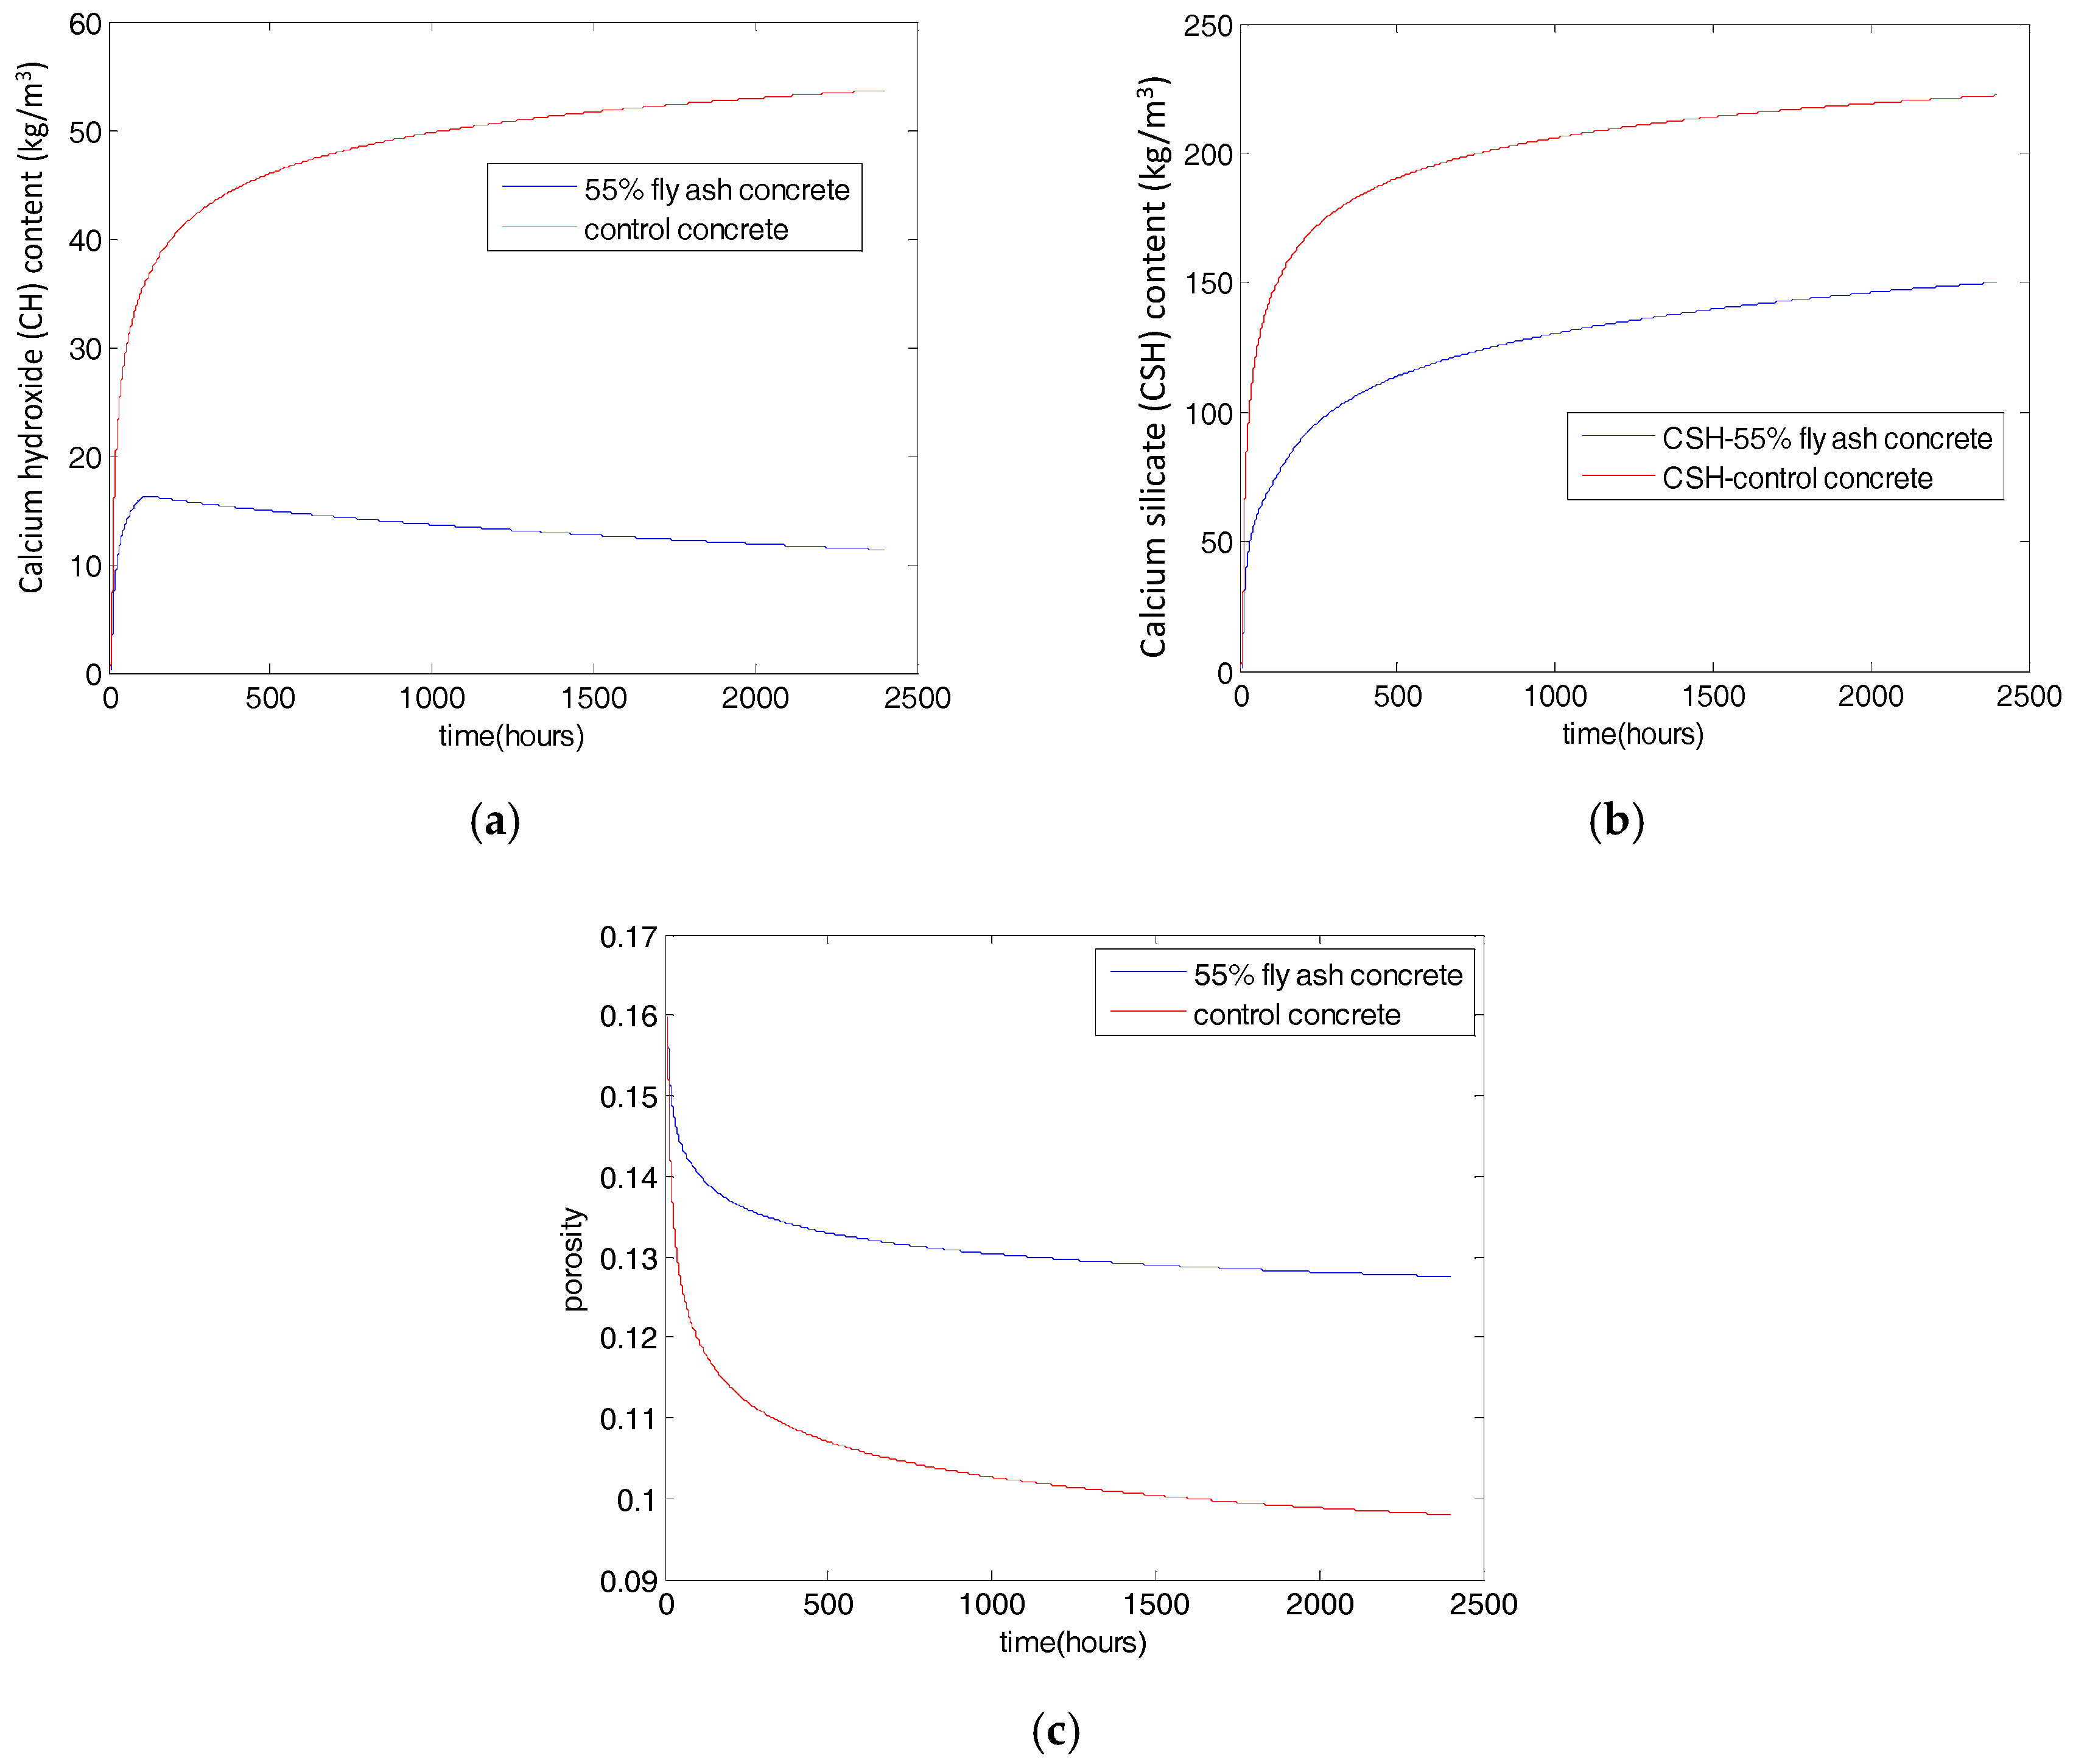
Carbonation can be affected by both concrete properties and environmental conditions during the service life. The amount of carbonatable materials such as calcium hydroxide (CH) and calcium silica hydrate (CSH) in concrete depends on the binder content in concrete mixing proportions and reaction degree of the binders. In our previous study [
16], a blended-cement hydration model was proposed to simulate the kinetic hydration process of cement-fly ash blends. The volumetric phase fractions of hardening blended concrete are evaluated using reaction degrees of the binders. For cement-fly ash blends, the CH content can be determined as follows [
16]:
where
is the mass of cement,
is the mass of CH produced by the hydration of unit mass of the cement, α denotes the degree of hydration of cement (
considers the production of CH from cement hydration),
is the mass of fly ash,
is the stoichiometric ratio of the masses of CH and fly ash (
[
16]), and
denotes the degree of reaction of fly ash (
accounts for the consumption of calcium hydroxide from the fly ash reaction).
Both cement hydration and fly ash reaction will produce calcium silicate hydrate (CSH). The compound formula of CSH produced from cement hydration is C
1.7SH
4 [
16]. CSH produced from fly ash reaction has a lower Ca/Si ratio than that produced from cement hydration, and the compound formula of CSH produced from fly ash is C
1.1SH
3.9 [
16] (Ca/Si ratio also depends on the type of fly ash; this point is not considered in this study). The S in cement and fly ash will form CSH [
17]. By using the binder contents, reaction degree of binders, and compound formula of CSH, CSH contents can be calculated as follows:
where CSH
C and CSH
FA denote the CSH produced from cement hydration and fly ash reaction, respectively,
and
are the weight fractions of S in cement and fly ash respectively. The coefficient 3.78 in Equation (3) is the mass ratio between the molar weight of C
1.7SH
4 and the weight of oxide SiO
2 in C
1.7SH
4. The coefficient 3.19 in Equation (4) is the mass ratio between the molar weight of C
1.1SH
3.9 and the weight of oxide SiO
2 in C
1.1SH
3.9.
The porosity of the hydrating concrete is reduced owing to the hydration of Portland cement, reaction of fly ash, and the carbonation of concrete. The porosity can be estimated as follows [
17,
18]:
where
is the porosity,
is the water content, and
is the density of water.
denotes the porosity reduction from the hydration of cement, while
denotes the porosity reduction from the reaction of fly ash;
denotes the porosity reduction due to concrete carbonation.
Papadakis [
17,
18] proposed that when relative humidity in the environment is higher than 0.55, carbonation of concrete is controlled by the diffusion of CO
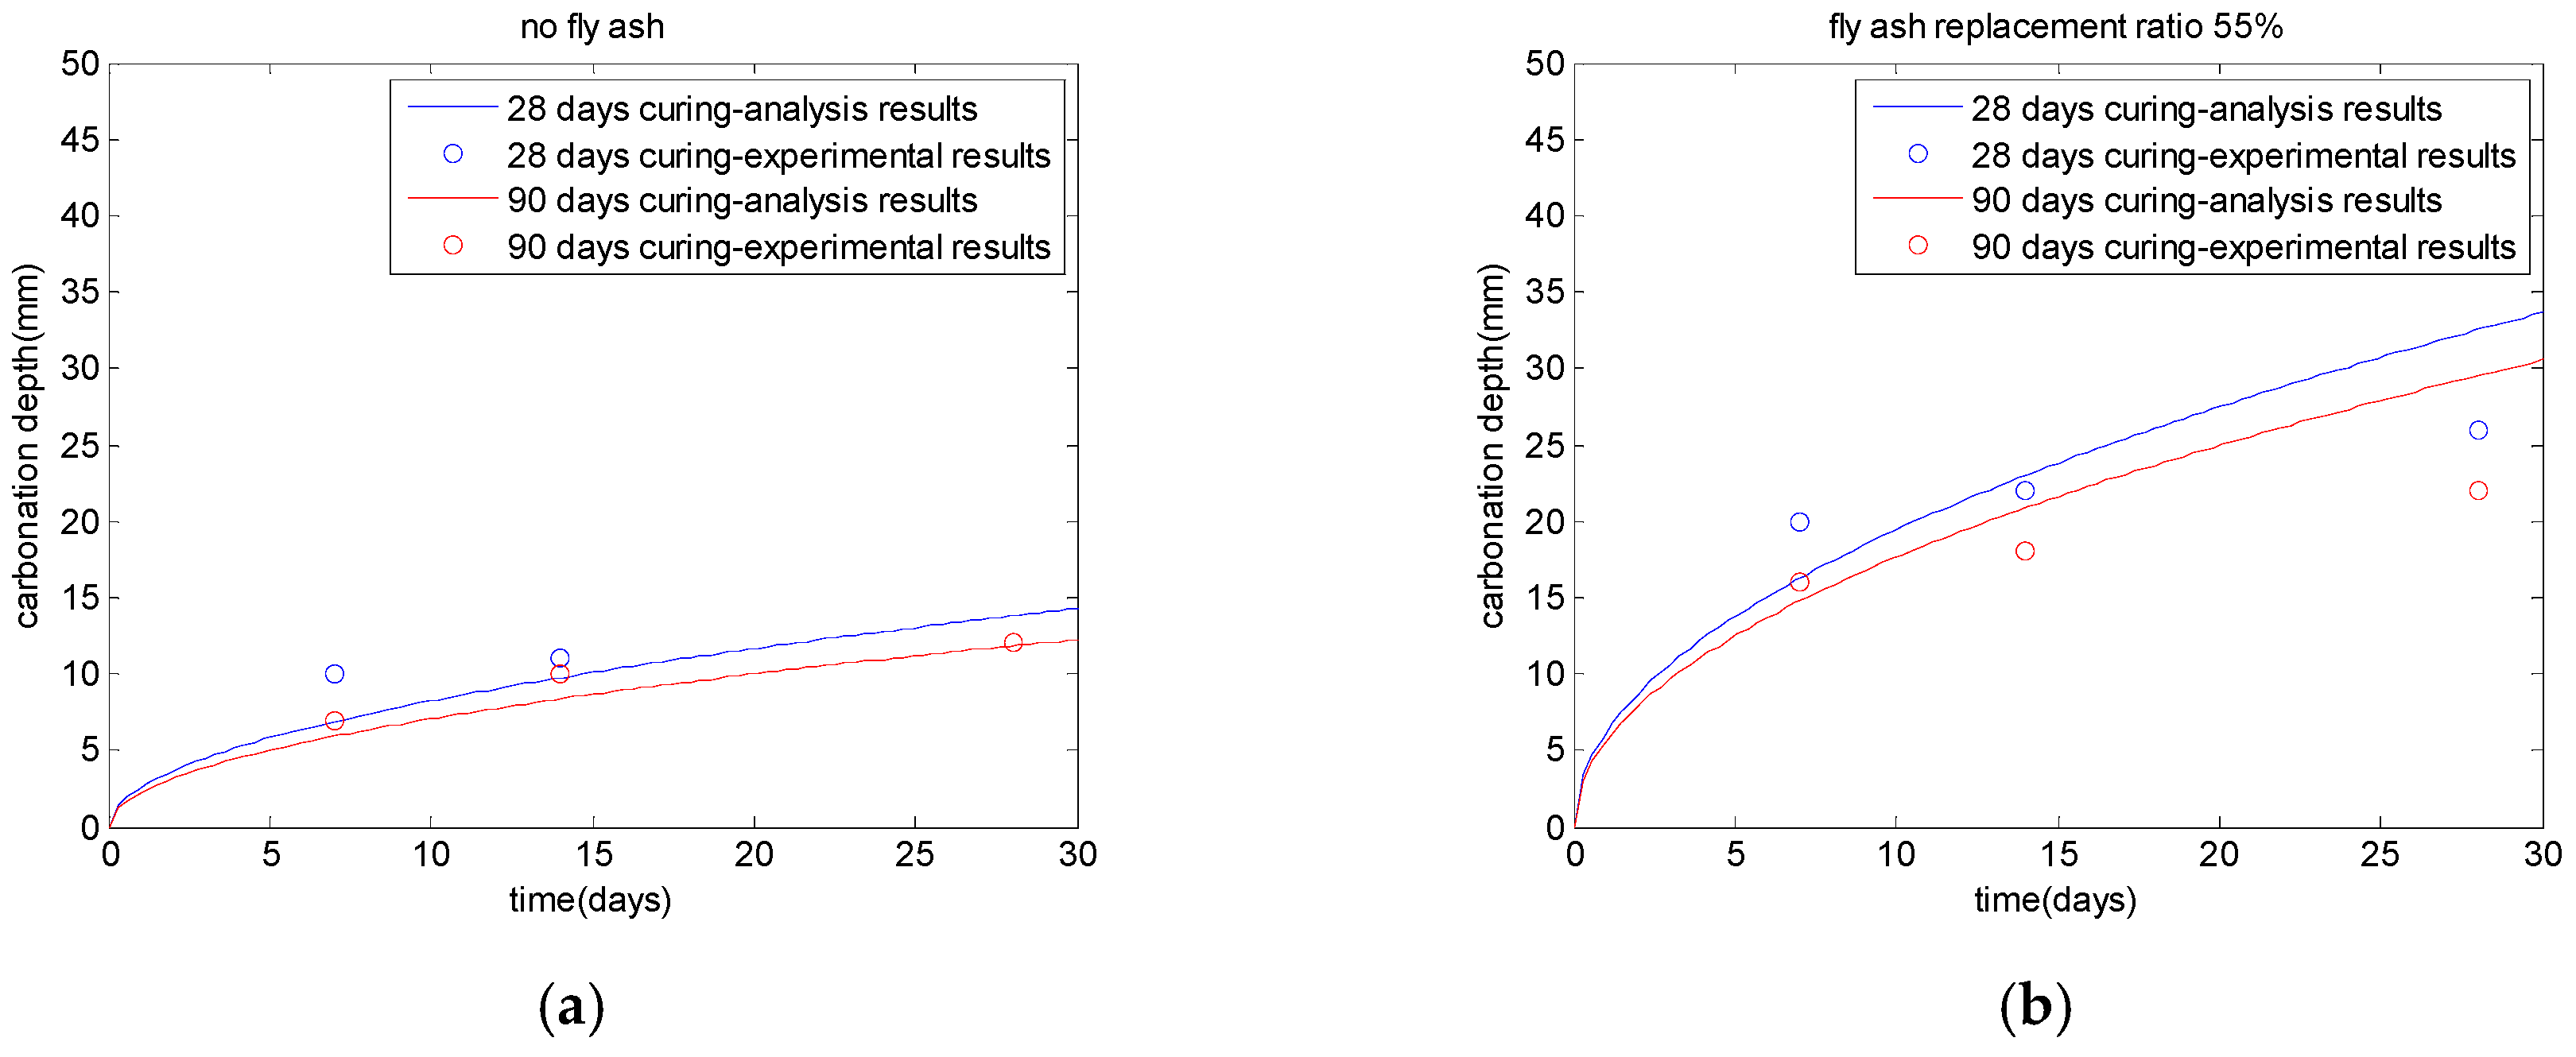
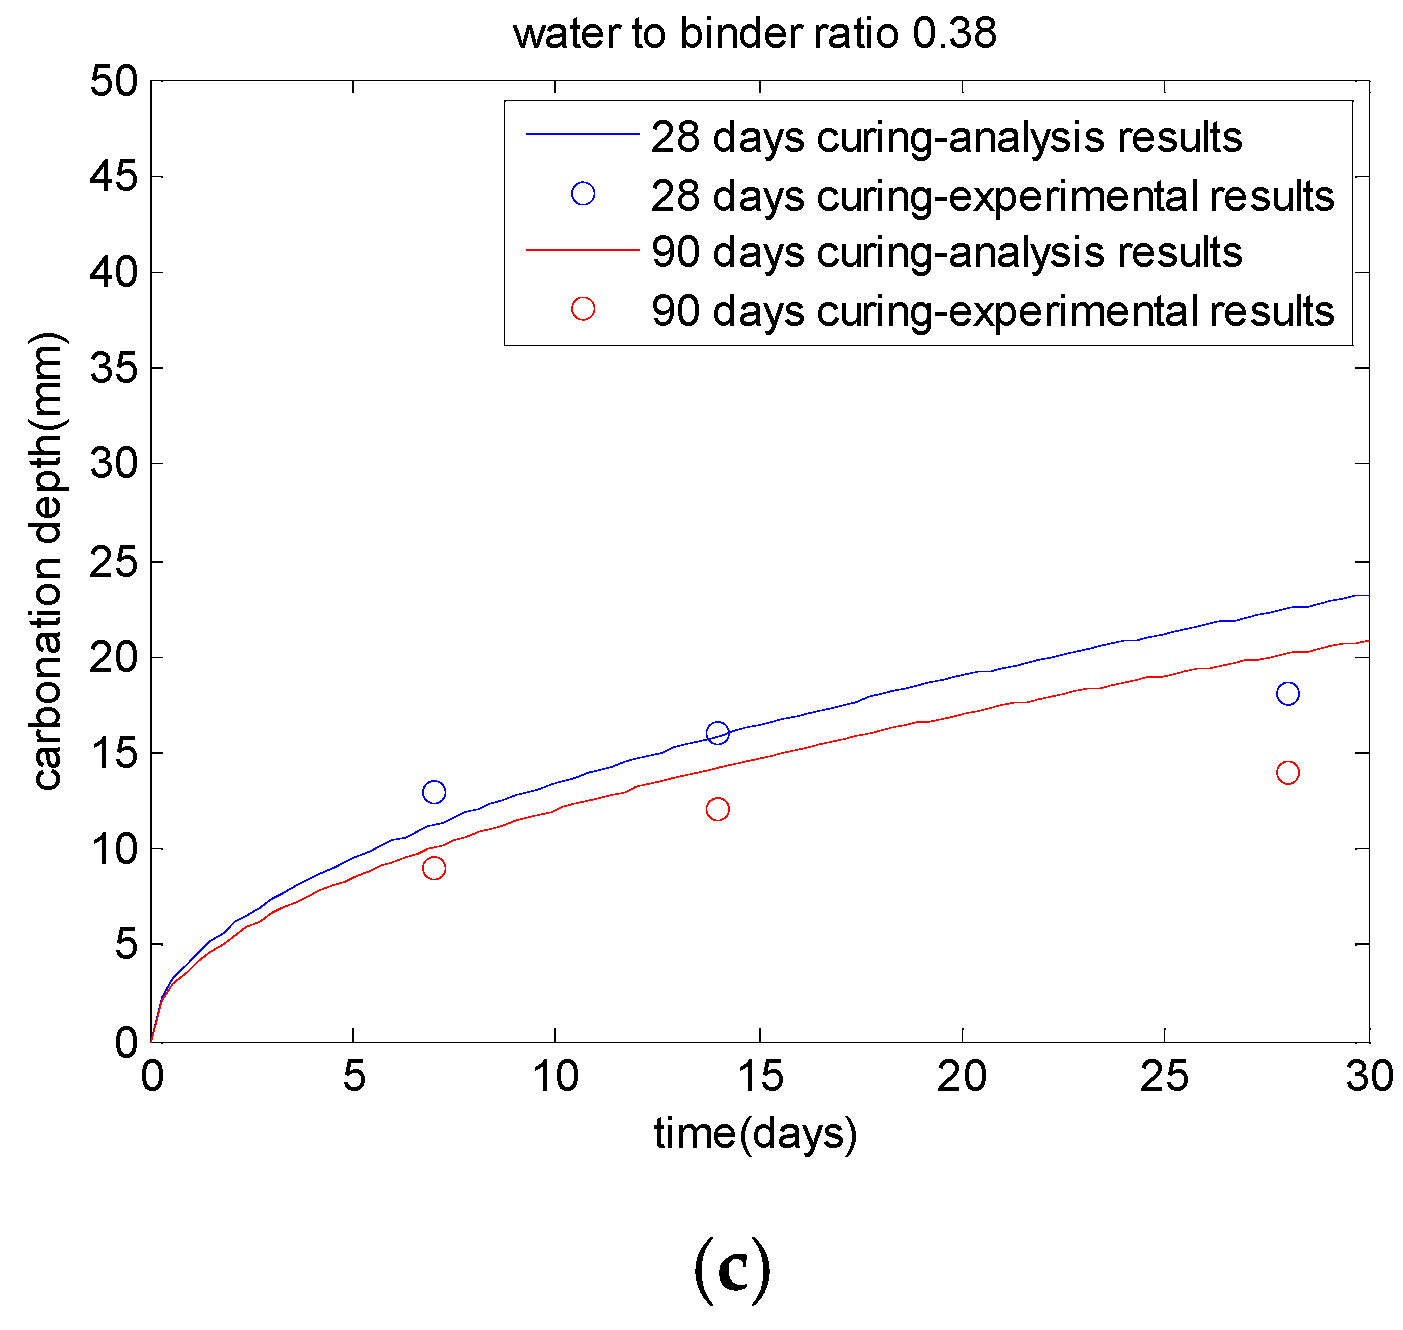
2. The carbonation depth of concrete can be determined as follows:
where
is the carbonation depth of concrete,
is the CO
2 diffusivity,
is CO
2 molar concentration at the concrete surface,
is the molar concentration of calcium hydroxide,
is the molar concentration of CSH produced from cement hydration,
is the molar concentration of CSH produced from the fly ash reaction,
is the density of cement,
A and
a are CO
2 diffusivity parameters, and RH is the environmental relative humidity.
in the denominator of Equation (6) is the content of carbonatable material.
Owing to climate change, the CO
2 concentration and environmental temperature increase, and consequently the rate of carbonation of concrete is accelerated. Equation (6) is only valid for an exposure environment with constant CO
2 concentration and CO
2 diffusivity. For time-dependent CO
2 concentration and CO
2 diffusivity, Equation (6) is not valid. In this study, to consider the time-dependent climate changes, Equation (6) is re-written by using the difference method as follows:
where
is the increase of carbonation depth in one time step and
is the carbonation rate parameter.
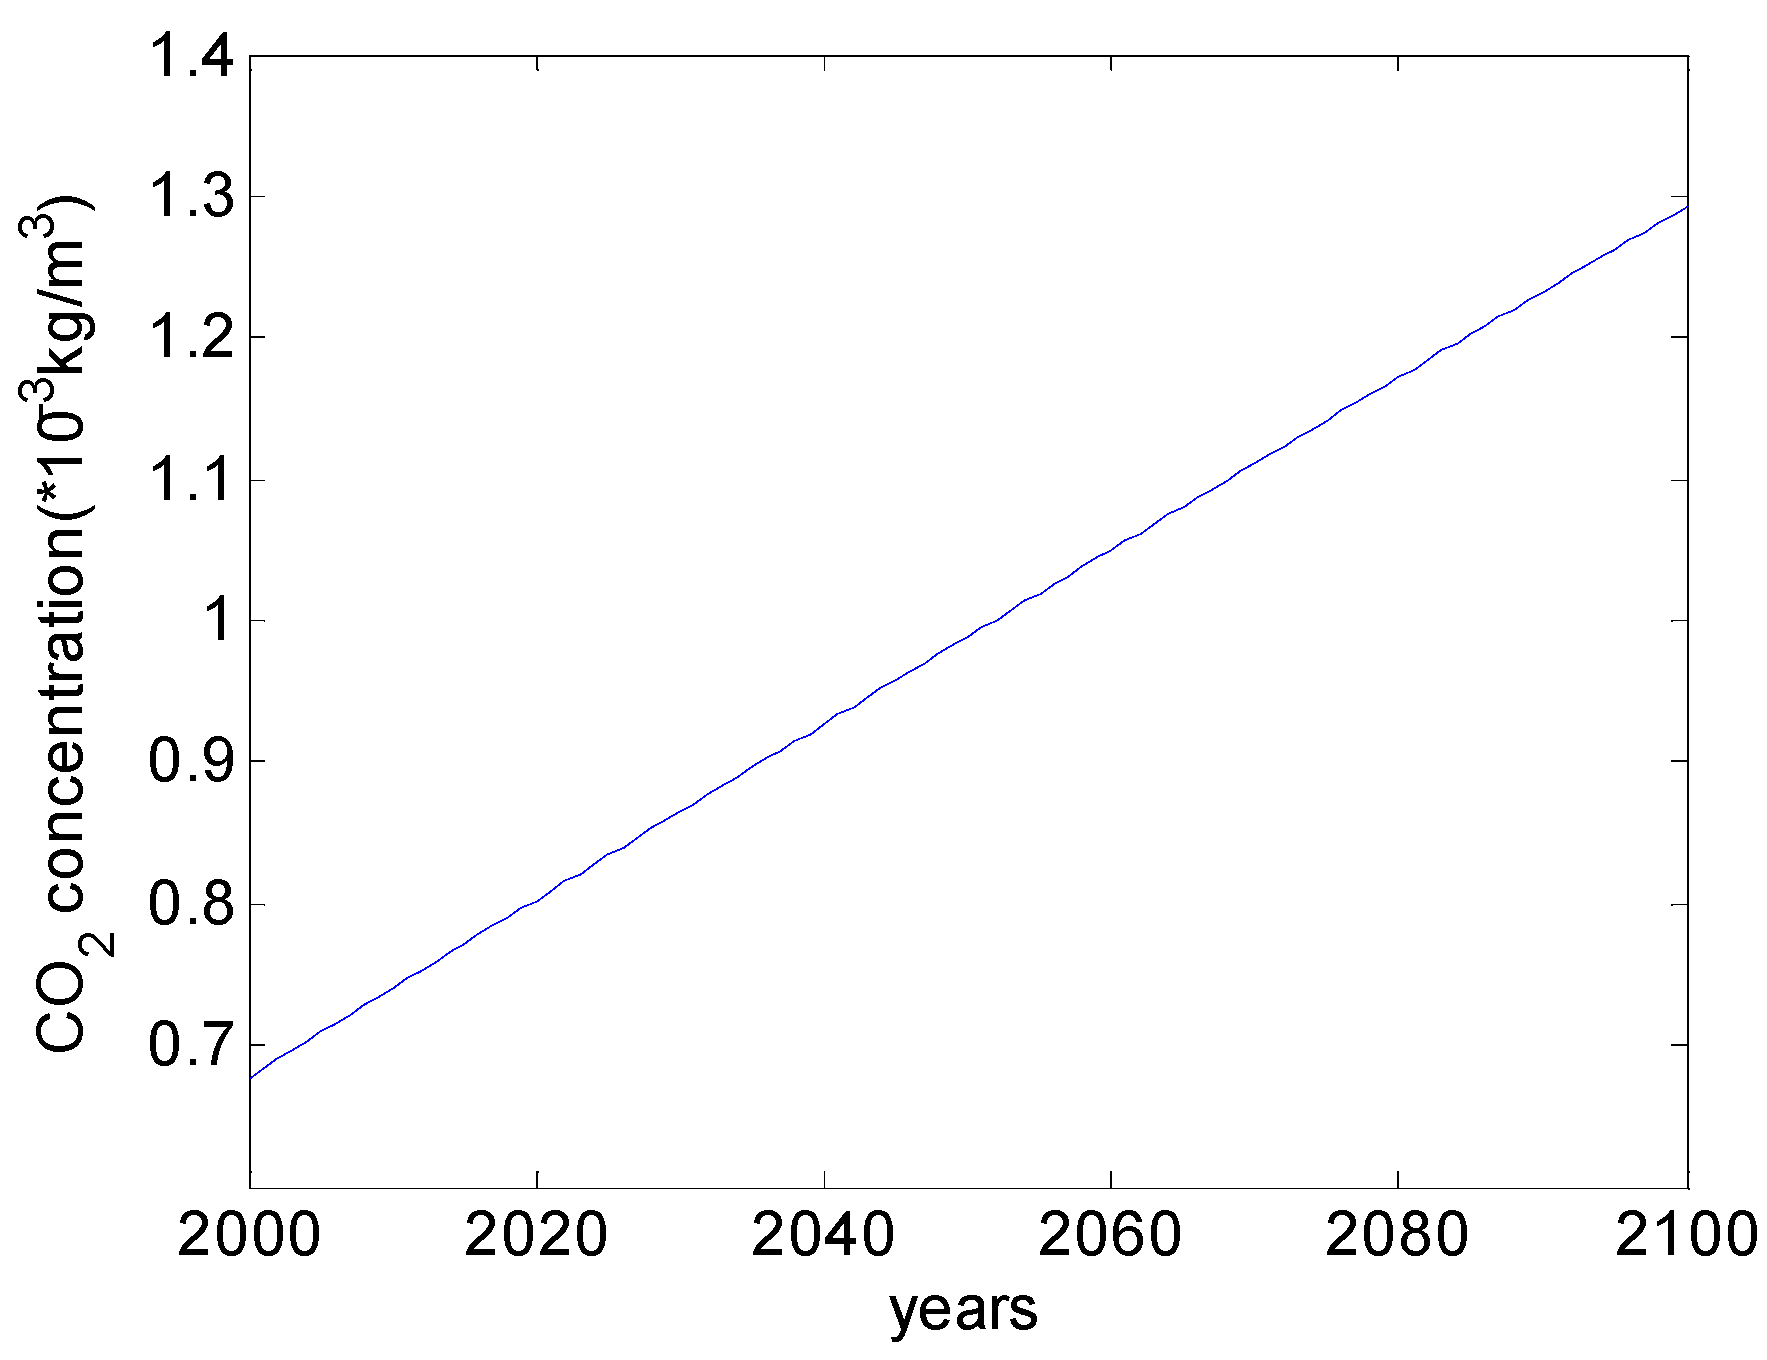
The Intergovernmental Panel on Climate Change (IPCC) developed the climate scenario IS92a to predict atmospheric CO
2 concentration changes. IS92a has been regarded as one of the best models among the various scenarios of global-mean change. Based on climate scenario IS92a, Yoon et al. [
8] proposed that the time-dependent CO
2 concentration in the next 100 years could be calculated as follows:
Figure 1 shows the time-dependent CO
2 concentration. This figure shows that in the next 100 years, CO
2 concentration in the atmosphere will almost double.
The increase in the amount of CO
2 is not the same as the increase that could happen in accelerated carbonation tests. Hence, the carbonation depth measured in accelerated carbonation tests is different from that in climate change conditions. Papadakis [
17,
18] compared the carbonation of concrete under different CO
2 concentrations, i.e., a natural environment (0.03% CO
2 by volume) and an accelerated carbonation test (7% and 50% CO
2 by volume). Papadakis [
17,
18] found that Equation (6) is valid for concrete exposed to different CO
2 concentrations, and the CO
2 diffusivity parameters
A and
a of Equation (7) do not vary with CO
2 concentrations [
17,
18]. Based on the accelerated carbonation results, the values of CO
2 diffusivity parameters
A and
a can be set. Furthermore, by using CO
2 concentration in the condition of climate change, the carbonation depth for the climate change condition can be determined (Equation (8)).
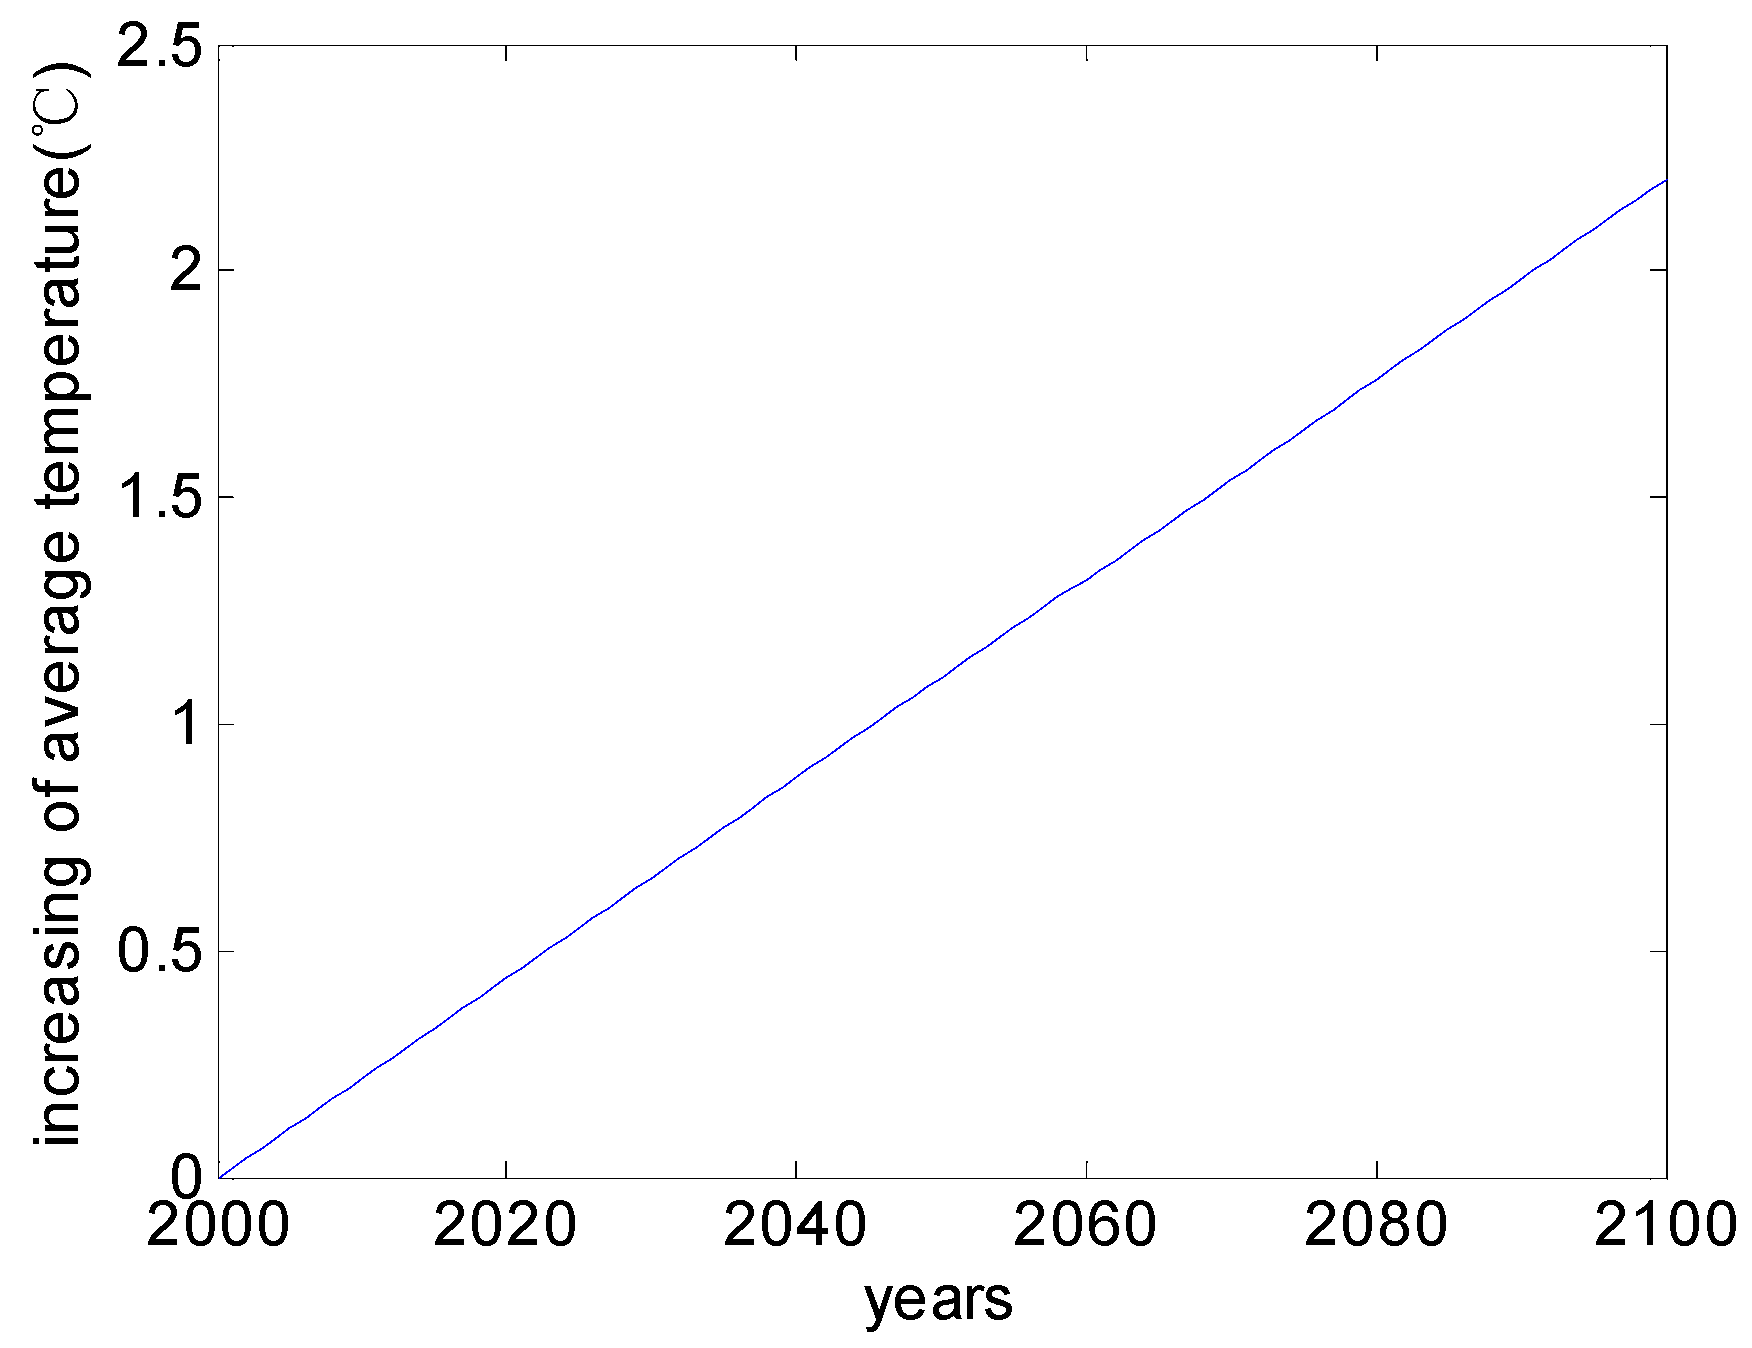
Based on meteorological data from Korea Meteorological Administration [
19], it was observed that in the last 50 years the average temperature increased by about 1.1 °C. Hence, the increased temperature can be calculated as follows:
where
is the increased temperature. As shown in
Figure 2, in the next 100 years, the environmental temperature will increase by about 2 °C.
Papadakis et al. [
17,
18] proposed that the dependence of CO
2 diffusivity on temperature could be described using Arrhenius’ Law as follows:
where
is the CO
2 diffusivity at reference temperature, and
is the activity energy of CO
2 (
= 4300),
(298 K) is the reference temperature.
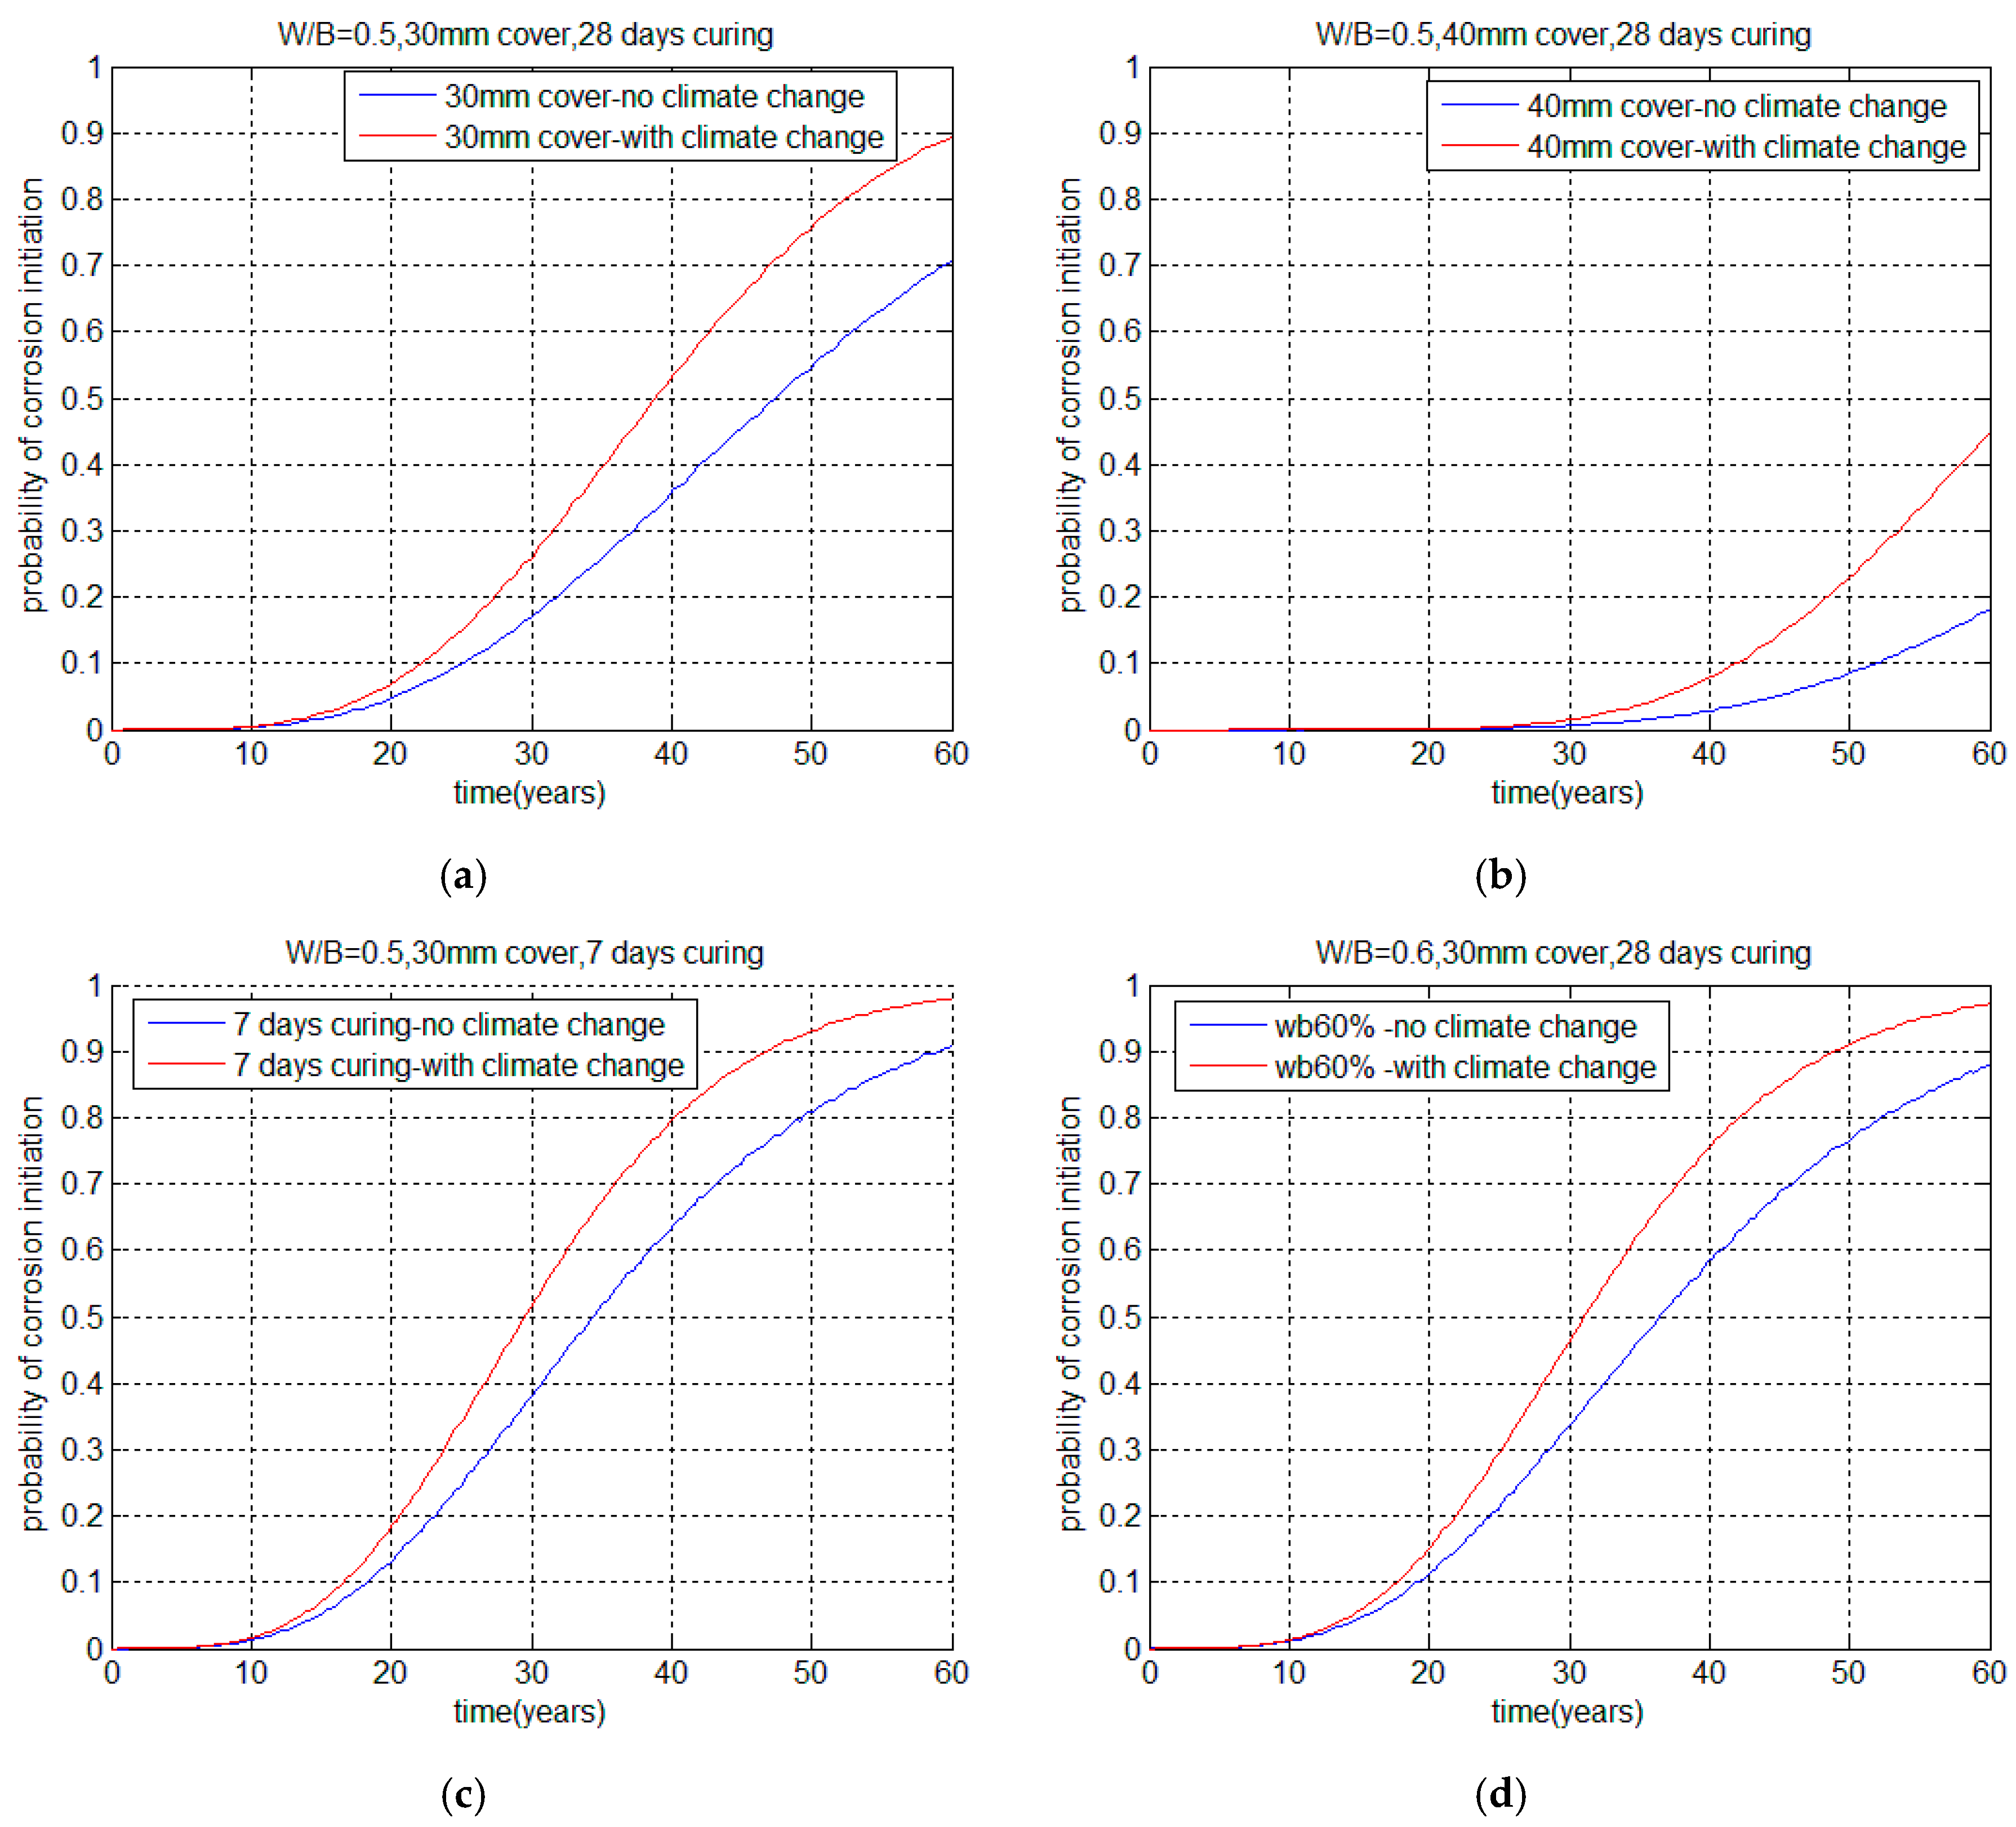
In the corrosion initiation stage, the durability failure criterion is defined as the carbonation depth exceeding the cover depth. Carbonation prediction involves uncertainties, such as physical uncertainty, statistical uncertainty, model uncertainty, and decision uncertainty [
20]. Physical uncertainty is inherent in the random nature of basic variables such as concrete cover depth, environmental CO
2 concentration, quality of concrete, and local conditions. Statistical uncertainty comes from the assumption for the probability density function. Model uncertainty is the governing mechanism for carbonation, such as a simplified equation of carbonation, assumption of material properties, and assumption of non-correlated variables. Decision uncertainty includes the definition of durability failure criteria, such as the period for which the carbonation depth exceeds cover depth. Considering the uncertainties in carbonation prediction, the durability failure probability can be determined by using the Monte Carlo simulation method as follows [
20]:
where
is the cover depth of concrete,
is the durability failure criterion, and
is the probability of carbonation durability failure.
denotes the number of instances of carbonation durability failure out of a total of
trials.
The details about calculating the probability of corrosion initiation are as follows: 50,000 random samples for the parametric value were generated by the Monte Carlo simulation. The probability for carbonation to reach the depth of the steel rebar denotes the probability of corrosion initiation. This probability is calculated from the 50,000 random trials and is defined as the ratio of the number of instances of carbonation at the depth of the steel rebar, calculated by Equation (8), to the total number of trials (50,000 trials).
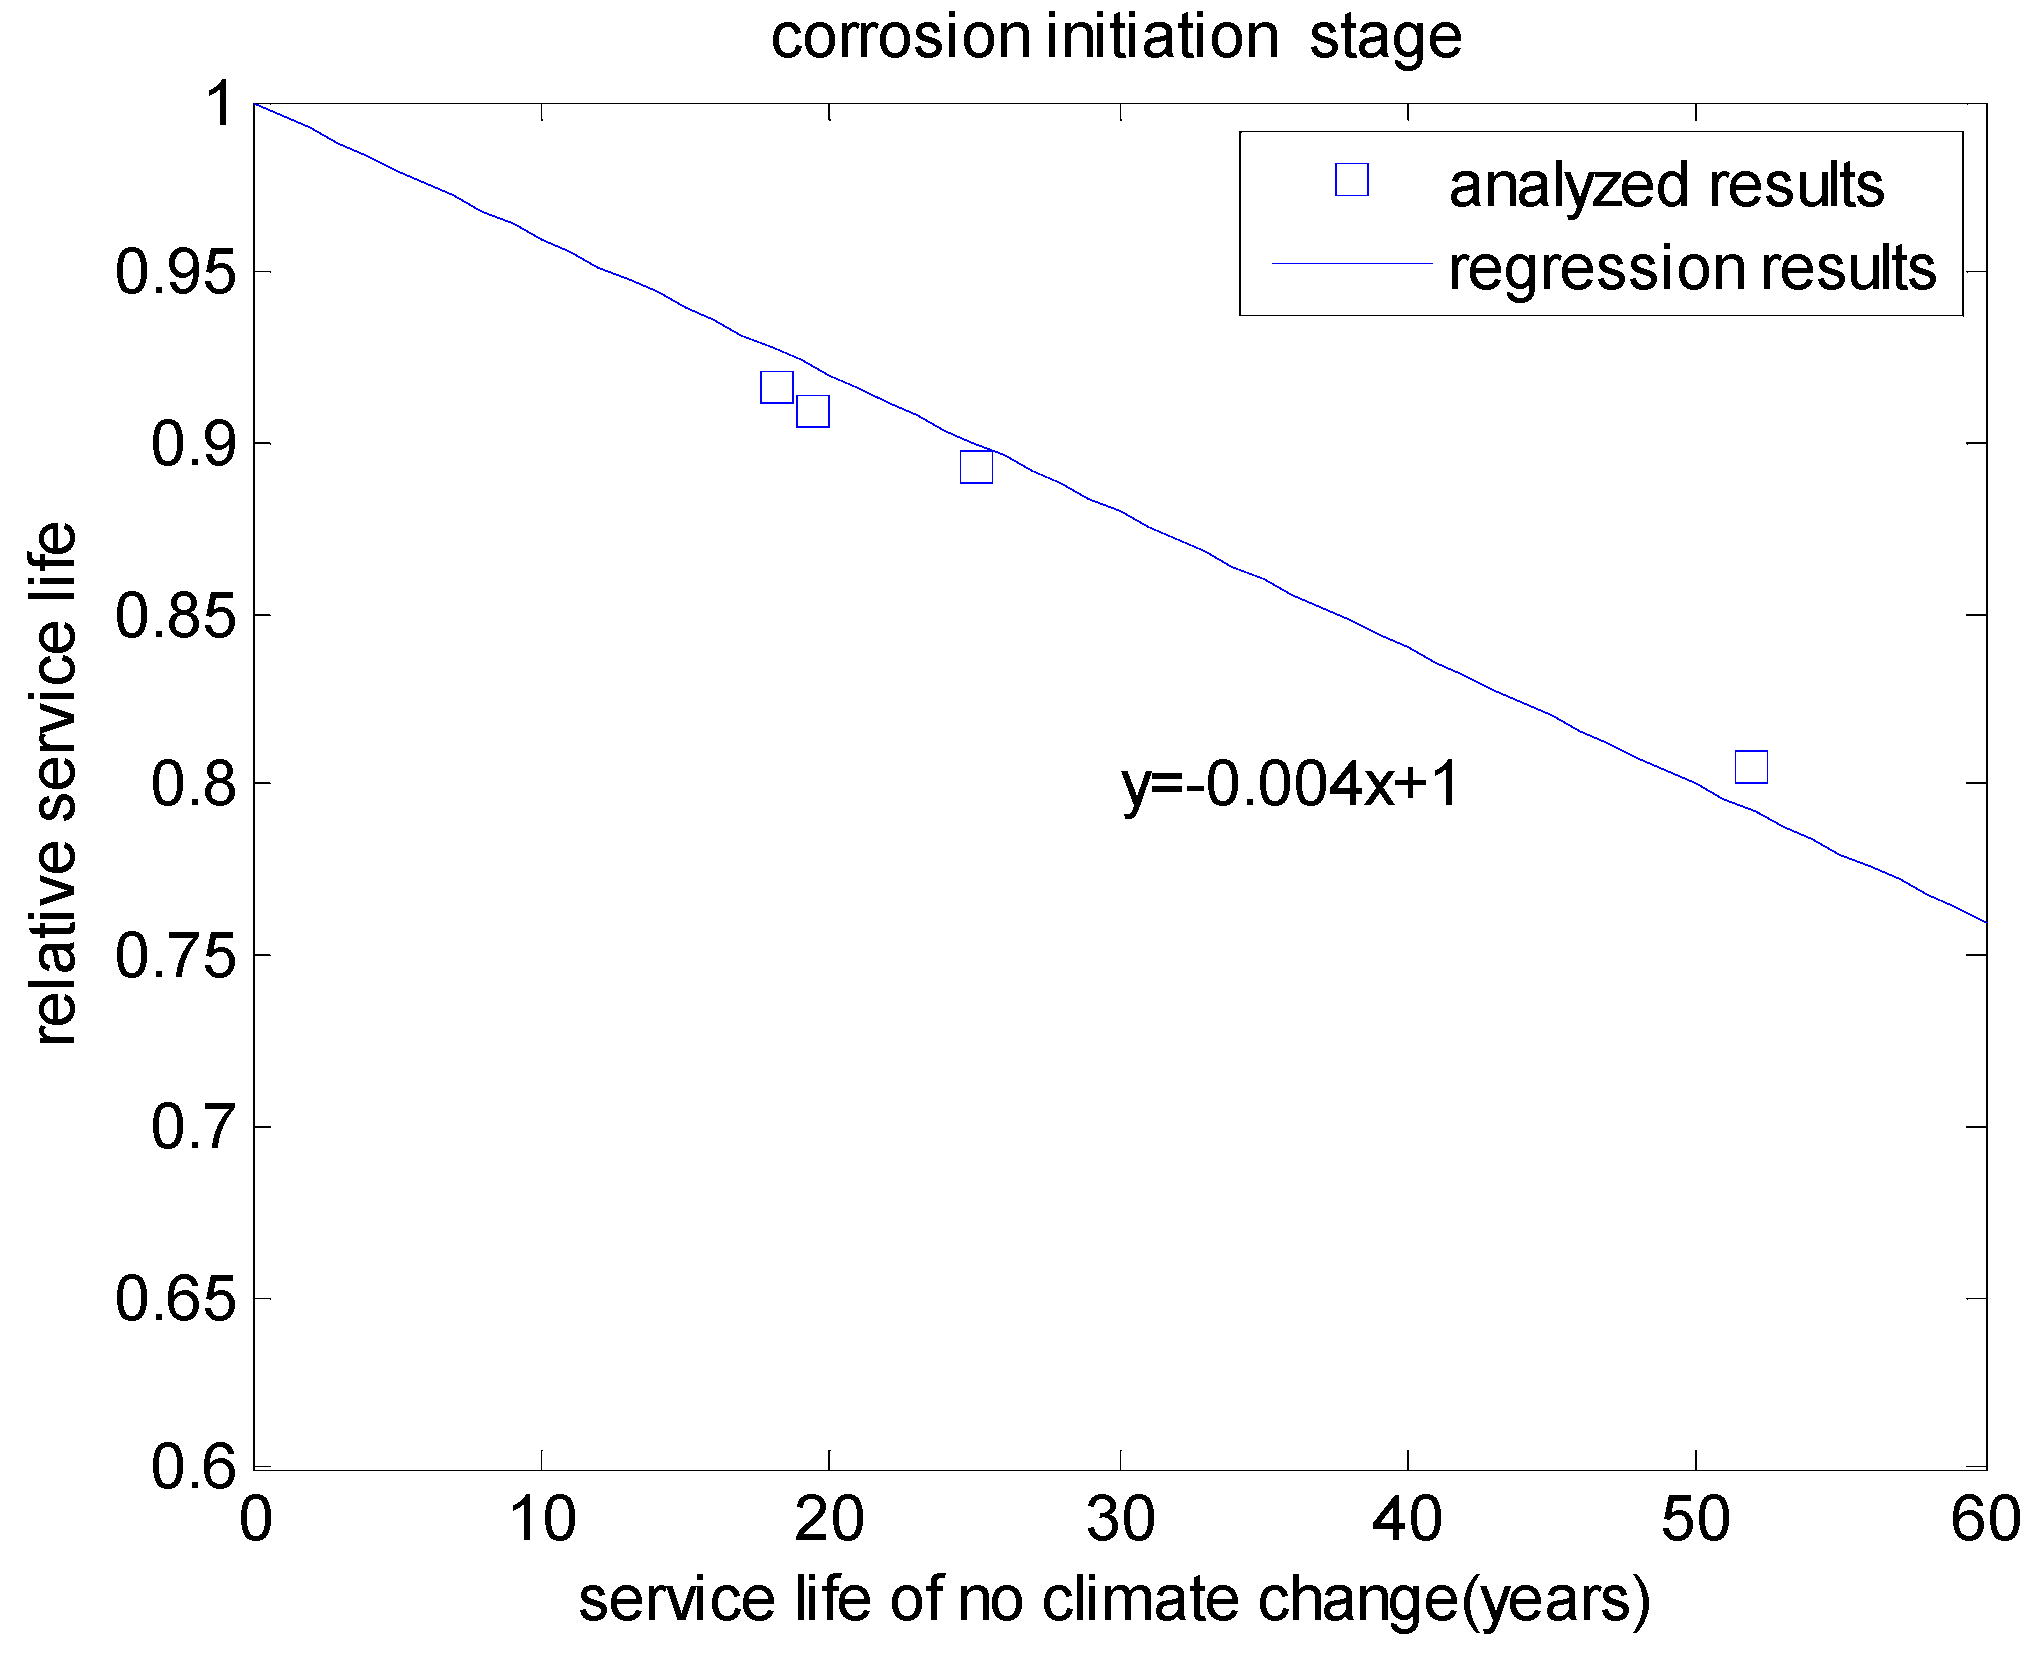
In the corrosion initiation stage, the time required to reach 10% failure probability was regarded as the service life of the concrete [
20]. The service life can be determined for different levels of failure probability, based on the relation between the probability of corrosion initiation and time, by using the interpolation method.
2.2. Corrosion Propagation after Carbonation
After the carbonation depth of concrete exceeds the cover depth, corrosion of the steel rebar initiates. By using Faraday’s law [
21], the corroded depth of the steel rebar can be determined as follows:
where
is the corroded depth of the steel rebar,
is the corrosion current density,
is the atomic weight of iron corroded,
is Faraday’s constant, and
is the density of iron.
An increase in temperature will increase corrosion current density. The relation between corrosion current density and temperature is as follows [
14]:
where
is the corrosion current density at 20°C (shown in
Table 1), and
= 0.025 if
< 20 °C and
= 0.073 if
> 20 °C [
14]. Owing to global warming, environmental temperature increases with time. To consider time-dependent temperatures, similar to those shown in Equations (8) and (9), the difference method is used.
The corroded depth of the steel rebar is not homogeneous. For carbonation-induced corrosion, corrosion generally occurs on the side of the steel rebar near the surface of the concrete. Using the corroded depth of the steel rebar, the degree of corrosion of the steel rebar can be determined as follows [
21]:
where
is the degree of corrosion of the steel rebar, and
is radius of the steel rebar.
Once the degree of corrosion of the steel rebar exceeds a threshold value, the cracking of the surface concrete occurs. Wei et al. [
21] performed a finite element analysis of the crack propagation process of concrete cover induced by non-uniform corrosion of the steel rebar. The analyzed threshold value of the degree of corrosion for cracking of the surface concrete is as follows [
21]:
where
is the threshold value of the degree of corrosion of the steel rebar for surface concrete cracking,
is the thickness of the interfacial transition zone (ITZ) between the steel rebar and the concrete (
= 12.5 μm) [
21,
22],
is the tensile strength of concrete,
is the volumetric expansion ratio between corrosion products, and the original steel rebar (
= 2.17) [
21,
22].
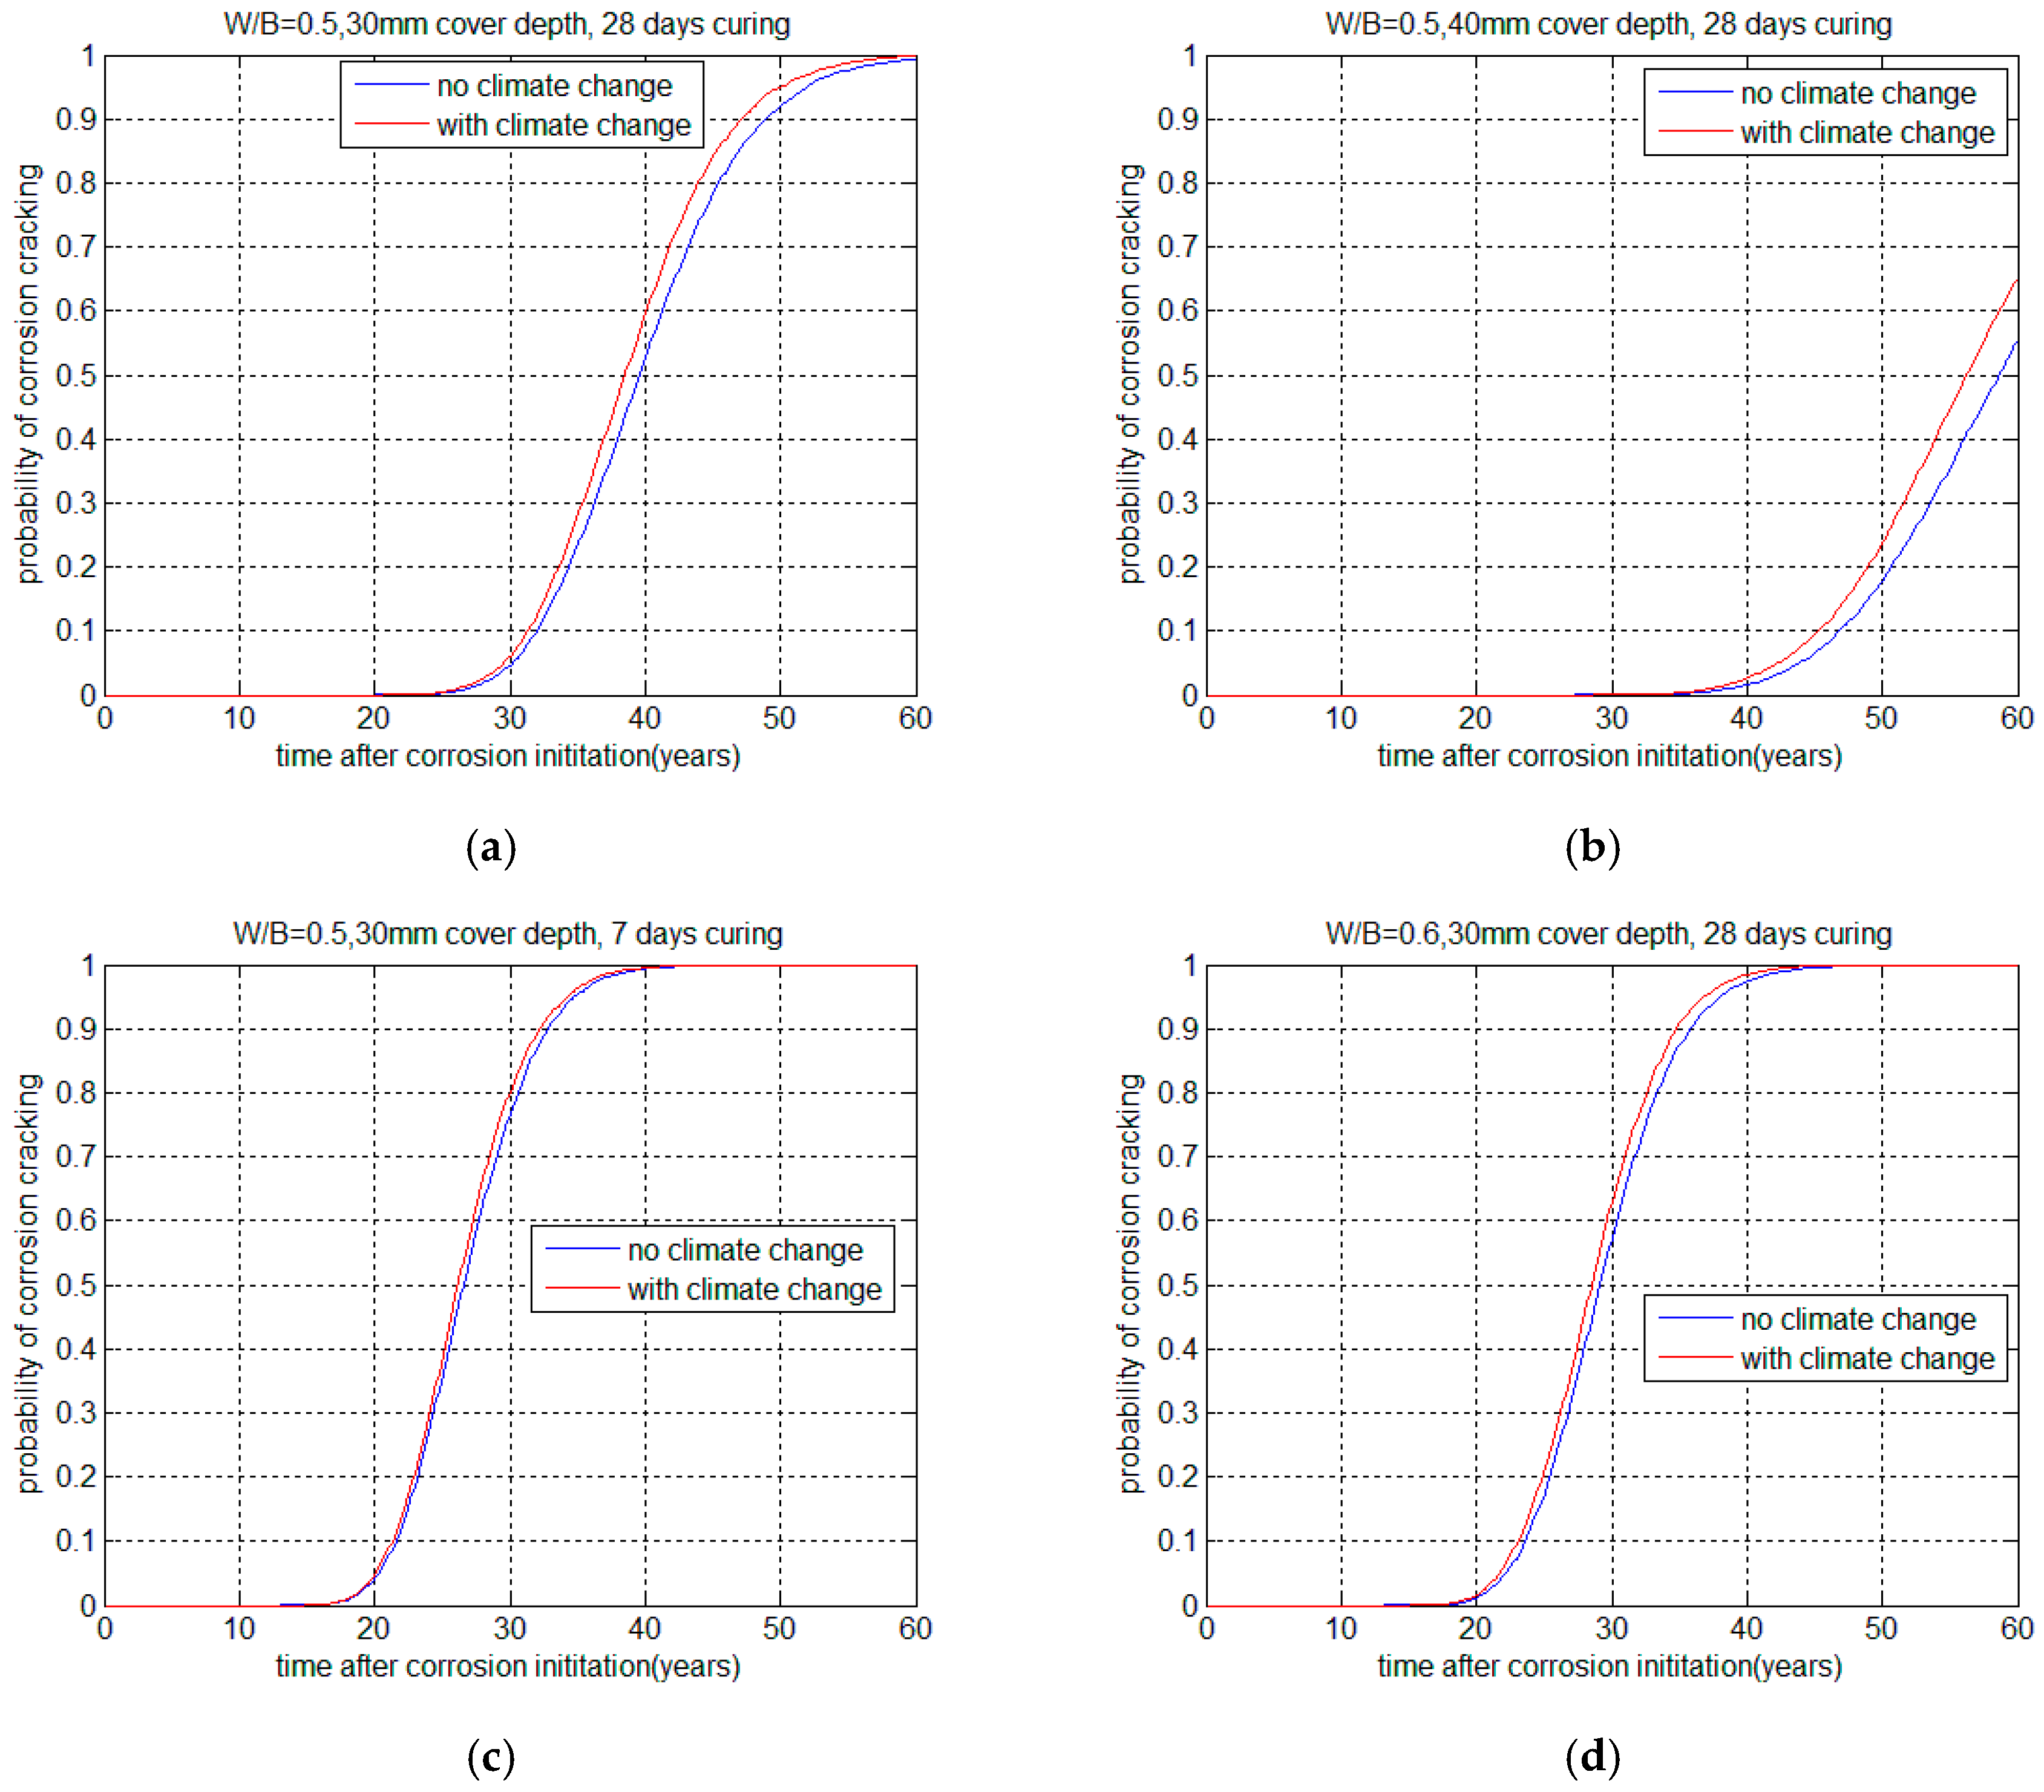
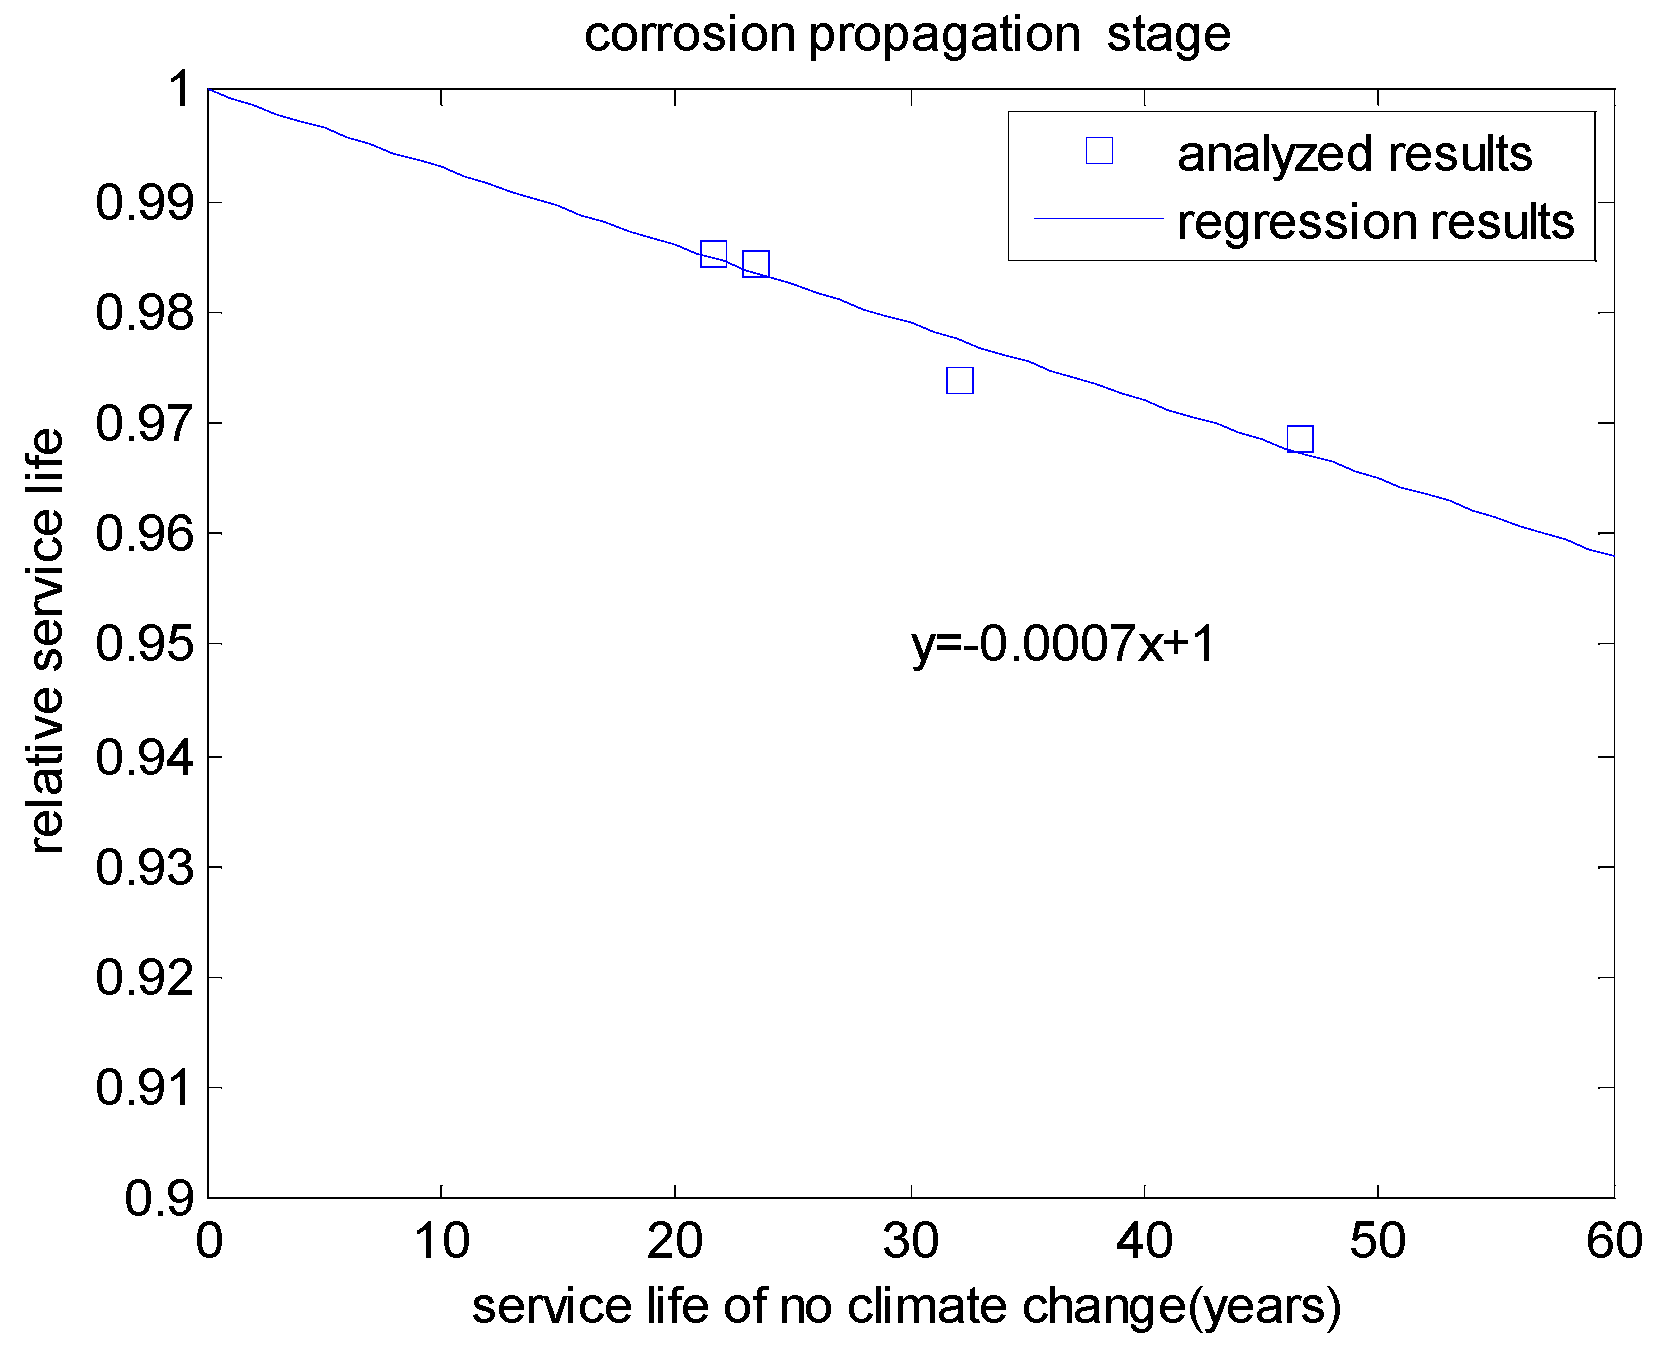
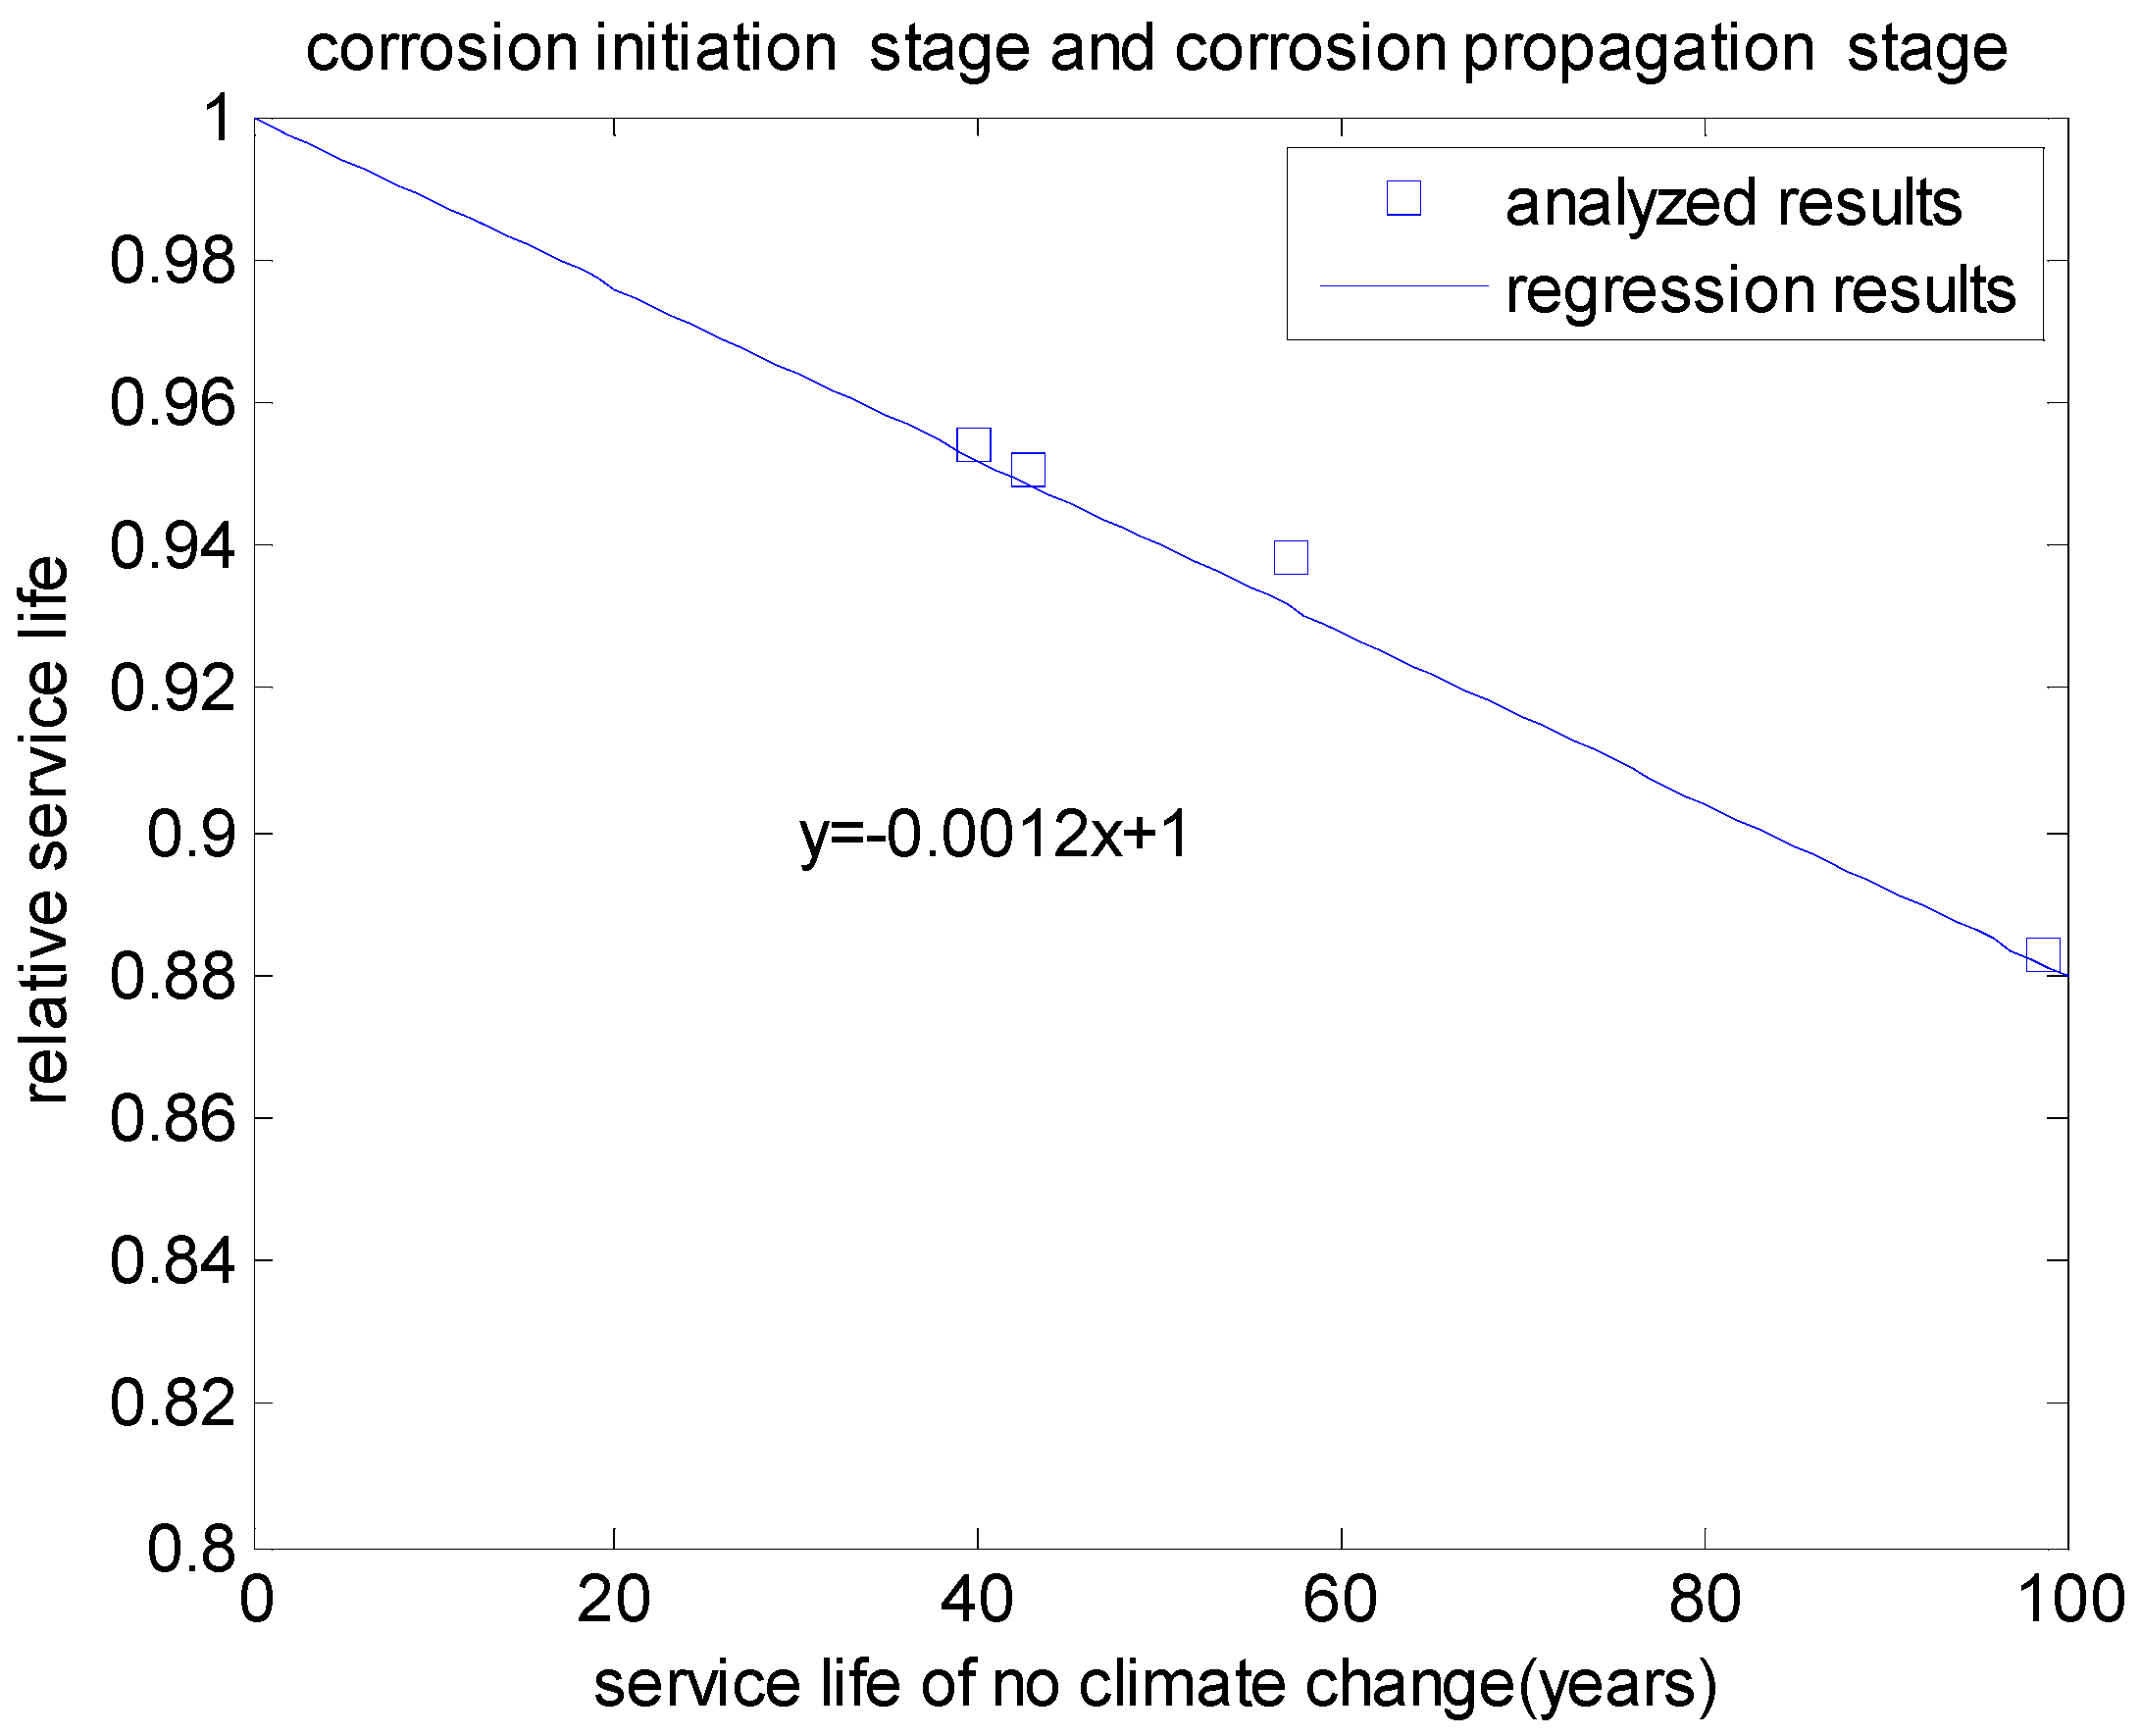
In the corrosion propagation stage, the durability failure criterion is defined as the degree of corrosion exceeding the threshold value of the degree of corrosion for cracking of the surface concrete. The durability failure probability can be determined as follows [
20]:
Similarly, by using the Monte Carlo simulation method [
20], the probability of corrosion cracking and service life of concrete structures in the corrosion propagation stage can be determined.


