Article

Seasonal and Interannual Fluctuation of the Microbial Soil Community in a Maize Field under Long-Term Conservation Agriculture Management

1
Departmento de Ciencias Biomédicas, Facultad de Ciencias, Universidad de Extremadura, 06071 Badajoz, Spain
2
Área de Edafología y Química Agrícola (Facultad de Ciencias) and IACYS, Universidad de Extremadura, 06071 Badajoz, Spain
3
Instituto Politécnico de Portalegre, Escola Superior Agrária de Elvas, 7350 Elvas, Portugal
4
Instituto Superior de Agronomia, LEAF, Linking Landscape, Environment, Agriculture and Food, Universidade de Lisboa, Tapada da Ajuda, 1349-017 Lisboa, Portugal
5
Área de Producción Vegetal (Escuela de Ingenierías Agrarias) and IACYS, Universidad de Extremadura, 06071 Badajoz, Spain
6
CIEO—Centre for Spatial and Organizational Dynamics, Gambelas, 8005-139 Faro, Portugal
*
Author to whom correspondence should be addressed.
Sustainability 2017, 9(5), 778; https://0-doi-org.brum.beds.ac.uk/10.3390/su9050778
Submission received: 6 February 2017 / Revised: 16 April 2017 / Accepted: 28 April 2017 / Published: 9 May 2017

Abstract

:
Soil’s microbiological settlement in a Zea mays parcel under long-term agricultural practices aiming to minimize the disruption of the soil’s structure, composition and natural biodiversity was analyzed by culture-dependent and culture-independent processes. Of the different processes, morphological-type differentiation of cultured microflora produced the best results and, while Polymerase Chain Reaction (PCR)-agarose electrophoresis has also provided us with reliable ones, soil PCR-DGGE (Denaturing Gradient Gel Electrophoresis) did not, which may occur because of the dependence of the method on the practice. Over a three-year period, this soil seemed very stable as its C/N ratio remained roughly constant and available for microbial growth. Because no soil overturning occurred, we were able to maintain most of the cultured microbial population whose fluctuations depended only on edaphoclimatic conditions. The number of cultured bacteria, molds, total microorganisms, and the biodiversity indices were usually lower in the driest season (fall) than in the rest of the year, except for Acinetobacter and Stenotrophomonas, which showed the opposite behavior. Coincident with the rise in temperature during the summer, the relative abundance of Gram+ bacteria increased, mostly reflecting an increase in the spore-forming bacteria Streptomyces and Bacillus. Despite these variations, the evenness index and the quantity of distinct microbiological life remained practically unaltered, recovering their maximum levels when the proper edaphoclimatic conditions were present, which indicates the long-term stability of the microbial community in this soil. The performed study put forward important insights for assessing the sustainability of maize production under long-term conservation agriculture management systems, highlighting that adequate management might prevent the degradation of soil quality, thus contributing to promote sustainable agriculture.

1. Introduction

Traditional agricultural practices can contribute to a decrease in soil quality, considering that tillage introduces processes that may damage the natural soil ecosystem. In fact, tillage modifies considerably many of the soil’s physical properties including bulk density, pore space, pore size distribution, water holding capacity, soil moisture content, and aggregation [1]. Soil erosion in the Mediterranean basin is particularly common [2], and south-western Spain is no exception. Also, the constantly shifting climate of the region make it very averse to proper crop development and, if on one hand the high temperatures felt in the summer lead to the soil’s quick water depletion, on the other the concentrated precipitation in the winter makes way for the “splash” effect, which accelerates the region’s soil erosion and leads to higher rates of organic matter (OM) mineralization, causing the already scarce contents of OM in the soil to deplete more quickly and, consequently, cause lower microbiological activity [3]. Microbial activity is the cornerstone and natural source for maintaining environmental sustainability [4]. As ecosystem functioning is largely dependent on soil microbial dynamics, and the biological diversity of these systems is being altered, ecosystem sustainability is at risk [5]. In order to control soil’s degradation, to increase its water-holding capacity [6] and to improve soil microorganism dynamics considering the implementation of more beneficial environmental conditions [7,8], practices that mitigate the disruption of the soil’s structure, composition and its natural biodiversity are required. Soil microbial diversity is important to the sustainability of agricultural ecosystems as microbes facilitate several processes that support agronomic production [9]. It is stated that the physico-chemical properties of the soil are proportionate to its microbiological content [10,11] and that microbiological life is a favorable indicator of proper soil characteristics [12,13,14,15].
Soil quality can be assessed through the primary action that microbiological life has on OM mineralization [16], and because it affects the soil’s sustainability it is important to assess the effect that the microbiological communities have on the soil [17,18] and also the overall agricultural ecosystem’s sustainability [9]. The limited information available on microbiological diversity, its stability and its dynamics in soil [19,20,21], and how it determines soil’s capacity to respond to external alterations, including degradation provoked by agriculture and the role in environmental sustainability, makes it important to improve knowledge about the characteristics and the seasonal fluctuations of these communities in settled cultural soils to measure the significance of changes derived from human activity [21,22,23].
Although soil’s microbiological life is diverse, only about 1% or less can be cultured and isolated using common laboratory media [24]. To overcome that limitation, various non-culturing procedures that depend on nucleic acid extraction and polymerase chain reaction (PCR) gene amplification using molecular techniques are the preferred approaches to assess soil microbiological community structure and dynamics [25,26]. However, differences have been found among culture-dependent and culture-independent methods. Both techniques result in certain bias, resolving different fractions of bacterial communities [25,27,28]. Despite this, current microbial community fingerprinting methods cannot provide fully reliable diversity indices [29], though they can be used to compare levels of biodiversity in different habitats and ecosystems or to look at the impacts of different types of stimuli on biodiversity [30,31].
Copiotrophs, containing high-GC Gram-positive bacteria are best represented by culture-dependent methods, while difficult-to-culture widespread genera such as Acidobacteria and Verrucomicrobia are best represented by culture-independent methods [32,33,34]. These strategies can be highly useful to assess microbial community stability in soil, as the results they produce are quite complementary [27,35,36]. Also, culturable bacteria communities, because of their high total biomass and metabolic activity, are very important to the soil ecosystem [26], serving, therefore, as responsive indicators of the physical, chemical, and biological changes in the ecosystem and its sustainability [37].
In this study, the fluctuations of the microbiological communities in a Zea mays production area, under specific agricultural practices aiming to minimize the disruption of the soil’s structure, composition and natural biodiversity, were analyzed both by culture-dependent and culture-independent methods. We then compared and analyzed the obtained data that resulted from the different approaches, in relationship to the studied soil’s microbiological community.

2. Materials and methods

2.1. Sampling Site

For three consecutive years, topsoil samples (0–10 cm) were collected using sterile tools, sent to the laboratory and stored at 4 °C for less than 72 h before its analysis. The samples were obtained from a Zea mays culture located in south-western Spain (Extremadura—lat: 39°06′N; long: 5°40′W). The site has a Mediterranean climate with a mean annual precipitation below 500 mm with very hot dry summers. The soil was a stony distric luvisol (ISSS-ISRIC-FAO, 1994) [38] with 21%, 30% and 49% of clay, silt and sand, respectively. The soil’s pH is 5.3. This region has a serious limitation in developing sustainable agriculture with an aridity index below 0.50 according to the UNESCO [39].
The studied area was sowed with a winter crop of Avena strigosa using a direct seeding system and, thus, no soil overturning occurred. The remaining straw stubble was left on the soil’s surface. Irrigation started at maize sowing (April), and was maintained throughout the growing season until two weeks before harvest at the end of September. Since this conservation management regime had been initiated six years before the beginning of our study, it was already categorizable as a long-term regime.
The study area was divided into four plots of about 200 m2 (20 × 10 m) each. Each plot was sampled in triplicate four times a year, once a season with samples taken in January, April (before sowing), July, and September (after harvesting). The sampling date for each season varied between 10 to 20 days because we tried to sample under similar environmental conditions of soil moisture and temperature.

2.2. Physical and Chemical Analyses of Soil

Samples were air-dried and crushed to pass a 2 mm sieve before assay. Organic C was defined using dichromate oxidation [40]. After using the Kjeldahl method, total N content was determined [41]. Soil moisture content (vol/vol) was measured on a monthly basis using a PR1 capacitance profile probe (Delta-T Devices Ltd, Cambridge, UK), a sealed composite rod, ~25 mm diameter, with electronic sensors, organized according to fixed intervals along its length. Soil temperature was monitored at 1 h intervals using a temperature probe inserted 10 cm into the soil, and connected to a data logger.

2.3. Plating of Soil Samples and De Visu Analysis of Cultured Microorganisms

Soil samples were passed through a 2-mm sterile sieve, resuspended in sterile water (5 g/50 mL) and diluted up to 106 times using sterile distilled water. To detect the greatest amount of culturable bacteria and fungi [42], 100 µL aliquots were spread onto different agar culture media: yeast extract peptone dextrose (YEPD), malt extract (ME), a special medium for Azotobacter and Azomonas (AZO), peptone (PEP), and tryptone soy agar (TSA) [43], Rose Bengal (RB) agar [44], starch-casein (SC) [43] and malachite green (MG) agar, a special medium for Pseudomonas [45]. Cultured microorganisms from each sample were expressed as total colony forming units (CFU) g−1 dry soil. Soil moisture content was determined by weighing fresh and dried soil (100 °C for 24 h). Plates were incubated at 25 °C, for up to 10 days to detect slow-growing microorganisms.

2.4. DNA Extraction from Soil and Cultured Bacteria

Total soil DNA was extracted from 1 g of soil with an UltraClean soil DNA kit (Mo Bio Laboratories Inc., Solana Beach, CA, USA). The cultured bacteria total DNA was extracted from a suspension combining all the colonies raised on TSA, PEP, and SC plates. Approximately the same amount of biomass from each colony was carefully picked up and suspended all together in 500 μL of sterile water. The bacteria were lysed by freeze-thawing. This procedure facilitates the detection of slow-growing cultured bacteria by PCR amplification.

2.5. PCR Amplification, Sequencing of 16S Ribosomal DNA and Bacteria Identification

The PCR was directly performed from lysed bacteria or purified soil DNA with the kit pReTaq Ready-To-Go PCR Beads (Amersham Biosciences, Little Chalfont, UK), with the 16S ribosomal DNA (rDNA) specific bacterial primers 27F (forward) and 907R (reverse) [46]. The thermocycler protocol considered an initial denaturation step of 95 °C for 2 min, followed by 35 cycles of denaturing at 95 °C for 15 s, annealing at 55 °C for 15 s, and extension at 72 °C for 2 min; and a final extension at 72 °C for 10 min [47]. The amplification products were purified with the Jetquick PCR purification Spin Kit (Genomed, Löhne, Germany) as a preliminary step for DNA sequencing of isolated bacteria as per the manufacturer’s recommendations and the purified rDNA PCR fragment, from each of the isolated microorganisms, was sent to the sequencing service Secugen S.L. in Madrid, Spain and performed on a ABI 3700 sequencer. The partial 16S rDNA gene sequences were manually edited with the software Chromas v. 1.45 (http://www.technelysium.com.au/chromas.html), and were analyzed against those in GenBank by using Blast [48].

2.6. PCR-Agarose Gel Electrophoresis of the Bacterial Soil Community

PCR amplification of soil or cultured bacteria DNA was carried out with primers 27F and 1527R (Escherichia coli numbering) following the hot-start touchdown PCR protocol [49] in a Thermocycler T-Gradient 96 (Biometra, Göttingen, Germany). This was followed by gel electrophoresis (2% agarose, TAE 0.5×) of 15 µL of each PCR amplification. After gel staining (with 0.5 µg/L of ethidium bromide), DNA fragment size (with respect to a 1 kb DNA ladder, GibcoBRL (Gel Company, San Francisco, CA, USA) and band intensities were determined. We analyzed the band patterns through the Diversity and Quantity software from Bio-Rad Laboratories (Hercules, CA, USA).

2.7. PCR-DGGE Analysis of the Bacterial Soil Community

The variable V3 region of 16S rRNA gene sequences of soil or cultured bacteria DNA was PCR amplified by using the bacterial primers 341F-GC (with a GC-rich tail on its 5’ side) and 518R [50] in a Thermocycler T-Gradient 96. The Denaturing Gradient Gel Electrophoresis analysis was performed as previously described [50] in a DCcode System (Bio-Rad Laboratories, Hercules, CA, USA). Four migration markers for Pseudomonas aeruginosa, Escherichia coli, Paenibacillus sp., and Streptomyces caviscabies were used as previously described [47]. We analyzed the band patterns through Bio-Rad which is a Diversity and Quantity software.
Soil samples and the seasonal and annual fluctuations of microbial communities were analyzed through different indices, the Shannon general diversity index H [51], the evenness index E [52], and the Simpson dominance index D [53] which were calculated from the number of bands on DGGE analyses and the relative intensities of these bands. The intensity of the bands was reflected as peak heights from densitometric curve. The indices were calculated from the following equations: H = − (ni/N) (log ni/N), E = Hmax/logS, and D = S − 1/logN, where N is the entire bands figure and S is the different bands figure.

2.8. Statistical Data Analysis

In order to measure time-induced changes in microbiological communities, discriminant analysis was utilized [54,55]. Analysis of variance (ANOVA) and the Duncan test for equality of means were used to detect significant differences between seasons and years. A 5% probability level was used to accept or reject the null hypothesis. All the statistical analyses were performed with the IBM Analytics SPSS (version 19.0, IBM Corp., Armonk, NY, USA).

3. Results

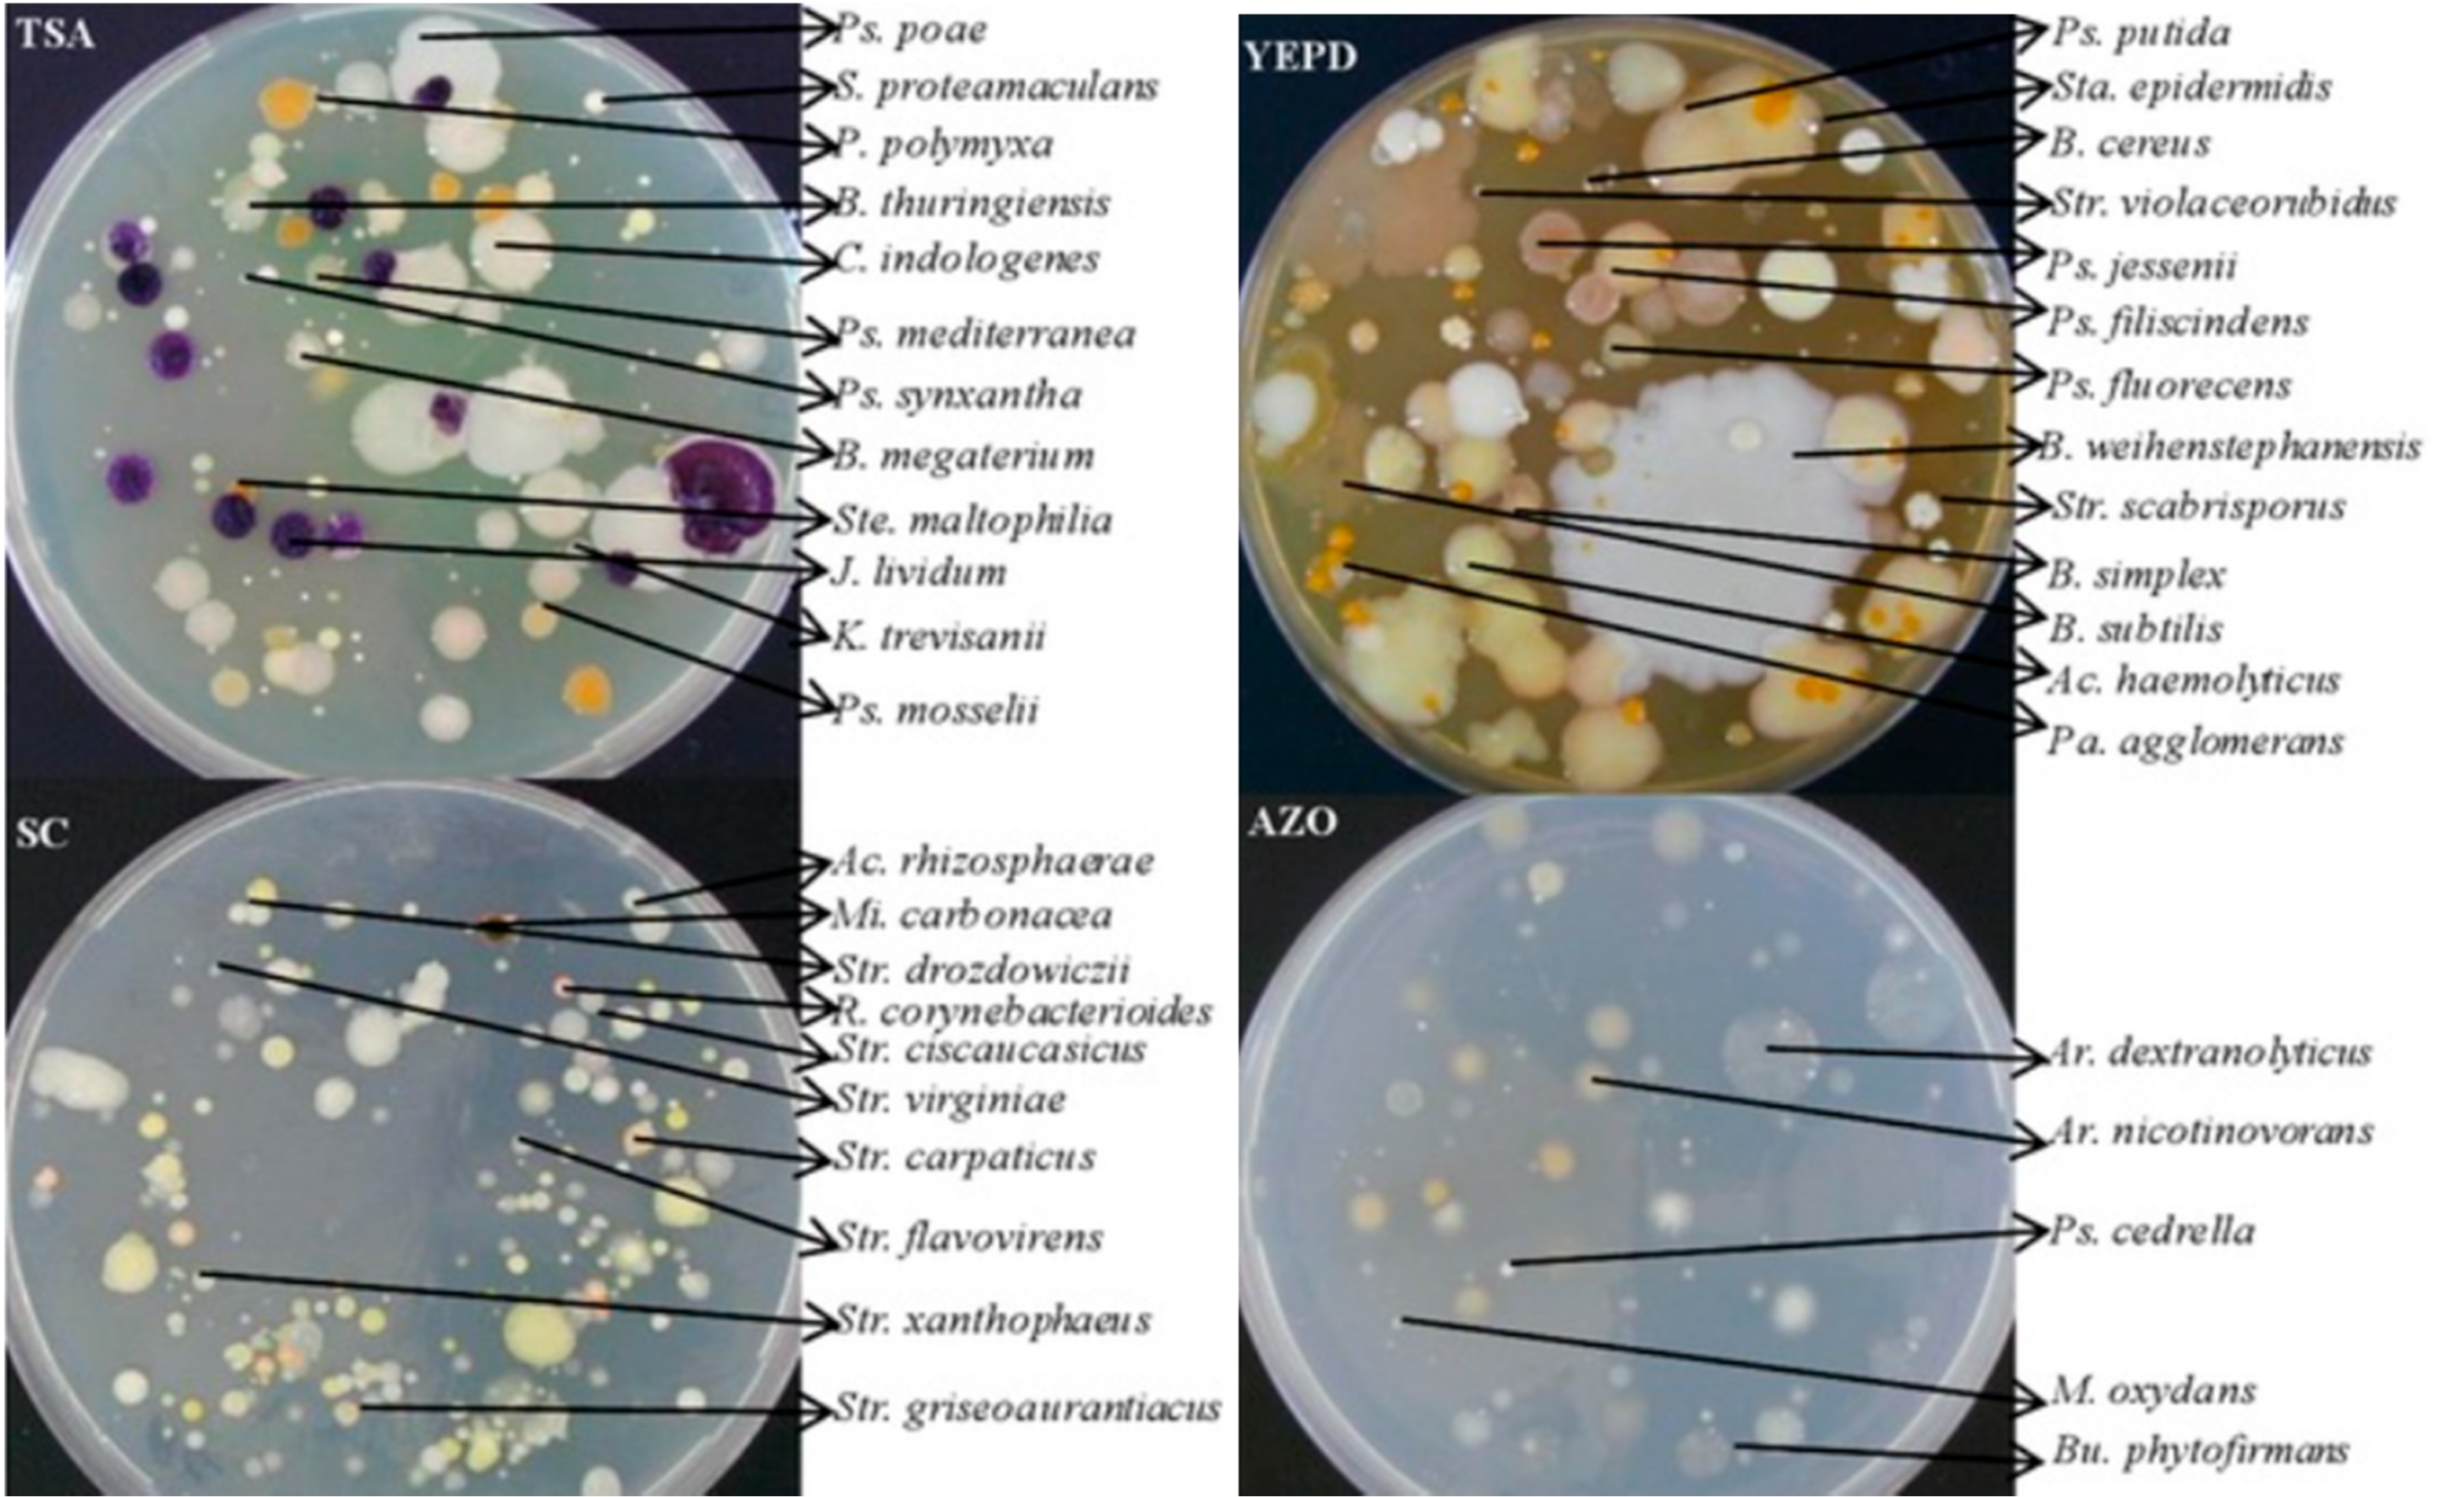
3.1. Analysis of Cultured Microorganisms

The microorganisms from a total of 36 soil samples (12 sampling dates per triplicate) were cultured in eight different culture media (YEPD, TSA, PEP, ME, RB, MG, AZO, and SC). A total of 72 bacterial morphological types were differentiated according to the colonies’ characteristics and cell morphology. After 16S rDNA sequencing, they were re-grouped into 43 bacterial species, in addition to two common groups for all the unidentified yeasts and molds (Figure 1 and Table 1). The genera with the greatest number of detected different species were Streptomyces (11 species), Pseudomonas (9 species), and Bacillus (6 species). They were also some of the most relatively abundant, together with Acinetobacter, Arthrobacter, and Stenotrophomonas. The amount of cultured molds was roughly 10% of total cultured microorganisms, with the lowest amount found in fall after harvest, when the soil moisture content decreased because irrigation had ceased and there was the usual absence of rain. The appearance of cultured yeasts was sporadic (Table 1). The differentiation of the 30 most frequent bacterial morphological types (present in most soil samples) was validated in some de novo experiments by confirming the data by 16S rDNA sequencing or DGGE analysis (for a total of 149 new isolated colonies). We confirmed that the total error of the morphological-type differentiation was moderately low, 4.02%, and was always below 29% for a given morphological-type, being 0% in most occurrences (Table 2). This error was mostly due to the morphological similarity between some of the species of Bacillus and Pseudomonas, and the difficulty in identifying Rhodococcus corynebacterioides and Stenotrophomonas maltophilia. The 13 remaining species were not considered in this validation because they appeared sporadically, in less than 7% of the soil samples, and always with a frequency lower than 1%.
It was expected that a greater number of microorganism species could be detected by increasing the number of different culture media used. However, although we used as many as eight media, most of the microorganisms detected using all of them were detectable using combinations of just three different media. For example, for a given soil sample (fall of the third year), of a maximum of 36 bacterial morphological types detected with the eight media (Table 3), all 36 were detected by using SC/YEPD/AZO, 32 by TSA/SC/YEPD, 33 by SC/PEP/AZO, 34 by TSA/SC/AZO, and 30 by TSA/SC/PEP (Table 4). The D index estimated by any of these three-media combinations varied from 11.38 to 12.24 (90.8–97.7% of the maximum achieved by using the eight media—12.53), and the H index from 2.49 to 2.72 (83.6–91.3% of the maximum achieved—2.98). The evenness varied from 0.78 to 0.81, very close to that estimated by using the eight media—0.91. Similar results were found for the rest of the soil samples, although it was not always possible to detect the maximum of species detected with the eight media by using a three-media combination, as occurred with the SC/YEPD/AZO combination in the above example.

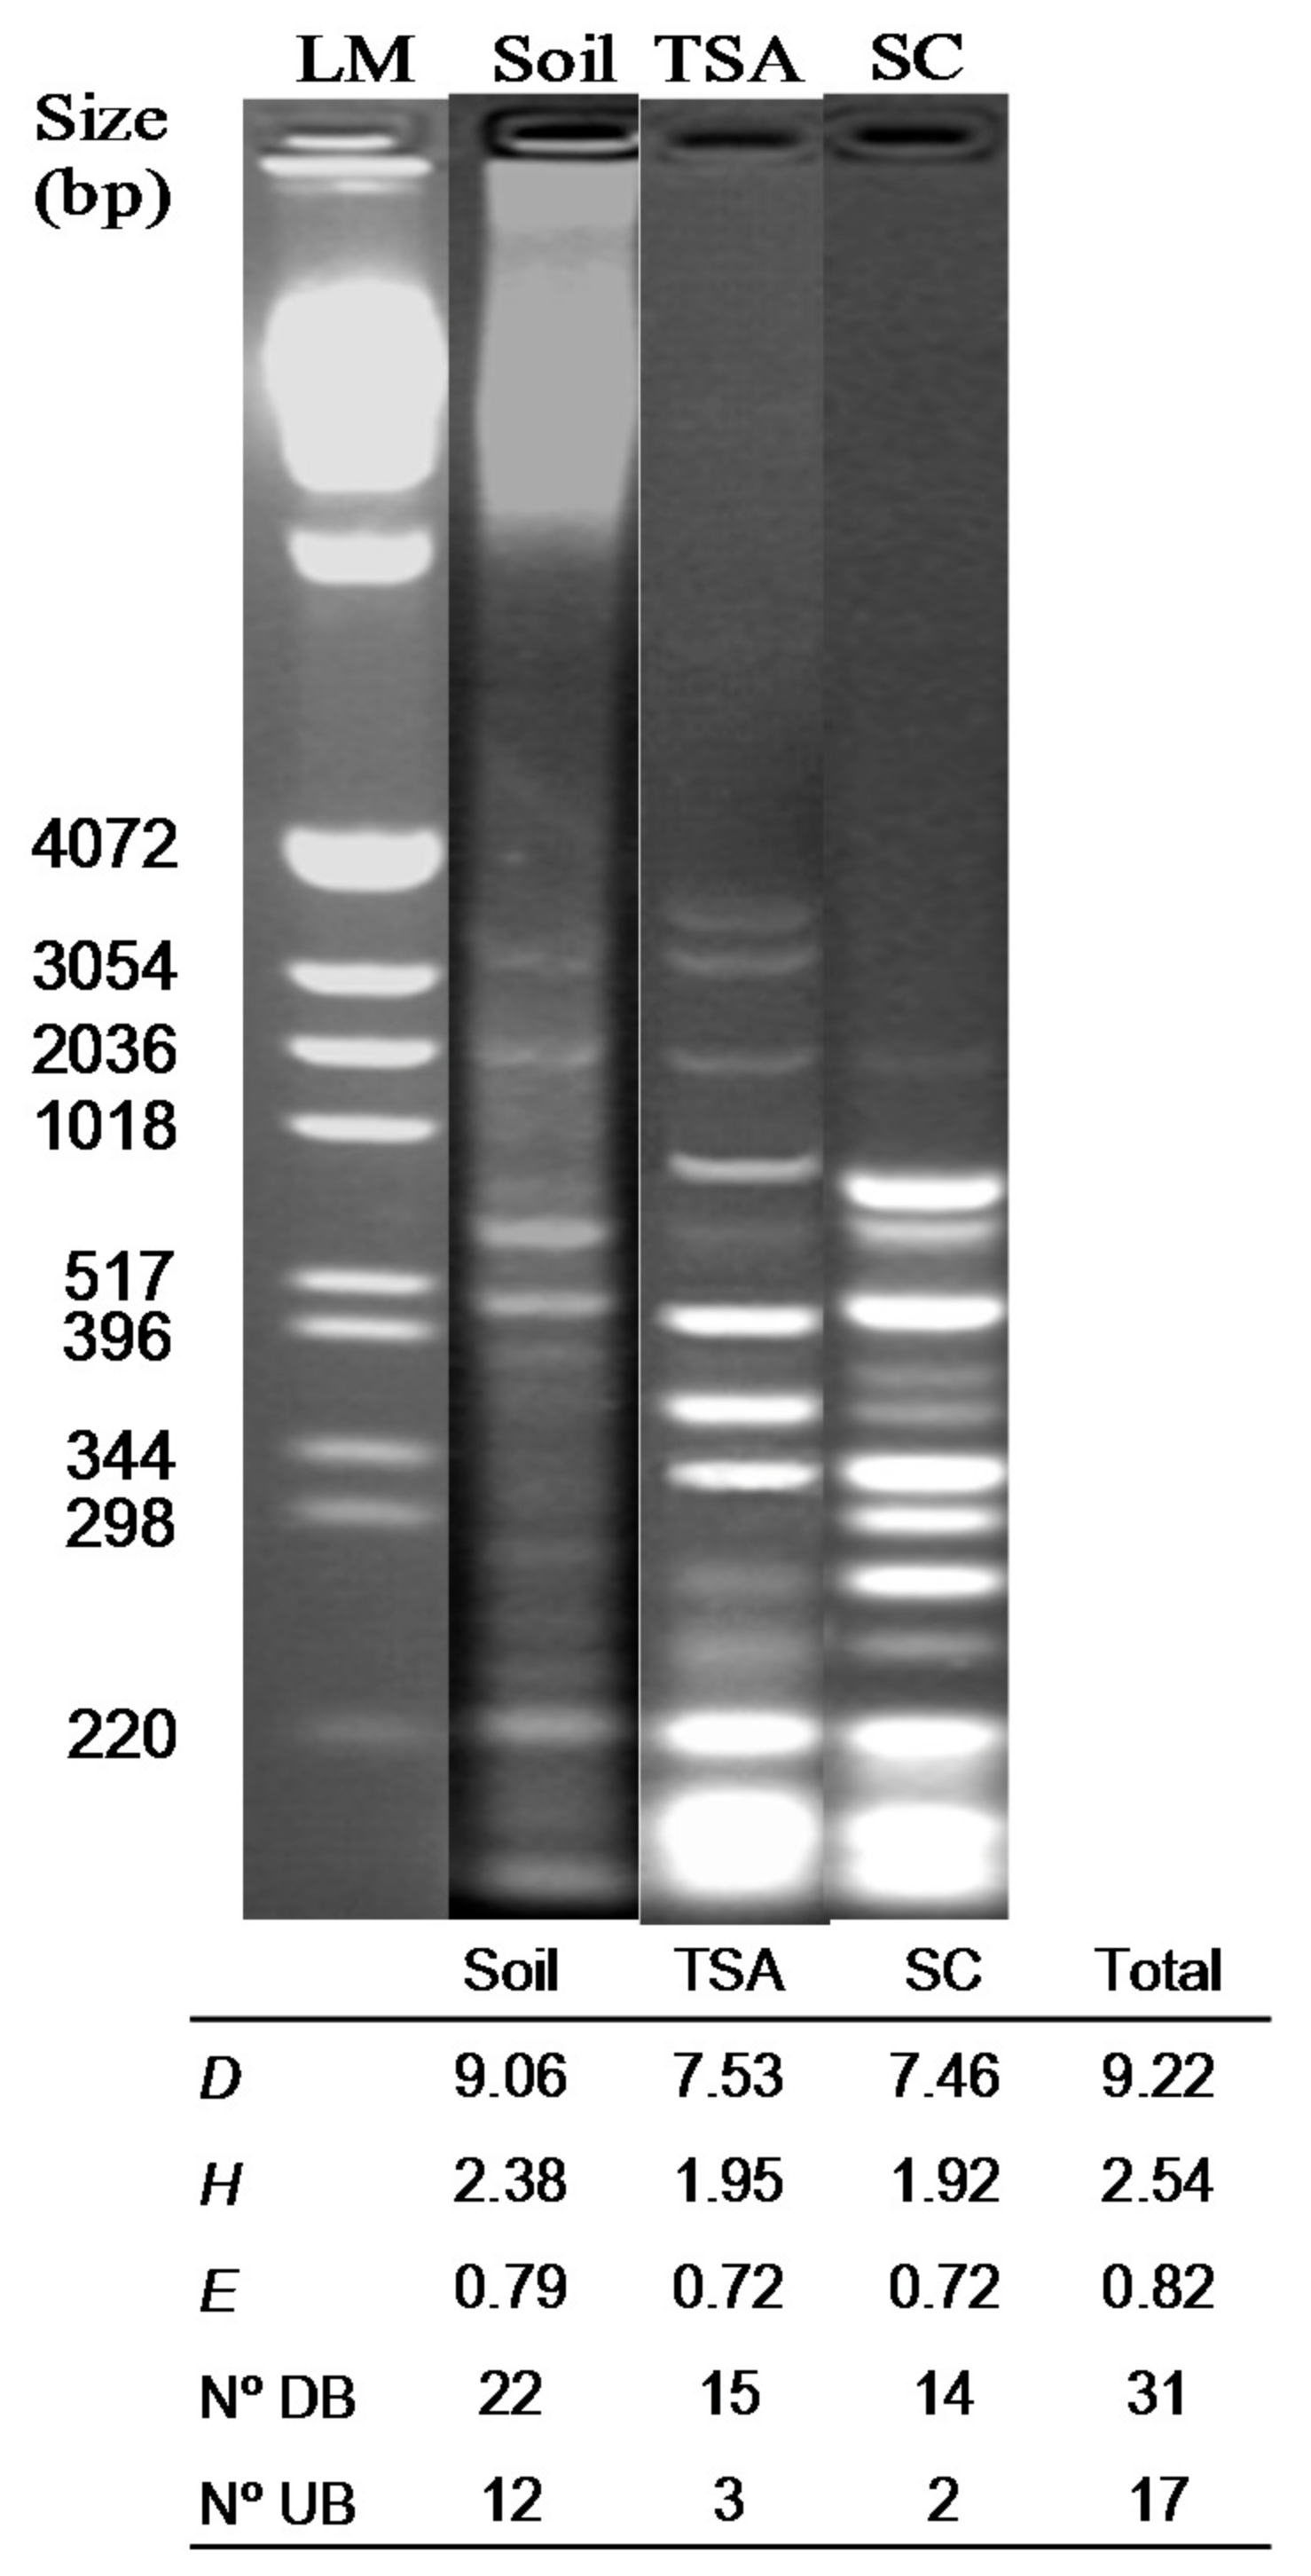
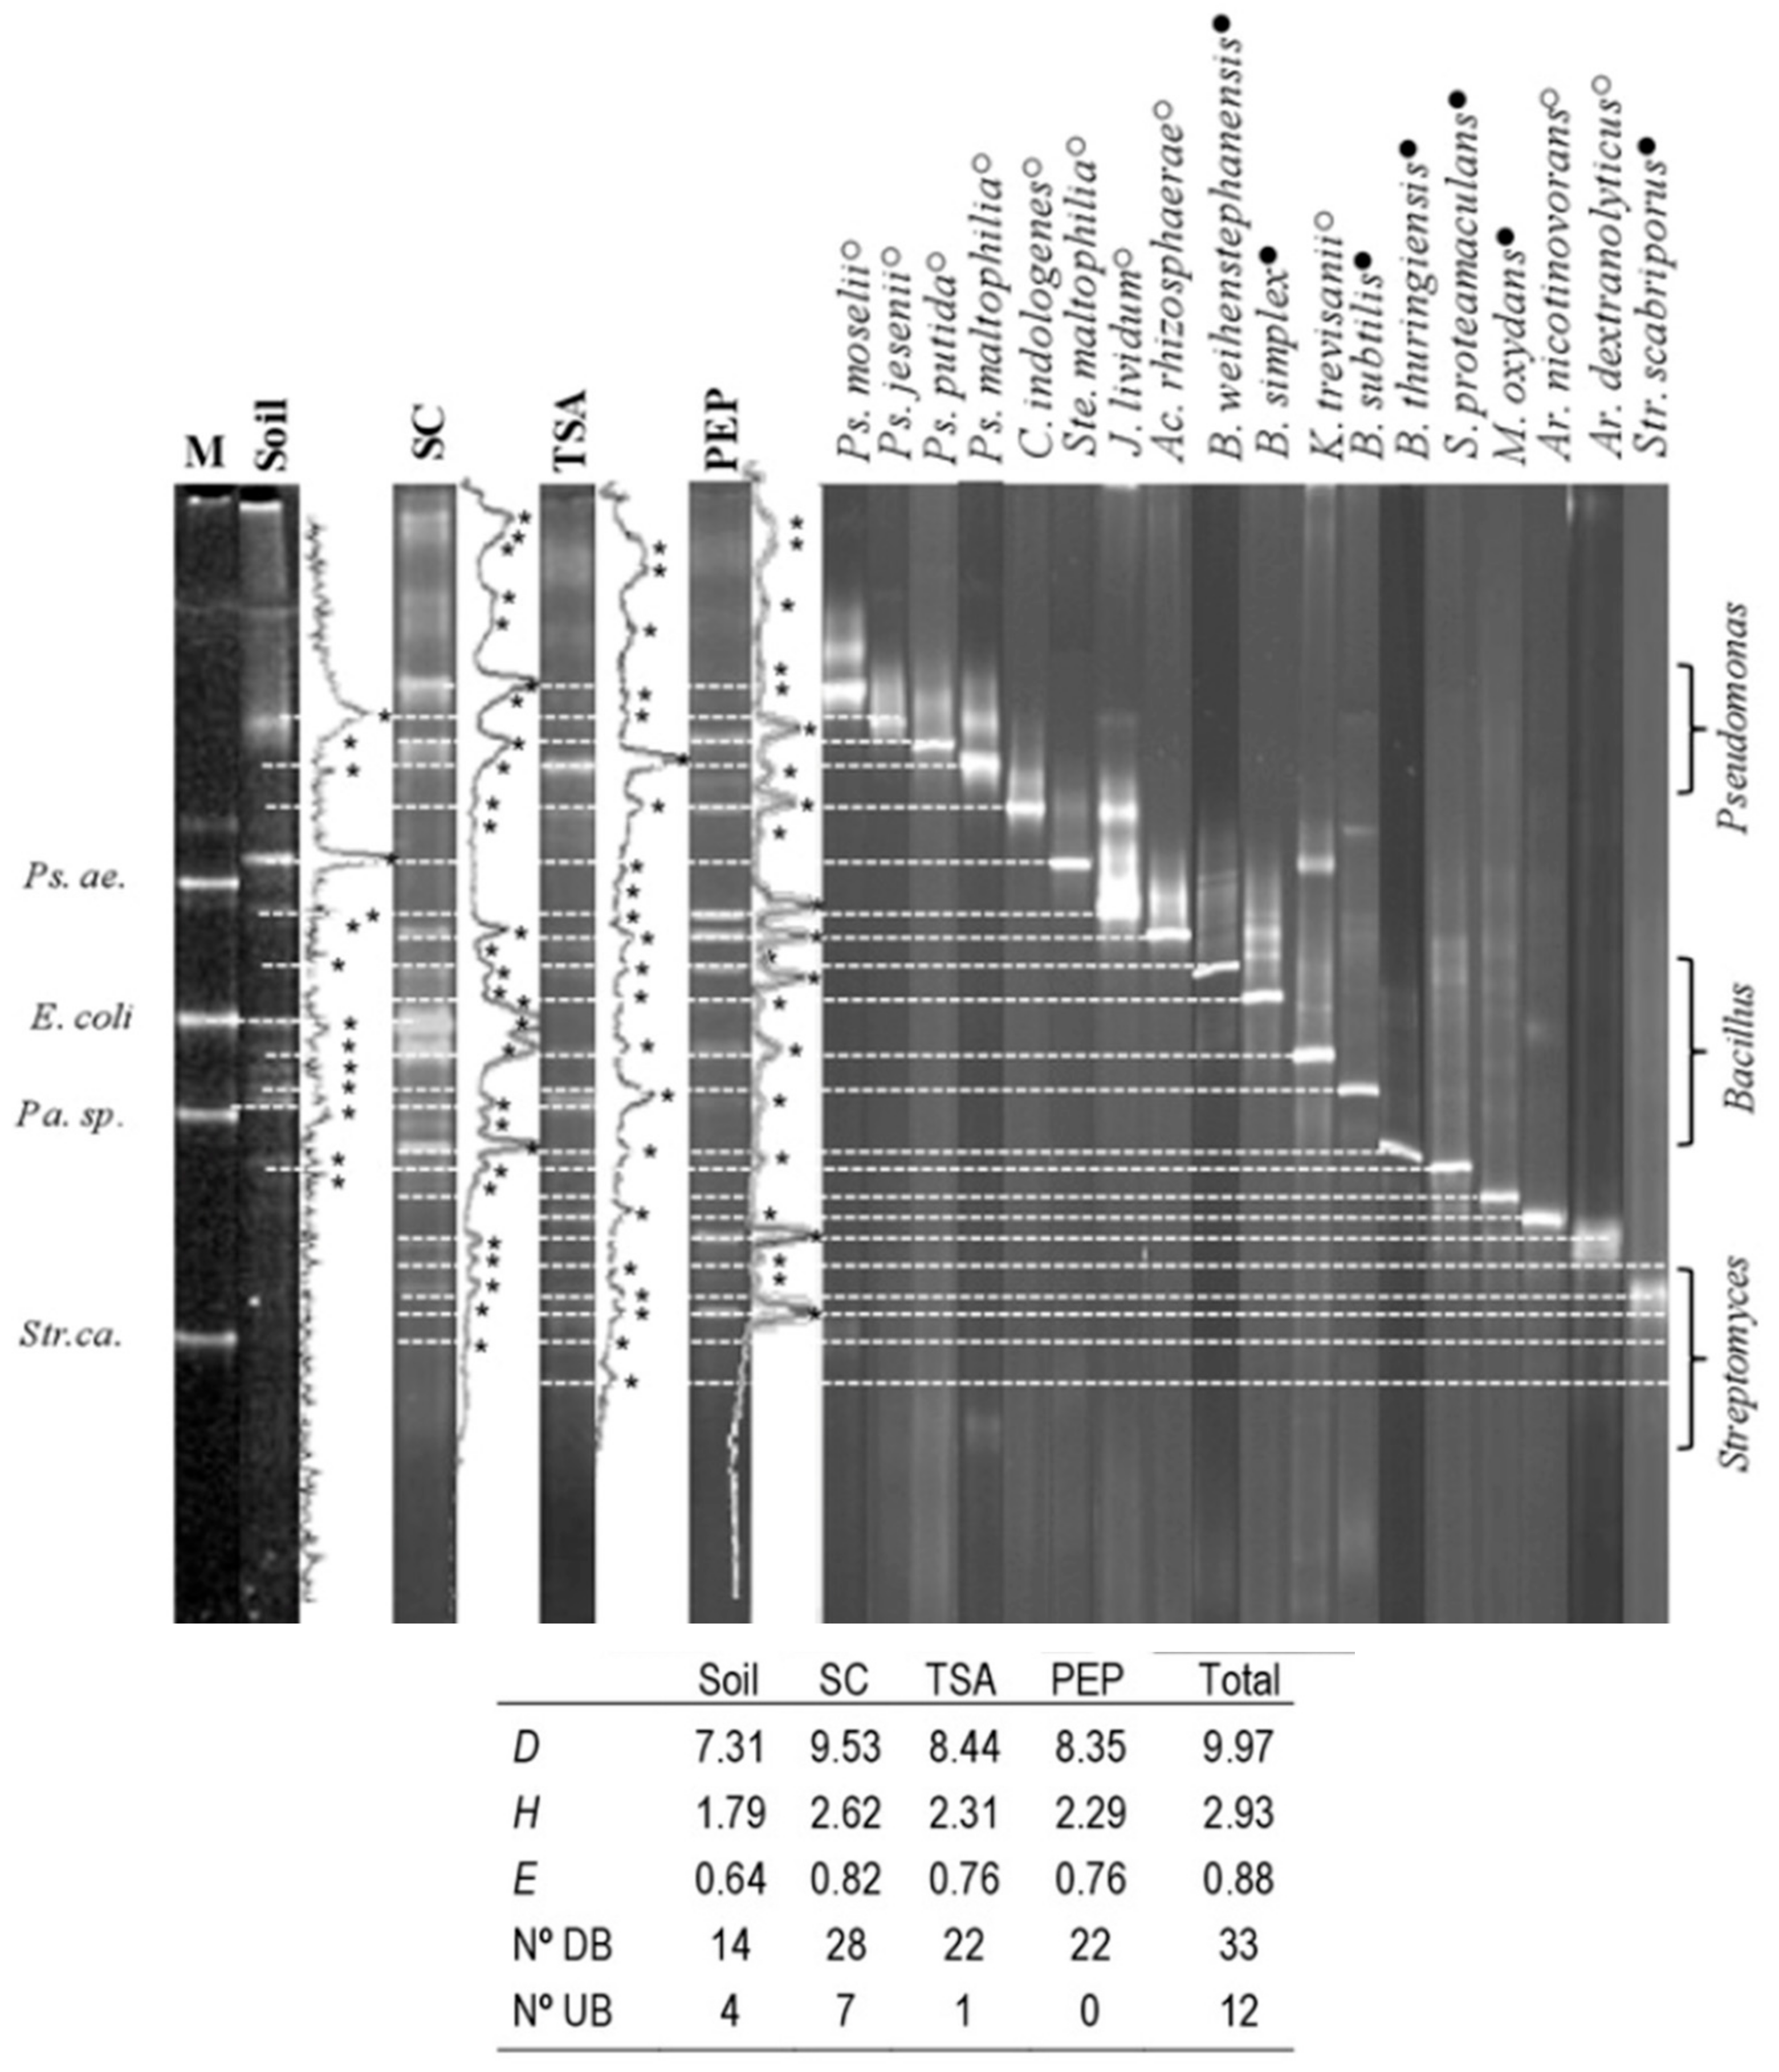
3.2. PCR-Agarose and PCR-DGGE Analysis of Soil and Cultured Bacteria DNA

In an attempt to improve the microbial biodiversity measurement, we also analyzed the same soil sample (fall of the third year) by PCR-agarose and PCR-DGGE to compare the results with those from the morphological-type differentiation of cultured microorganisms.
Although the results obtained with the soil DNA were not as clear and easy to interpret as those obtained with DNA from cultured bacteria, the number of different DNA bands detected by PCR-agarose of the soil DNA was greater than detected by analyzing the TSA or SC cultured bacteria (22 vs. 15 or 14, respectively), and the number of unique DNA bands detected was also much greater (12 vs. 3 or 2, respectively). Of the total of 31 bands detected, 17 were unique bands for one of these three techniques, and only 14 were shared by two or three of these approaches (Figure 2).
Fewer different DNA bands were detected by PCR-DGGE of the soil DNA than by analyzing the SC, TSA, or PEP cultured bacteria (14 vs. 28, 22, or 22, respectively). Also, the number of unique DNA bands detected by PCR-DGGE of soil was lower than detected by PCR-DGGE of SC-cultured bacteria (4 vs. 7), but greater than those detected in TSA or PEP cultured bacteria (4 vs. 1 or 0). Of the total of 33 different bands detected, 12 were unique for one of these techniques, while 21 were shared by two or more of the techniques. A variable proportion of the detected DNA PCR-DGGE bands was identified by visual matching to the DNA fragments of the specific microorganisms that were previously isolated and used in the DGGE as control markers: 11 out of 14 for the soil sample, 14 out of 28 for SC, 14 out of 22 for TSA, and 15 out of 22 for PEP medium (Figure 3). As was the case with PCR-agarose, the results obtained with the soil DNA were not as clear and easy to interpret as those obtained with DNA from cultured bacteria. Nevertheless, of the total of 35 DNA PCR-DGGE bands detected in the total of the soil samples analyzed, as many as 29 were identified by comparing with the 43 control markers, and only 6 (12%) were unidentified. Of the control markers obtained from cultured bacteria, 14 were not detected in any of the DNA soil samples. Most of these were Streptomyces (Str. carpaticus, Str. flavovirens, Str. xanthophaeus, Str. griseoaurantiacus, Str. virginiae, Str. ciscaucasicus, Str. drozdowiczii, Str. violascens, Str. carbonacea, Str. scabrisporus, Str. violaceorubidus), in addition to Ar. nicotinovorans, B. simplex, and B. megaterium. It is possible that spore-forming bacteria such as Streptomyces and Bacillus were not detected in the soil because of the difficulty in isolating the DNA from the spores, which would not be the case with DNA from the cultured bacteria [57]. The differences between the results obtained with the cultured-microorganism DNA from different culture media were not as evident (Figure 3). Very similar results were obtained for all the soil samples analyzed during the three years. In view of these results, we used the eight-media morphological-type differentiation of cultured-bacteria, soil PCR-agarose, and soil PCR-DGGE to analyze the fluctuation of the microbial soil community in this maize crop.

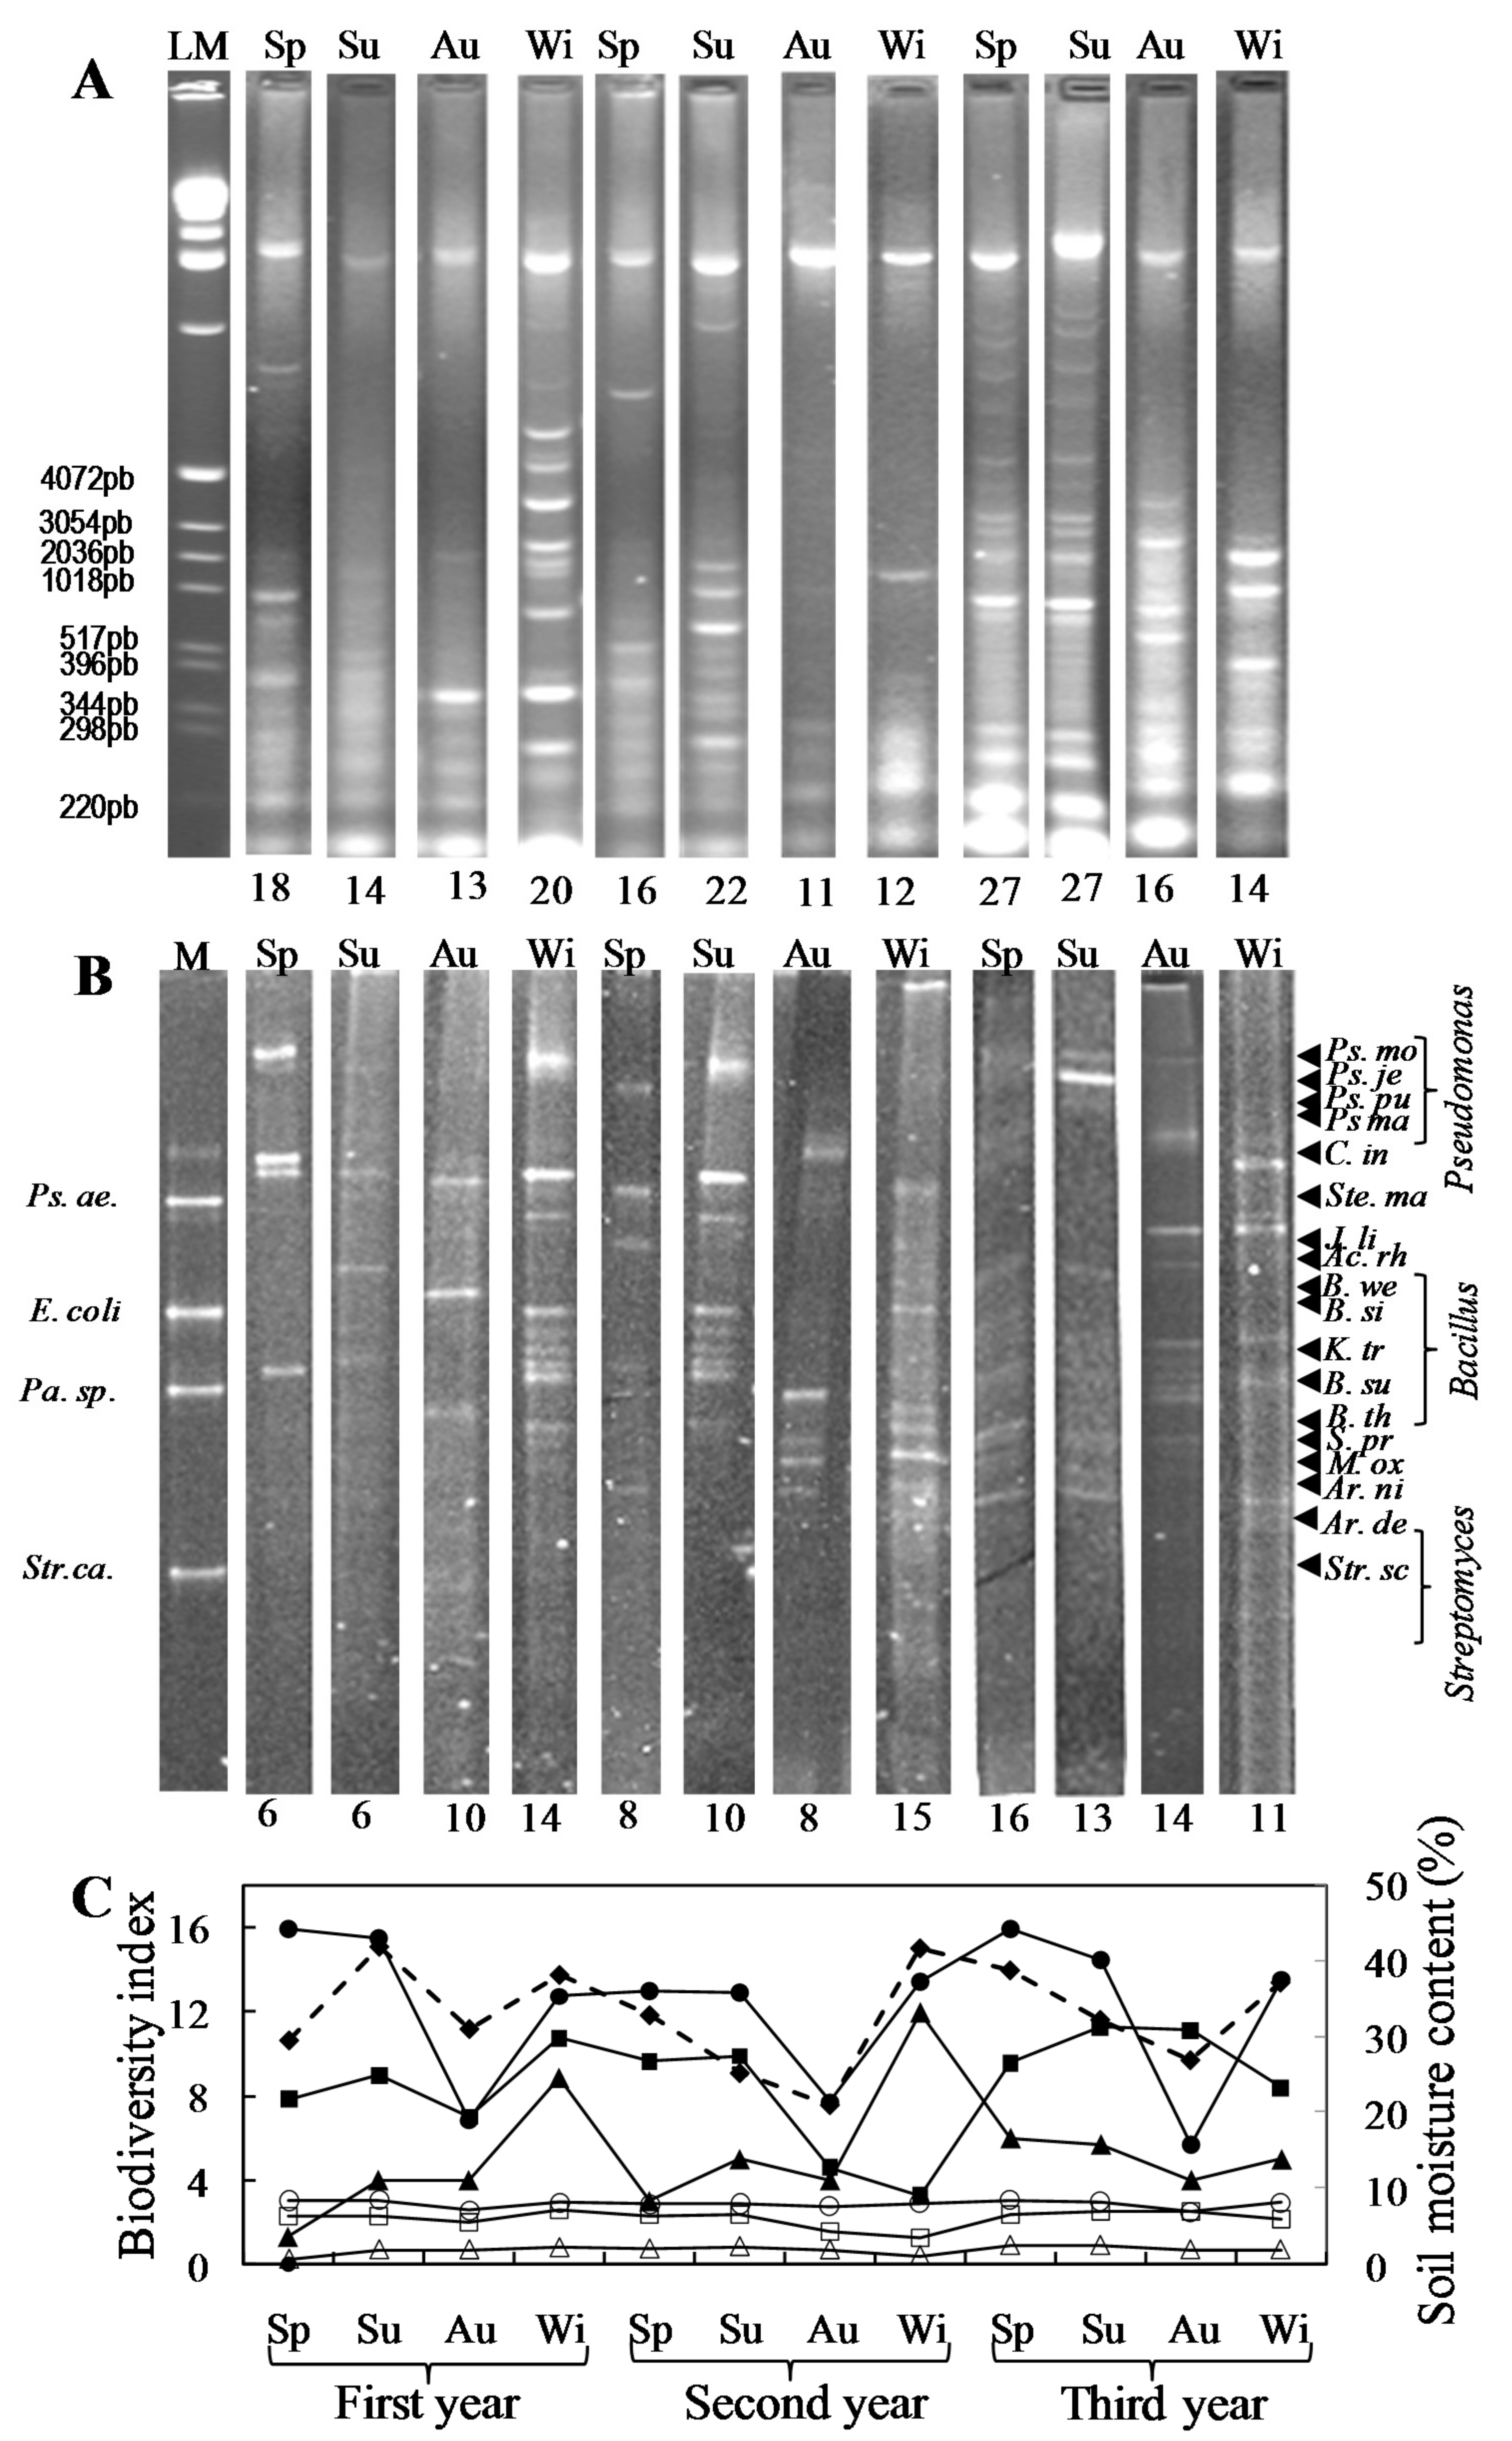
3.3. Seasonal Fluctuation and Interannual Stability of the Soil Microbial Community in a Long-Term No-Tillage Maize Crop

Significant seasonal fluctuation was observed for the total number of bacteria, molds, total microorganisms, and for the bacteria of most genera. However, for many bacterial genera there were no significant interannual differences for the same season (Table 1). The amounts of cultured bacteria, molds, and total microorganisms were usually lowest in the fall (after harvest), with the exception of total bacteria and total microorganisms of the second year, which were lower in the summer than in the fall. Also, the numbers of most of the species detected in the cultured bacteria generally showed the same trend of variation as the total of bacteria, molds, and total microorganisms, with the exception of Acinetobacter and Stenotrophomonas which showed the opposite behavior, increasing in the fall. D and H indices also decreased in the fall, coinciding with the decrease in soil moisture content (Table 1 and Figure 4C). However, the number of different species detected did not decrease in the fall (Table 1), although fewer bands were detected by soil PCR-agarose in the fall, while those detected by soil PCR-DGGE followed an irregular pattern (Figure 4A,B). The D and H indices of cultured bacteria and the soil PCR-agarose D index showed the expected seasonal fluctuations in accordance with the fall decrease in soil moisture content. Similar results were found for the D and H indices of total microorganisms including molds and yeasts (data not shown). The soil PCR-DGGE D index increased in the winter with the rise in soil moisture content, as did the biodiversity indices estimated by the other procedures, but it decreased in the spring in a trend unrelated to the maintenance of the soil moisture content. In general, the H index fluctuated less than the D index because it measures preferably the presence of rare species instead of the frequency of each species, as does the D index [58]. No correlation was found between biodiversity index (H or D) with the observed genera. Additionally, as identified before, the fluctuation in soil organic carbon, total nitrogen was not significant, thus it is not predictable to find correlations among the aforementioned parameter. In fact, soil organic carbon and total nitrogen remained constant throughout the three years (2.78 ± 0.18% and 0.12 ± 0.006% respectively), and the temperature fluctuated according to the season (spring = 13.68 ± 0.33 °C, summer = 22.23 ± 0.25 °C, fall = 18.38 ± 0.32 °C, and winter = 9.93 ± 0.44 °C). In general, Gram– bacteria were more abundant than Gram+, except in the summer when the Gram+ predominated mostly due to the relative increase of the spore-forming bacteria Streptomyces and Bacillus.

4. Discussion

The cultured bacterial community of the studied soil is simpler than other soil communities. For example, whereas we detected 18 genera and 43 species in our stony soil by plating onto eight different culture media, as many as 116 species have been found in a silt loam soil with greater organic carbon and moisture content [27]. Aslam et al. [59] found 27 and 38 genera in a subtropical soil managed under conventional and no-tillage practices, respectively. However, in a Mediterranean soil contaminated with copper, with organic carbon and nitrogen contents similar to the soil analyzed in our study, 16 genera and 32 species were recovered using culture-dependent methods [60], and another study described eight phylogenetic groups in an extremely low-moisture silt soil [61]. These differences could be due to the intrinsic properties of the different soils considered, and to the environmental conditions at each location, especially the climate. Also, given the general belief that only a small proportion of soil bacteria can be cultured in standard laboratory media [24], it is conceivable that we could be missing difficult-to-culture bacteria that can be detected by culture-independent procedures. However, more bacterium species were detected by culturing methods than by PCR-DGGE analyses. DGGE fingerprinting does not provide complete coverage of soil bacterial diversity, since only a limited number of bands can be resolved [62,63], and it has been suggested that PCR-DGGE reveals only the dominant components of the communities [64,65,66]. Also, some minor components could develop in culture media but still remain undetected through PCR-DGGE. It could be even possible that, under our experimental conditions, the proportion of dominant viable non-culturable soil bacteria was less than generally believed, and most dominant non-culturable bacteria are actually non-viable forms of the cultured ones.
The seasonal fluctuations of most bacterial genera, the total number of bacteria, molds, and total microorganisms were greater than the interannual fluctuations (Table 1). Coinciding with the decrease in soil moisture content, the amounts of cultured bacteria, molds, and total microorganisms were usually lowest in the fall; whereas the high summer temperature seems to increase the relative abundance of the Gram+ spore-forming bacteria Streptomyces and Bacillus. Similar results have been reported for a pasture soil, where microbial biomass was highest from April to August, and decreased during the fall to winter period [67]. Shi et al. [68] also found low values for most microbial properties in a maize-soybean rotation under dry weather conditions. Also, the proportion of most of the species detected among the cultured bacteria mostly varied with the same general trend. The exceptions of Acinetobacter and Stenotrophomonas which increased in the fall could be due to the increased oxygenation of the soil concomitant with the reduction in moisture content, or to the disappearance of rhizodepositions after harvest [69,70]. Such changes in environmental conditions could result in a relative increase in growth of Acinetobacter and Stenotrophomonas with respect to the rest of the bacteria, and so induce some suits in the bacterial communities, showing a dynamic bacterial succession in the studied soils. The other exception to the general pattern found in the analysis of the bacterial communities occurred during the second sampling year, when lower index values were observed in summer than in fall. According to Shi et al. [68], this could have been due to the warm weather conditions with high summer temperature reached that year (mean of 32.73 °C during the second-year vs. 30.27 °C and 31.55 °C for the first and third years, respectively) [68]. D and H indices also decreased in fall, coinciding with the decrease in soil moisture content (Table 1 and Figure 4C). While a similar number of bacterial species were detected throughout the year using culturing methods, culture-independent methods (PCR-DGGE) showed seasonal variations, indicating changes in the dominant members of the bacterial communities in the studied soils. The evenness of the cultured microorganisms, however, remained roughly constant throughout the three years, as also did the evenness estimated by soil PCR-agarose and PCR-DGGE (data not shown).
As individual technique, soil PCR-agarose, PCR-DGGE of cultured bacteria from SC, TSA, or PEP media, and morphological-type differentiation of SC colonies, detected the most bacterial species (this is assuming that each PCR-DNA band belonged to a different species). Also, the biodiversity estimated with these solo techniques was higher than with the other individual techniques (Table 3, Figure 2 and Figure 3). Of the three culture-dependent-technique combinations, SC/TSA/PEP for CD-PCR-DGGE, and AZO/YEPD/SC for morphological-type differentiation were the most successful, giving the highest values of species detected and of biodiversity estimated. Nonetheless, the other three-technique combinations also yielded high values, not far from the maximum achieved by considering all the species raised in the eight-culture media (Table 4 and Figure 3).
Although most diversity indices do not reflect the differences in species richness or species evenness [71], the cultured bacteria D and H indices, soil PCR-agarose D index, and cultured microorganisms (including molds and yeasts) D and H indices, all reflected the seasonal fluctuation of most species corresponding to the fall decrease in soil moisture content. The soil PCR-DGGE D index increased in the winter with the rise in soil moisture content, but, in contrast to the rest of the indices, it decreased in the spring in a trend unrelated to the maintenance of soil moisture content, probably due to a selection of a low number of the major bacterial components of the community. In general, since the H index did not reflect these fluctuations as strongly as did the D index, the latter may be better suited to analyze seasonal soil bacterial community fluctuations. This is because the D index measures the frequency of each species instead of the presence of rare species as does the H index (i.e., [58,72]).

5. Conclusions

Soils subjected to long-term agricultural practices that are aimed at minimizing the disruption of the soil's structure, composition and natural biodiversity in a Zea mays crops purport to be fairly persistent probably because its C/N contents were kept over the studied period. Because no soil overturning occurs, most of the cultured microbiological population fluctuations depended only on edaphoclimatic conditions and, in spite of the native fluctuations, the quantity of distinct microbiological life remained practically unaltered, demonstrating a dynamic behavior and recovering their maximum levels when the proper edaphoclimatic conditions were present again.
As stated by [73], common agricultural practices are responsible for shaping the microbial communities in the agro-ecosystem and, according to the study of [74] the agricultural ecosystem sustainability can be restored stimulating soil life. We conclude, then, like [75] and the United Nations Sustainable Development Goals (Convention on Biological Diversity) [76], which the bacterial communities present in the soil largely contribute to the soil’s sustainability.

Acknowledgments

This work was funded by grants 2PR01B002 and 2PR04B003 from the Extremadura Regional Government, Spain, and by grant AGL 2000-0463-P4-05 from the Spanish Ministry of Science and Technology. A. Muñoz thanks the local Government of Extremadura for her predoctoral studentship. Luis Loures thanks the support of his Postdoctoral supervisors at GORSAS (Research Group on Soils, Water and Sediments Management, Conservation and Recovery)—Universidad de Extremadura. The authors would like to thank also Juan González of the IRNAS (Sevilla, Spain) for critical readings of the manuscript.

Author Contributions

Manuel Ramírez, Ana Muñoz and Antonio López-Piñeiro designed the research and performed the analysis, Manuel Ramírez, Antonio López-Piñeiro, Luis Loures, José Nunes and José Gama analyzed the data; Ana Muñoz, Ángel Albarrán, David Peña and Luis Loures contributed with analysis tools and wrote the paper.

Conflicts of Interest

The authors declare no conflict of interest.

References

  1. Spedding, T.A.; Hamel, C.; Mehuys, G.R.; Madramootoo, C.A. Soil microbial dynamics in maize-growing soil under different tillage and residue management systems. Soil Biol. Biochem. 2004, 36, 499–512. [Google Scholar] [CrossRef]
  2. De Ploey, J.A.; Imeson, A.; Oldeman, L.R. Soil erosion, soil degradation and climatic change. In Land Use Changes in Europe; Brower, F.M., Thomas, A.J., Chadwick, M.J., Eds.; Kluwer Academic Publisher: London, UK, 1991; pp. 275–292. [Google Scholar]
  3. Bezdicek, D.F.; Beaver, T.; Granatstein, D. Subsoil ridge tillage and lime effects on soil microbial activity, soil pH, erosion, and wheat and pea yield in the Pacific Northwest, USA. Soil Tillage Res. 2003, 74, 55–63. [Google Scholar] [CrossRef]
  4. McDaniel, M.D.; Tiemann, L.K.; Grandy, A.S. Does agricultural crop diversity enhance soil microbial biomass and organic matter dynamics? A meta-analysis. Ecol. Appl. 2014, 24, 560–570. [Google Scholar] [CrossRef] [PubMed]
  5. Kennedy, A.C.; Smith, K.L. Soil microbial diversity and the sustainability of agricultural soils. In The Significance and Regulation of Soil Biodiversity; Springer: Dordrecht, The Netherlands, 1995; pp. 75–86. [Google Scholar]
  6. López-Garrido, R.; Madejón, E.; Moreno, F.; Murillo, J.M. Conservation tillage influence on carbon dynamics under Mediterranean conditions. Pedosphere 2014, 24, 65–75. [Google Scholar] [CrossRef]
  7. Helgason, B.L.; Walley, F.L.; Germida, J.J. Long-term no-till management affects microbial biomass but not community composition in Canadian prairie agroecosytems. Soil Biol. Biochem. 2010, 42, 2192–2202. [Google Scholar] [CrossRef]
  8. Guo, L.J.; Zhang, Z.S.; Wang, D.D.; Li, C.F.; Cao, C.G. Effects of short-term conservation management practices on soil organic carbon fractions and microbial community composition under a rice-wheat rotation system. Biol. Fertil. Soils 2015, 51, 65–75. [Google Scholar] [CrossRef]
  9. Lupwayi, N.Z.; Rice, W.A.; Clayton, G.W. Soil microbial diversity and community structure under wheat as influenced by tillage and crop rotation. Soil Biol. Biochem. 1998, 30, 1733–1741. [Google Scholar] [CrossRef]
  10. Emmerling, C.; Udelhoven, T.; Schroder, D. Response of soil microbial biomass and activity to agricultural de-intensification over a 10 year period. Soil Biol. Biochem. 2001, 33, 2105–2114. [Google Scholar] [CrossRef]
  11. Muñoz, A.; López-Piñeiro, A.; Ramírez, M. Soil quality attributes of conservation management regimes in a semi-arid region of south western Spain. Soil Tillage Res. 2007, 95, 255–265. [Google Scholar] [CrossRef]
  12. Powlson, D.S.; Brookes, P.C.; Christensen, B.T. Measurement of soil microbial biomass provides an early indication of changes in total soil organic matter due to straw incorporation. Soil Biol. Biochem. 1987, 19, 159–164. [Google Scholar] [CrossRef]
  13. Sparling, G.P. Soil microbial biomass activity and nutrient cycling an indicator of soil health. In Biological Indicators of Soil Health; Pankhurst, C., Doube, B.M., Gupta, V.V.S.R., Eds.; CAB International: Wallingford, UK, 1997; pp. 97–119. [Google Scholar]
  14. Franzluebbers, A.J.; Langdale, G.W.; Schomberg, H.H. Soil carbon, nitrogen, and aggregation in response to type and frequency of tillage. Soil Sci. Soc. Am. J. 1999, 63, 349–355. [Google Scholar] [CrossRef]
  15. Avidano, L.; Gamalero, E.; Cossa, G.P.; Carraro, E. Characterization of soil health in an Italian polluted site by using microorganisms as bioindicators. Appl. Soil Ecol. 2005, 30, 21–33. [Google Scholar] [CrossRef]
  16. Tate, R.L. Soil Microbiology; John Wiley and Sons: New York, NY, USA, 2000; p. 508. [Google Scholar]
  17. Nielsen, M.N.; Winding, A. Microorganisms as Indicators of Soil Health; Ministry of Environment Technical Report No. 388; National Environmental Research Institute: Aarhus, Denmark, 2002. [Google Scholar]
  18. Mangalassery, S.; Mooney, S.J.; Sparkes, D.L.; Fraser, W.T.; Sjögersten, S. Impacts of zero tillage on soil enzyme activities, microbial characteristics and organic matter functional chemistry in temperate soils. Eur. J. Soil Biol. 2015, 68, 9–17. [Google Scholar] [CrossRef]
  19. Bell, C.; Holder-Franklin, M.; Franklin, M. Seasonal fluctuations in river bacteria as measured by multivariate statistical analysis of continuous cultures. Can. J. Microbiol. 1982, 28, 959–975. [Google Scholar] [CrossRef] [PubMed]
  20. Bloem, J.; Lebbink, G.; Zwart, K.B.; Bouwman, L.A.; Burgers, S.L.G.E.; de Vos, J.A.; de Ruiter, P.C. Dynamics of microorganisms, microbivores and nitrogen mineralisation in winter wheat fields under conventional and integrated management. Agric. Ecosyst. Environ. 1994, 51, 129–143. [Google Scholar] [CrossRef]
  21. Zogg, G.P.; Zak, D.R.; Ringelberg, D.B.; White, D.C.; MacDonald, N.W.; Pregitzer, K.S. Compositional and functional shifts in microbial communities due to soil warming. Soil Sci. Soc. Am. J. 1997, 61, 475–481. [Google Scholar] [CrossRef]
  22. Bossio, D.; Scow, K.; Gunapala, N.; Graham, K. Determinants of soil microbial communities: Effects of agricultural management, season, and soil type on phospholipid fatty acid profiles. Microb. Ecol. 1998, 36, 1–12. [Google Scholar] [CrossRef] [PubMed]
  23. Frenk, S.; Dag, A.; Yermiyahu, U.; Zipori, I.; Hadar, Y.; Minz, D. Seasonal effect and anthropogenic impact on the composition of the active bacterial community in Mediterranean orchard soil. FEMS Microbiol. Ecol. 2015, 91, fiv096. [Google Scholar] [CrossRef] [PubMed]
  24. Janssen, P.H.; Yates, P.S.; Grinton, B.E.; Taylor, P.M.; Sait, M. Improved culturability of soil bacteria and isolation in pure culture of novel members of the divisions Acidobacteria, Actinobacteria, Proteobacteria, and Verrucomicrobia. Appl. Environ. Microb. 2002, 68, 2391–2396. [Google Scholar] [CrossRef]
  25. Hugenholtz, P.; Goebel, B.M.; Pace, N.R. Impact of culture-Independent studies on the emerging phylogenetic view of bacterial diversity. J. Bacteriol. 1998, 180, 4765–4774. [Google Scholar] [PubMed]
  26. Ellis, R.J.; Morgan, P.; Weightman, A.J.; Fry, J.C. Cultivation-dependent and -independent approaches for determining bacterial diversity in heavy-metal-contaminated soil. Appl. Environ. Microb. 2003, 69, 3223–3230. [Google Scholar] [CrossRef]
  27. Edenborn, S.L.; Sexstone, A.J. DGGE fingerprinting of culturable soil bacterial communities complements culture-independent analyses. Soil Biol. Biochem. 2007, 39, 1570–1579. [Google Scholar] [CrossRef]
  28. Al-Awadhi, H.; Dashti, N.; Khanafer, M.; Al-Mailem, D.; Ali, N.; Radwan, S. Bias problems in culture-independent analysis of environmental bacterial communities: A representative study on hydrocarbonoclastic bacteria. SpringerPlus 2013, 2, 1–11. [Google Scholar] [CrossRef] [PubMed]
  29. Bent, S.J.; Pierson, J.D.; Forney, L.J.; Danovaro, R.; Luna, G.M.; Dell’Anno, A.; Pietrangeli, B. Measuring species richness based on microbial community fingerprints: The emperor has no clothes. Appl. Environ. Microb. 2007, 73, 2399–2401. [Google Scholar] [CrossRef] [PubMed]
  30. Danovaro, R.; Luna, G.M.; Dell’Anno, A.; Pietrangeli, B. Comparison of two fingerprinting techniques, terminal restriction fragment length polymorphism and automated ribosomal intergenic spacer analysis, for determination of bacterial diversity in aquatic environments. Appl. Environ. Microb. 2006, 72, 5982–5989. [Google Scholar] [CrossRef] [PubMed]
  31. Douterelo, I.; Boxall, J.B.; Deines, P.; Sekar, R.; Fish, K.E.; Biggs, C.A. Methodological approaches for studying the microbial ecology of drinking water distribution systems. Water Res. 2014, 65, 134–156. [Google Scholar] [CrossRef] [PubMed]
  32. Barns, S.M.; Takala, S.L.; Kuske, C.R. Wide distribution and diversity of members of the bacterial kingdom Acidobacterium in the environment. Appl. Environ. Microb. 1999, 65, 1731–1737. [Google Scholar]
  33. Smit, E.; Leeflang, P.; Gommans, S.; Van den Broek, J.; Van Mil, S.; Wernars, K. Diversity and seasonal fluctuations of the dominant members of the bacterial soil community in a wheat field as determined by cultivation and molecular methods. Appl. Environ. Microb. 2001, 67, 2284–2291. [Google Scholar] [CrossRef] [PubMed]
  34. Lipson, D.A.; Schmidt, S.K. Seasonal changes in an alpine soil bacterial community in the Colorado Rocky Mountains. Appl. Environ. Microb. 2004, 70, 2867–2879. [Google Scholar] [CrossRef]
  35. Ibekwe, A.M.; Papiernik, S.K.; Gan, J.; Yates, S.R.; Yang, C.H.; Crowley, D.E. Impact of fumigants on soil microbial communities. Appl. Environ. Microb. 2001, 67, 3245–3257. [Google Scholar] [CrossRef] [PubMed]
  36. Kisand, V.; Wikner, J. Combining culture-dependent and -independent methodologies for estimation of richness of estuarine bacterioplankton consuming riverine dissolved organic matter. Appl. Environ. Microb. 2003, 69, 3607–3616. [Google Scholar] [CrossRef]
  37. Liu, B.; Tu, C.; Hu, S.; Gumpertz, M.; Ristaino, J.B. Effect of organic, sustainable, and conventional management strategies in grower fields on soil physical, chemical, and biological factors and the incidence of Southern blight. Appl. Soil Ecol. 2007, 37, 202–214. [Google Scholar] [CrossRef]
  38. ISSS-ISRIC-FAO (Food and Agriculture Organization of the United Nations). World Reference Base for Soil Resources; Draft; Spaargaren, O., Ed.; FAO: Wageningen, The Netherlands; Rome, Italy, 1994. [Google Scholar]
  39. United Nations Environment Programme (UNEP). World Map of Desertification, 2nd ed.; Arnold: London, UK, 1997. [Google Scholar]
  40. Nelson, D.; Sommers, L. Total C, organic C and organic matter. In Methods of Soil Analysis. Soil Science Society of America Book Series No 5, Part 3—Chemical Methods; Sparks, D.L., Page, A.L., Helmke, P.A., Loeppert, R.H., Soltanpour, P.N., Tabatabai, M.A., Johnston, C.T., Summer, M.E., Eds.; America Society of Agronomy–Soil Science Society of America Publisher: Madison, WI, USA, 1996. [Google Scholar]
  41. Bremner, J.; Mulvaney, C. Nitrogen-Total. In Methods of Soil Analysis. Part 2. Chemical and Microbiological Properties, Agronomy Monograph; ASA Publisher: Madison, WI, USA, 1982; pp. 595–624. [Google Scholar]
  42. Hurst, C.J.; Crawford, R.L.; Knudsen, G.R.; McInerney, M.J. Manual of Environmental Microbiology, 2nd ed.; ASM Press: Washington, DC, USA, 2002. [Google Scholar]
  43. Vieira, F.C.S.; Nahas, E. Comparison of microbial numbers in soils by using various culture media and temperatures. Microbiol. Res. 2005, 160, 197–202. [Google Scholar] [CrossRef] [PubMed]
  44. Ottow, J.C.; Glathe, H. Rose bengal-malt extract-agar, a simple medium for the simultaneous isolation and enumeration of fungi and actinomycetes from soil. Appl. Microbiol. 1968, 16, 170–171. [Google Scholar] [PubMed]
  45. Van Schothorst, M.; Renaud, M. Malachite green pre-enrichment medium for improved Salmonella isolation from heavily contaminated samples. J. Appl. Bacteriol. 1985, 59, 223–230. [Google Scholar] [CrossRef] [PubMed]
  46. Lane, D.J. 16S/23S rRNA sequencing. In Nucleic Acid Techniques in Bacterial Systematics; Goodfellow, E.S.M., Stackebrant, E., Eds.; John Wiley & Sons Ltd.: London, UK, 1991; pp. 115–175. [Google Scholar]
  47. González, J.M.; Saiz-Jimenez, C. Microbial diversity in biodeteriorated monuments as studied by denaturing gradient gel electrophoresis. J. Sep. Sci. 2004, 27, 174–180. [Google Scholar] [CrossRef] [PubMed]
  48. Altschul, S.F.; Gish, W.; Miller, W.; Myers, E.W.; Lipman, D.J. Basic local alignment search tool. J. Mol. Biol. 1990, 215, 403–410. [Google Scholar] [CrossRef]
  49. Weisburg, W.G.; Barns, S.M.; Pelletier, D.A.; Lane, D.J. 16S ribosomal DNA amplification for phylogenetic study. J. Bacteriol. 1991, 173, 697–703. [Google Scholar] [CrossRef] [PubMed]
  50. Muyzer, G.; de Waal, E.C.; Uitterlinden, A.G. Profiling of complex microbial populations by denaturing gradient gel electrophoresis analysis of polymerase chain reaction-amplified genes coding for 16S rRNA. Appl. Environ. Microb. 1993, 59, 695–700. [Google Scholar]
  51. Shannon, C.E.; Weaver, W. The Mathematical Theory of Communication; The University of Illinois Press: Urbana, IL, USA, 1949. [Google Scholar]
  52. Pielou, E. The measurement of diversity in different types of biological collections. J. Theor. Biol. 1966, 13, 131–144. [Google Scholar] [CrossRef]
  53. Simpson, E.H. Measurement of diversity. Nature 1949, 166, 688. [Google Scholar] [CrossRef]
  54. Drijber, R.A.; Doran, J.W.; Parkhurst, A.M.; Lyon, D.J. Changes in soil microbial community structure with tillage under long-term wheat-fallow management. Soil Biol. Biochem. 2000, 32, 1419–1430. [Google Scholar] [CrossRef]
  55. Yao, H.; He, Z.; Wilson, M.J.; Campbell, C.D. Microbial biomass and community structure in a sequence of soils with increasing fertility and changing land use. Microb. Ecol. 2000, 40, 223–237. [Google Scholar] [PubMed]
  56. Muñoz, A.; López-Piñeiro, A.; Regodón, J.A.; Ramírez, M. Determination of soil microbial community fluctuations by different techniques in a maize field. In Microorganisms in Industry and Environment, Proceedings of the III International Conference on Environmental, Industrial and Applied Microbiology, Lisbon, Portugal, 2–4 December 2009; Mendez-Vilas, A., Ed.; World Scientific Publishing: Singapore, 2010; pp. 31–35. [Google Scholar]
  57. More, M.I.; Herrick, J.B.; Silva, M.C.; Ghiorse, W.C.; Madsen, E.L. Quantitative cell lysis of indigenous microorganisms and rapid extraction of microbial DNA from sediment. Appl. Environ. Microb. 1994, 60, 1572–1580. [Google Scholar]
  58. Lewis, C.; Swindel, B.; Tanner, G. Species diversity and diversity profiles: Concept, measurement, and application to timber and range management. J. Range Manag. 1988, 41, 466–469. [Google Scholar] [CrossRef]
  59. Aslam, Z.; Yasir, M.; Yoon, H.S.; Jeon, C.O.; Chung, Y.R. Diversity of the bacterial community in the rice rhizosphere managed under conventional and no-tillage practices. J. Microbiol. 2013, 51, 747–756. [Google Scholar] [CrossRef] [PubMed]
  60. Dell’Amico, E.; Mazzocchi, M.; Cavalca, L.; Allievi, L.; Andreoni, V. Assessment of bacterial community structure in a long-term copper-polluted ex-vineyard soil. Microbiol. Res. 2008, 163, 671–683. [Google Scholar] [CrossRef] [PubMed]
  61. Lester, E.D.; Satomi, M.; Ponce, A. Microflora of extreme arid Atacama desert soils. Soil Biol. Biochem. 2007, 39, 704–708. [Google Scholar] [CrossRef]
  62. Muyzer, G.; Smalla, K. Application of denaturing gradient gel electrophoresis (DGGE) and temperature gradient gel electrophoresis (TGGE) in microbial ecology. Antonie Leeuwenhoek 1998, 73, 127–141. [Google Scholar] [CrossRef] [PubMed]
  63. Nikolausz, M.; Sipos, R.; Révész, S.; Székely, A.; Márialigeti, K. Observation of bias associated with re-amplification of DNA isolated from denaturing gradient gels. FEMS Microbiol. Lett. 2005, 244, 385–390. [Google Scholar] [CrossRef] [PubMed]
  64. Heuer, H.; Wieland, G.; Schönfeld, J.; Schönwälder, A.; Gomes, N.C.M.; Smalla, K. Bacterial community profiling using DGGE or TGGE analysis. In Environmental Molecular Microbiology: Protocols and Applications; Rouchelle, P., Ed.; Horizon Scientific Press: Wymondham, UK, 2001; pp. 177–190. [Google Scholar]
  65. Mele, P.M.; Crowley, D.E. Application of self-organizing maps for assessing soil biological quality. Agric. Ecosyst. Environ. 2008, 126, 139–152. [Google Scholar] [CrossRef]
  66. Xiong, W.; Xie, P.; Wang, S.; Niu, Y.; Yang, X.; Chen, W. Sources of organic matter affect depth-related microbial community composition in sediments of Lake Erhai, Southwest China. J. Limnol. 2015, 74, 310–323. [Google Scholar] [CrossRef]
  67. Murata, T.; Tanaka, H.; Yasue, S.; Hamada, R.; Sakagami, K.; Kurokawa, Y. Seasonal variations in soil microbial biomass content and soil neutral sugar composition in grassland in the Japanese temperate zone. Appl. Soil Ecol 1999, 11, 253–259. [Google Scholar] [CrossRef]
  68. Shi, Y.; Lalande, R.; Hamel, C.; Ziadi, N.; Gagnon, B.; Hu, Z. Seasonal variation of microbial biomass, activity, and community structure in soil under different tillage and phosphorus management practices. Biol. Fert. Soils 2013, 49, 803–818. [Google Scholar] [CrossRef]
  69. Lynch, J.M.; Whipps, J.M. Substrate flow in the rhizosphere. Plant Soil 1990, 129, 1–10. [Google Scholar] [CrossRef]
  70. Butler, J.L.; Bottomley, P.J.; Griffith, S.M.; Myrold, D.D. Distribution and turnover of recently fixed photosynthate in ryegrass rhizospheres. Soil Biol. Biochem. 2004, 36, 371–382. [Google Scholar] [CrossRef]
  71. Gotelli, N.; Colwell, R. Quantifying biodiversity: Procedures and pitfalls in the measurement and comparison of species richness. Ecol. Lett. 2001, 4, 379–391. [Google Scholar] [CrossRef]
  72. Hill, T.C.J.; Walsh, K.A.; Harris, J.A.; Moffett, B.F. Using ecological diversity measures with bacterial communities. FEMS Microbiol. Ecol. 2003, 43, 1–11. [Google Scholar] [CrossRef] [PubMed]
  73. Embarcadero-Jiménez, S.; Flor, N.R.-O.; Wang, E.T. Bacterial communities estimated by pyrosequencing in the soils of chinampa, a traditional sustainable agro-ecosystem in Mexico. J. Soils Sediments 2016, 16, 1001–1011. [Google Scholar] [CrossRef]
  74. Bender, S.F.; Wagg, C.; van der Heijden, M.G. An underground revolution: Biodiversity and soil ecological engineering for agricultural sustainability. Trends Ecol. Evol. 2016, 31, 440–452. [Google Scholar] [CrossRef] [PubMed]
  75. Keesstra, S.D.; Bouma, J.; Wallinga, J.; Tittonell, P.; Smith, P.; Cerda, A.; Montanarella, L.; Quinton, J.N.; Pachepsky, Y.; van der Putten, W.H.; et al. The significance of soils and soil science towards realization of the United Nations Sustainable Development Goals. Soil 2016, 2, 111. [Google Scholar] [CrossRef]
  76. Wolff, F.; Timo, K. The UN Convention on biological diversity and soils: Status and future options. In International Yearbook of Soil Law and Policy 2016; Springer: Cham, Switzerland, 2017; pp. 129–148. [Google Scholar]
Figure 1. Different morphological typologies and corresponding species of bacterial colonies rose in TSA, SC, YEPD, and AZO media seeded with the soil sample of fall of the third year. Ps, Pseudomonas. S, Serratia. P, Paenibacillus. B, Bacillus. C, Chryseobacterium. Ste, Stenotrophomonas. J, Janthinobacterium. K, Klebsiella. Mi, Micromonospora. R, Rhodococcus. Sta, Staphylococcus Ac, Acinetobacter. Pa, Pantoea. M, Microbacterium. Ar, Arthrobacter. Str, Streptomyces. Bu, Burkholderia. Modified from Muñoz et al., 2010 [56].
Sustainability 09 00778 g001
Figure 2. PCR-agarose of bacterial DNA from the soil sample of fall of the third year. LM, 1 kb DNA ladder. Soil, DNA from soil. TSA and SC, DNA from cultured bacteria raised in TSA and SD media respectively. D, Simpson dominance index. H, Shannon general diversity index. E, evenness index. Nº DB, number of different bands. Nº UB, number of unique bands.
Sustainability 09 00778 g002
Figure 3. PCR-DGGE and density traces of bacterial DNA from the soil sample of fall of the third year. M, migration markers (Ps. ae., Pseudomonas aeruginosa; E. coli, Escherichia coli; Pa. sp., Paenibacillus sp.; Str. ca., Streptomyces caviscabies). Soil, DNA from soil. SC, TSA and PEP, DNA from cultured bacteria raised in SC, TSA and PEP media respectively. ○, Gram−. ●, Gram+. Streptomyces, migration zone of the PCR fragments of Streptomyces; Bacillus, zone of Bacillus; and Pseudomonas, zone of Pseudomonas. *, density peaks detected by Quantity software. D, Simpson dominance index. H, Shannon general diversity index. E, evenness index. Nº DB, number of different bands. Nº UB, number of unique bands. Ps, Pseudomonas. C, Chryseobacterium. Ste, Stenotrophomonas. J, Janthinobacterium. Ac, Acinetobacter. B, Bacillus. K, Klebsiella. S, Serratia. M, Microbacterium. Ar, Arthrobacter. Str, Streptomyces. Modified from Muñoz et al., 2010 [56].
Sustainability 09 00778 g003
Figure 4. Fluctuation of the bacterial soil community in the maize field as determined by soil PCR-agarose (A), soil PCR-DGGE (B), and de visu identification of bacteria cultured in eight different media (C). Sp, spring. Su, summer. Au, fall. Wi, winter. The number of different bands detected is given at the bottom of each electrophoresis line. (A): LM, DNA molecular markers (1 kb ladder). (B): M, migration markers (Ps. Ae., Pseudomonas aeruginosa; E. coli, Echerichia coli; Pa. sp., Paenibacillus sp.; Str. ca., Streptomyces caviscabies). (C): ●, D index of cultured bacteria. ○, H index of cultured bacteria. ▲, D index of soil PCR-DGGE bands. △, H index of soil PCR-DGGE bands. ■, D index of soil PCR-agarose bands. □, H index of soil PCR-agarose bands. ♦ Percentage of soil moisture content. Modified from Muñoz et al., 2010 [56].
Sustainability 09 00778 g004
Table 1. Fluctuation of the different cultured-microorganisms of the soil microbial community of the maize crop during three years. Modified from Muñoz et al., 2010 [56].
Genus/Type of MicroorganismFirst YearSecond YearThird YearAverage
SpSuAuWiSpSuAuWiSpSuAuWi
Azotobacter (1) ○0.3aA0.6bA0.3aB0.4aA0.3abA0.5cA0.2aA0.5bcA0.3aA0.8cA0.3aAB0.5bA0.4
Acinetobacter (2) ○1.3aA9.1bB11.2bB18.2cA1.8aA9.2bB13.3cB19.5dA4.1abB1.2aA7.2bA15.6cA9.3
Burkholderia (1) ○11.7bA5.1aA4.2aB5.3aB10.6cA8.8bB5.8aB7.2bB12.2cA5.8bA2.9aA2.6aA6.9
Chryseobacterium (1) ○2.6cB1.5bA0.7aA1.6bB2.0bB7.2cB0.8aA2.2bC1.0bA0.2aA0.9bA0.8bA1.8
Janthinobacterium (1) ○0.0aA0.0aA0.0aA0.2bA0.0aA0.0aA0.0aA0.3A0.0aA0.0aA0.0aA0.2bA0.1
Klebsiella (1) ○0.2bA0.0aA0.0aA0.0aA0.3abA0.0aA1.1bB1.4bB0.6bA0.4bB0.0aA0.0aA0.3
Pantoea (1) ○1.6cB0.7bA0.3aA0.7bB0.9aA3.2bB0.5aA1.0aB1.4bB0.1aA0.4aA0.3aA0.9
Pseudomonas (9) ○40.1cB21.6bA12.7aA19.5bB30.0cA16.1aA21.3bB12.0aA42.4bB27.6aA20.0aB24.4aB24.0
Serratia (1) ○1.7bB0.9bA0.1aA0.4abA0.1aA0.4cA0.5cA0.1bA0.1aA0.3abA0.1aA0.6bA0.4
Stenotrophomonas (1) ○6.3bA2.7aB32.9dA16.5cA5.9aA2.4aB32.3cA12.9bA6.4bA1.7aA38.9dA13.9cA14.4
Arthrobacter (2) ●7.3aA18.9bA18.4bB9.0aA22.6cB17.0bA6.5aA11.9abB6.6aA21.3bA7.3aA11.1aB13.2
Bacillus (6) ●8.9aA15.9bA12.9bB8.4aA11.6bA11.9bA7.5aA16.4cB9.1aA18.0cA10.0aA12.7bB11.9
Microbacterium (1) ●0.0aA0.0aA0.0aA0.0aA0.0aA0.0aA0.0aA0.0aA0.2bB0.0aA0.0aA0.0aA0.0
Micromonospora (1) ●0.4bA0.6cA0.3aA0.7cA0.8aB2.9bB0.7aA0.9aA0.4bA0.1aA0.4bA0.3bA0.7
Paenibacillus (1) ●4.7cA2.0bA0.9aA2.1bA4.7bA2.6aA2.3aB2.9aA4.3cA2.3bA1.2aA2.0bA2.7
Rhodococcus (1) ●1.3abB2.0cB1.0aA1.5abB0.4aA0.0aA1.8bA0.0aA0.6aA2.4cB1.6bA1.1abB1.1
Staphylococcus (1) ●0.0aA0.0aA0.1bA0.4cA0.0aA0.0aA0.4bA0.2bA0.0aA0.0aA0.0aA0.2bA0.1
Streptomyces (11) ●11.7bA18.5cA3.7aA14.6bA7.9aA16.7cA5.3aA10.3bA10.4aA18.6cA9.1aB13.0abA11.7
Gram+ bacteria34.357.937.336.74851.124.542.631.662.729.640.441.4
Gram− bacteria65.842.262.462.851.947.875.857.168.538.170.758.958.5
Nº bacteria b30.423.3616.924.837.722.432.037.130.335.829.730.629.3
Nº yeasts a0.00.00.00.00.30.10.00.00.00.00.00.20.1
Nº moulds b3.863.812.592.862.663.162.494.373.13B3.662.02.913.1
Nº microorganisms b34.327.119.527.730.425.534.541.533.439.531.733.531.6
Nº DB33323433352934333733303333
D15.915.56.912.713.012.97.713.415.914.55.713.512.3
H3.03.02.52.92.92.92.82.93.13.02.53.02.9
E0.80.80.70.80.80.80.70.80.80.80.70.80.8
Annual D16.216.016.2
Annual H3.13.03.0
Annual E0.80.80.8
Data for Gram+, Gram−, and each bacterium genus corresponds to the percentages of colonies relative to the number of colony forming units (CFU) for each soil sample. Data for the other types of microorganisms are CFU counts for each soil sample. a, CFU/g dry soil × 106. b, CFU/g dry soil × 107. The number of different species detected for each bacterium genus is stated at the side in parentheses. Sp, spring. Su, summer. Au, fall. Wi, winter, ○: Gram−. ●: Gram+. D, Simpson dominance index. H, Shannon general diversity index. E, evenness index. Nº. DB, number of different bacterium species. ANOVAs and Duncan’s tests: Data in the same row followed by the same small letter are not significantly different in the same year at p < 0.05 level. Data in the same row followed by the same capital letter are not significantly different in the same season at the p < 0.05 level.
Table 2. Comparison of detected cultured bacteria according to their morphological features and their 16S rRNA gene sequence or PCR-DGGE, and the error of the discrimination from morphological assignments.
MicroorganismNº of Colonies AnalysedError (%)
sd
Acinetobacter haemolyticus230
Acinetobacter rhizosphaerae140
Arthrobacter dextranolyticus240
Arthrobacter nicotinovorans540
Bacillus simplex1712.5
Bacillus subtilis530
Bacillus thuringiensis1614.3
Bacillus weihenstephanensis140
Chryseobacterium indologenes140
Janthinobacterium lividum150
Klebsiella trevisanii140
Microbacterium oxydans140
Pseudomonas jessenii2612.5
Pseudomonas mediterranea330
Pseudomonas mosselii230
Pseudomonas poae140
Pseudomonas putida430
Rhodococcus corynebacterioides1628.6
Serratia proteamaculans150
Stenotrophomonas maltophilia2514.3
Streptomyces scabrisporus150
Streptomyces violaceorubidus200
Streptomyces flavovirens200
Streptomyces xanthophaeus200
Streptomyces ciscaucasicus200
Streptomyces griseoaurantiacus200
Streptomyces drozdowiczii200
Streptomyces violascens200
Streptomyces virginiae200
Streptomyces carpaticus200
Total accumulated error4.02
s: number of colonies validated by DNA sequencing. d: number of colonies validated by PCR-DGGE.
Table 3. Different cultured-bacteria genera detected in the soil sample of fall during the third year of sampling by using eight culture media.
GenusCulture Media
TSASCYEPDAZOMGMEPEPBRMean
Arthrobacter (2) ●8.69.95.45.70.010.64.48.36.6
Bacillus (6) ●11.22.011.220.80.011.47.111.19.3
Microbacterium (1) ●0.00.00.00.00.00.00.00.00.0
Micromonospora (1) ●0.50.00.40.00.00.01.10.00.3
Paenibacillus (1) ●1.10.02.71.90.00.81.12.81.3
Rhodococcus (1) ●2.13.90.01.90.01.61.12.81.7
Staphylococcus (1) ●0.00.00.00.00.00.00.00.00.0
Streptomyces (11) ●4.344.71.90.00.01.62.711.18.3
Acinetobacter (2) ○7.020.45.45.70.01.66.00.05.8
Azotobacter (1) ○0.00.00.05.70.00.00.00.00.7
Burkholderia (1) ○3.20.01.222.60.03.32.20.04.1
Chryseobacterium (1) ○0.00.03.50.00.00.00.00.00.4
Janthinobacterium (1) ○0.00.00.00.00.00.00.00.00.0
Klebsiella (1) ○0.00.00.00.00.00.00.00.00.0
Pantoea (1) ○0.50.00.80.00.00.00.50.00.2
Pseudomonas (9) ○17.17.223.215.110018.723.141.730.8
Serratia (1) ○0.00.00.40.00.00.00.00.00.0
Stenotrophomonas (1) ○44.411.844.020.80.050.450.522.230.5
Total
D9.5710.29.414.611.349.329.374.4212.53
H2.362.822.261.480.832.242.181.362.98
E0.740.880.730.770.860.760.780.770.91
Nº DB192718921517636
Nº UB01124000017
Data for each bacterium genera are the percentage of colonies relative to the total colony number raised in culture media (mean of three repetitions for each soil sample). ○: Gram−. ●: Gram+. D, Simpson index of dominance. H, Shannon index of general diversity. E, evenness index. Nº DB, number of different bacteria. Nº UB, number of unique bacteria.
Table 4. Analysis of cultured bacteria from fall sampling during the third year by using different culture media combinations.
VariableCulture Media Combination
TSA/SC/YEPDAZO/YEPD/SCAZO/PEP/SCTSA/SC/AZOTSA/SC/PEP
D11.612.211.712.011.4
H2.612.722.542.672.49
E0.800.810.800.810.78
Nº DB3236333430
Nº UB1317151511
D, Simpson index of dominance. H, Shannon index of general diversity. E, evenness index. Nº DB, number of different bacteria. Nº UB, number of unique bacteria.

