
Non-Homogeneous Diffusion of Residential Crime in Urban China
by
 ,
,
Yicheng Tang
1, 
Xinyan Zhu
1,
Wei Guo
1,*,
Xinyue Ye
2,*,
Tao Hu
1,
Yaxin Fan
1 and
Faming Zhang
1 1
State Key Lab of Information Engineering in Surveying Mapping and Remote Sensing & Collaborative Innovation Center of Geospatial Technology, Wuhan University, Wuhan 430079, China
2
Department of Geography, Kent State University, Kent, OH 42240, USA
*
Authors to whom correspondence should be addressed.
Sustainability 2017, 9(6), 934; https://0-doi-org.brum.beds.ac.uk/10.3390/su9060934
Submission received: 30 April 2017
/
Revised: 27 May 2017
/
Accepted: 27 May 2017
/
Published: 2 June 2017
Abstract
:The relationship between crime and urban environment has always been the focus of crime geography. Like diseases which can transmit and diffuse, crimes may also spread during a certain period of time and to a certain area by the near-repeat effect. Traditional near-repeat analysis focuses on the spatial spread of crimes to adjacent areas, with little regard to the displacement effect. Crime displacement refers to the relocation of criminal events as a result of policing efforts. If this phenomenon is neglected, the near-repeat analysis will tend not to obtain the overall spatial distribution pattern of criminal cases, leading to limited effectiveness of crime control. This paper presents a non-homogeneous diffusion model where crime spreads not only to spatially and temporally adjacent areas, but also to areas with similar environmental characteristics. By virtue of spatial constraints and environmental characteristics, the most vulnerable areas are identified, and this will be helpful for developing policing strategy as well as for sustainable community development.
1. Introduction
The detection of hot spots is a starting point to policy-relevant understanding of crime and to making predictions about potential crimes. In fact, crime hot spots are often generated based on the discrete data of the criminal events. Once the police launch an intervention, some criminals may be arrested and removed from the streets. Others may choose to stop committing crimes, change where they commit crimes, or change the way they go about committing crime in response to the police intervention. Thus, a hot spot might disappear, with some criminal activities moving to another area. These changes will make the original data set obsolete. The most common practice involves calculating the probability density of crime distribution, ignoring the spatial constraints and environmental characteristics of the area [1,2,3,4,5,6,7]. Consequently, the results just indicate the distribution of existing data, particularly when the data of specific crimes is insufficient.
For traditional near-repeat theory, the nearness refers to the proximity in time and space. The risk of residential burglary increases as the spatiotemporal distance gets closer to the location which has experienced a burglary. This paper models the displacement and diffusion of residential burglary based on the near-repeat theory. It not only considers the spatial and temporal proximity relation between data, but also considers the rise of risk value due to similarity in environmental characteristics, though geographic entities with similar environmental characteristics are physically far from each other. The similarity in environmental factors between different geographic entities in the study area is quantified, and the geographic entities with similar environmental factors have similar criminal risk values; this is determined by using the geometric attributes of spatial data. The targets likely to be burgled but not identified by traditional analysis methods are finally determined, that is, burglary crime pattern in the entire area is developed using the spatial and environmental data. The algorithm described in the paper is also an expandable model, which makes it easy to involve more environmental characteristics for further study and it is useful for crime prevention and patrol strategy design. At last, the paper concludes and discusses experimental results, and addresses the practical significance and limitations of the study.
2. Literature Review
2.1. Near-Repeat Analysis
Scholars have attempted to explore the spatial and temporal attributes of crime data in the context of environmental criminology [8,9,10,11,12]. The near-repeat effect exhibits a target selection pattern [13,14,15], where a crime occurs repeatedly against some individuals or at some specific locations [16,17]. Such statistically significant near-repeat phenomenon widely existed [18,19,20] within 14–60 days in time and 400–1200 m in space, and the risk was above 30% for all of these studies, indicating the necessity for crime prevention efforts. However, the risk value decreased gradually within the time and space (14–60 days and 400–1200 m respectively) and then reduced to zeros. The near-repeat phenomenon, which reveals significant space-time concentration of crimes, helps to predict future criminal risk in a certain space and time, based on known criminal data.
Traditionally, the analysis of residential burglary emphasizes the highly-risky areas based on temporal and spatial concentration of crime data. Kernel density estimation (KDE) is a feasible method to describe near-repeat phenomenon [1,7,15,21]. KDE is a statistical technique which allows a continuous probability distribution to be estimated using empirical data. The intuitive idea is to spread out each crime’s expected contribution over the area around itself using a mathematical function called a kernel. But if the distribution of burglary is mathematically converted into a distribution function , the existing data can seem to be an unknown distribution. It is difficult to decide how much data is needed to obtain the overall distribution of the study area, that is, identifying the locations of high risk should be impossible by simply relying on historical crime data points. The paper involves quantifying the local, social, and environmental characteristics and using them as a priori for estimation of criminal risk, so that we can achieve a relatively complete pattern of residential burglary without heavily depending on crime data.
2.2. Environmental Criminology and Crime Displacement
The near-repeat effect does not fully explain criminal behaviors, as crime distribution is characterized not only by diffusion, but also by displacement [22,23,24,25,26]. Displacement is the change of crime from one place, time, target or tactic to another as a result of some crime prevention initiative or of enhancing vigilance of community residents or policing efforts. According to environmental criminology, the occurrence of residential burglary is related to the characteristics of the local social environment [27,28]. For offenders, places that have a similar structure and social environment provide similar crime opportunities [29], leading to a higher risk of residential burglary. Meanwhile, because of low clear-up rates for residential burglary cases, offenders tend to learn new tactics and skillsets from each action. Temporary spatial crime displacement may occur when offenders share their tactics and experience with each other, when investigation measures are disclosed by mass media, or where intensive patrol is conducted [30]. Spatial displacement occurs mostly when offenders perceive the potential of being detected, face reduced opportunities or find their offense not worth the reward. This may occur among adjacent sub-districts, communities, and cities [31].
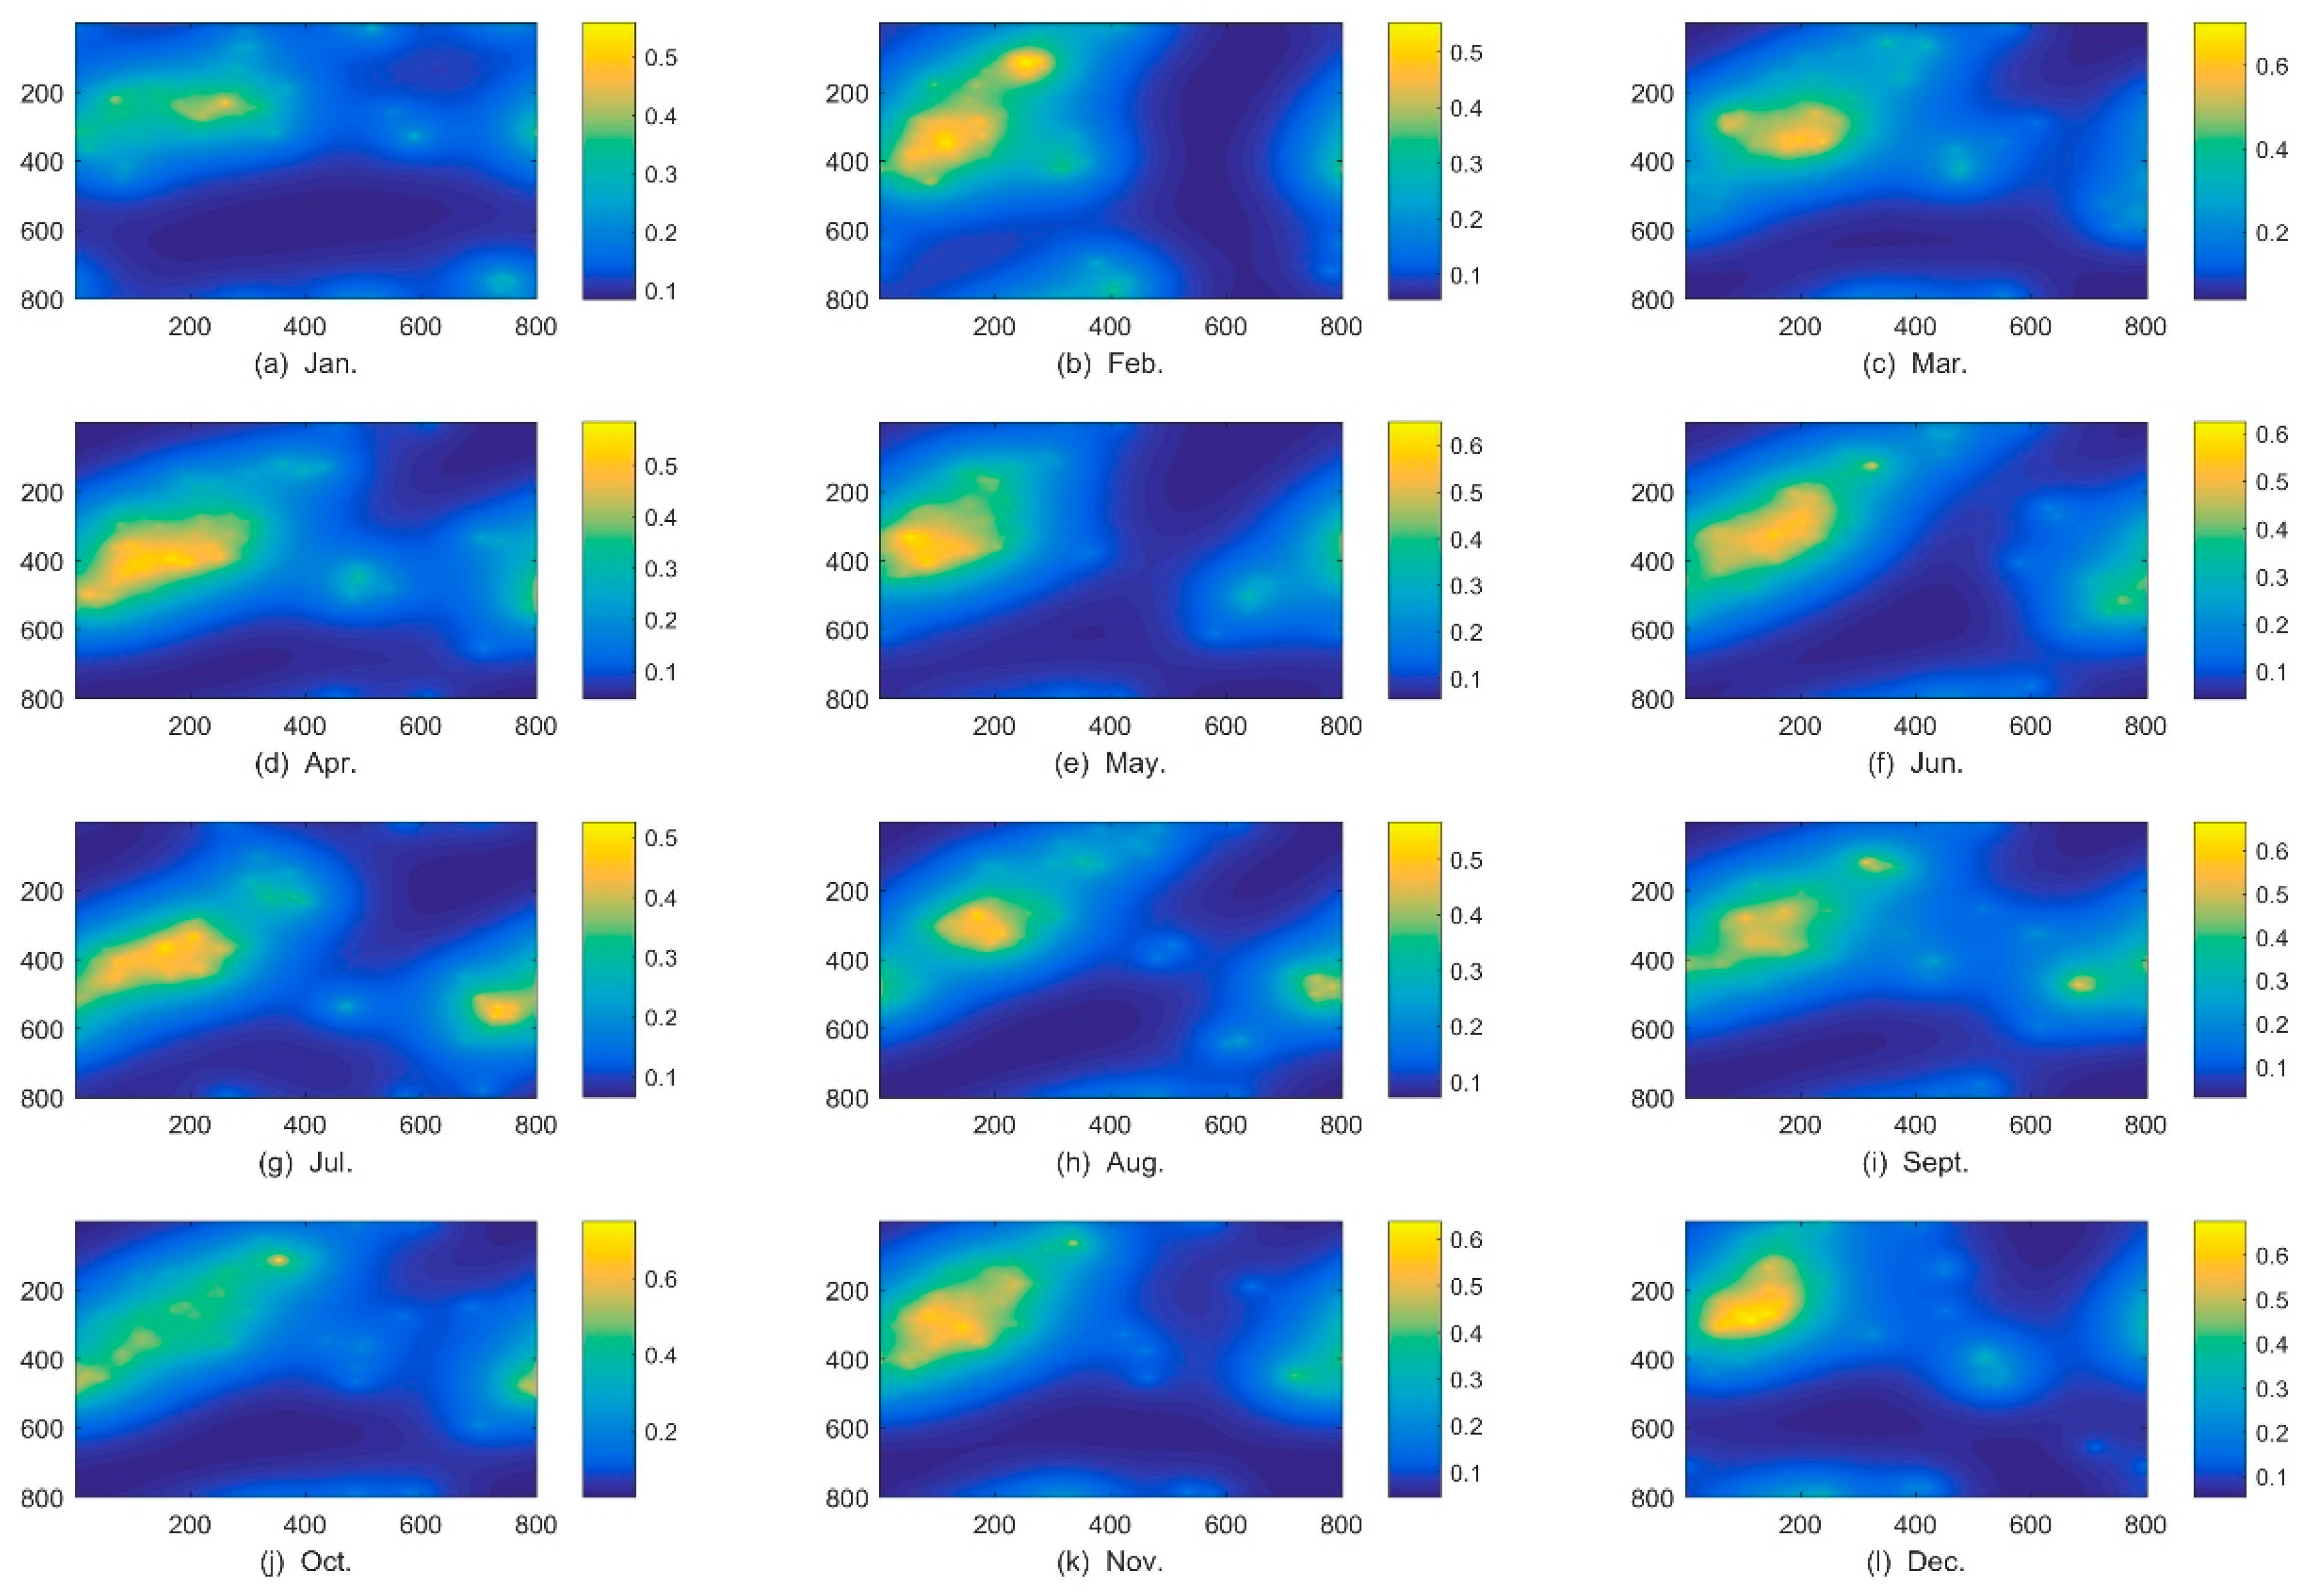
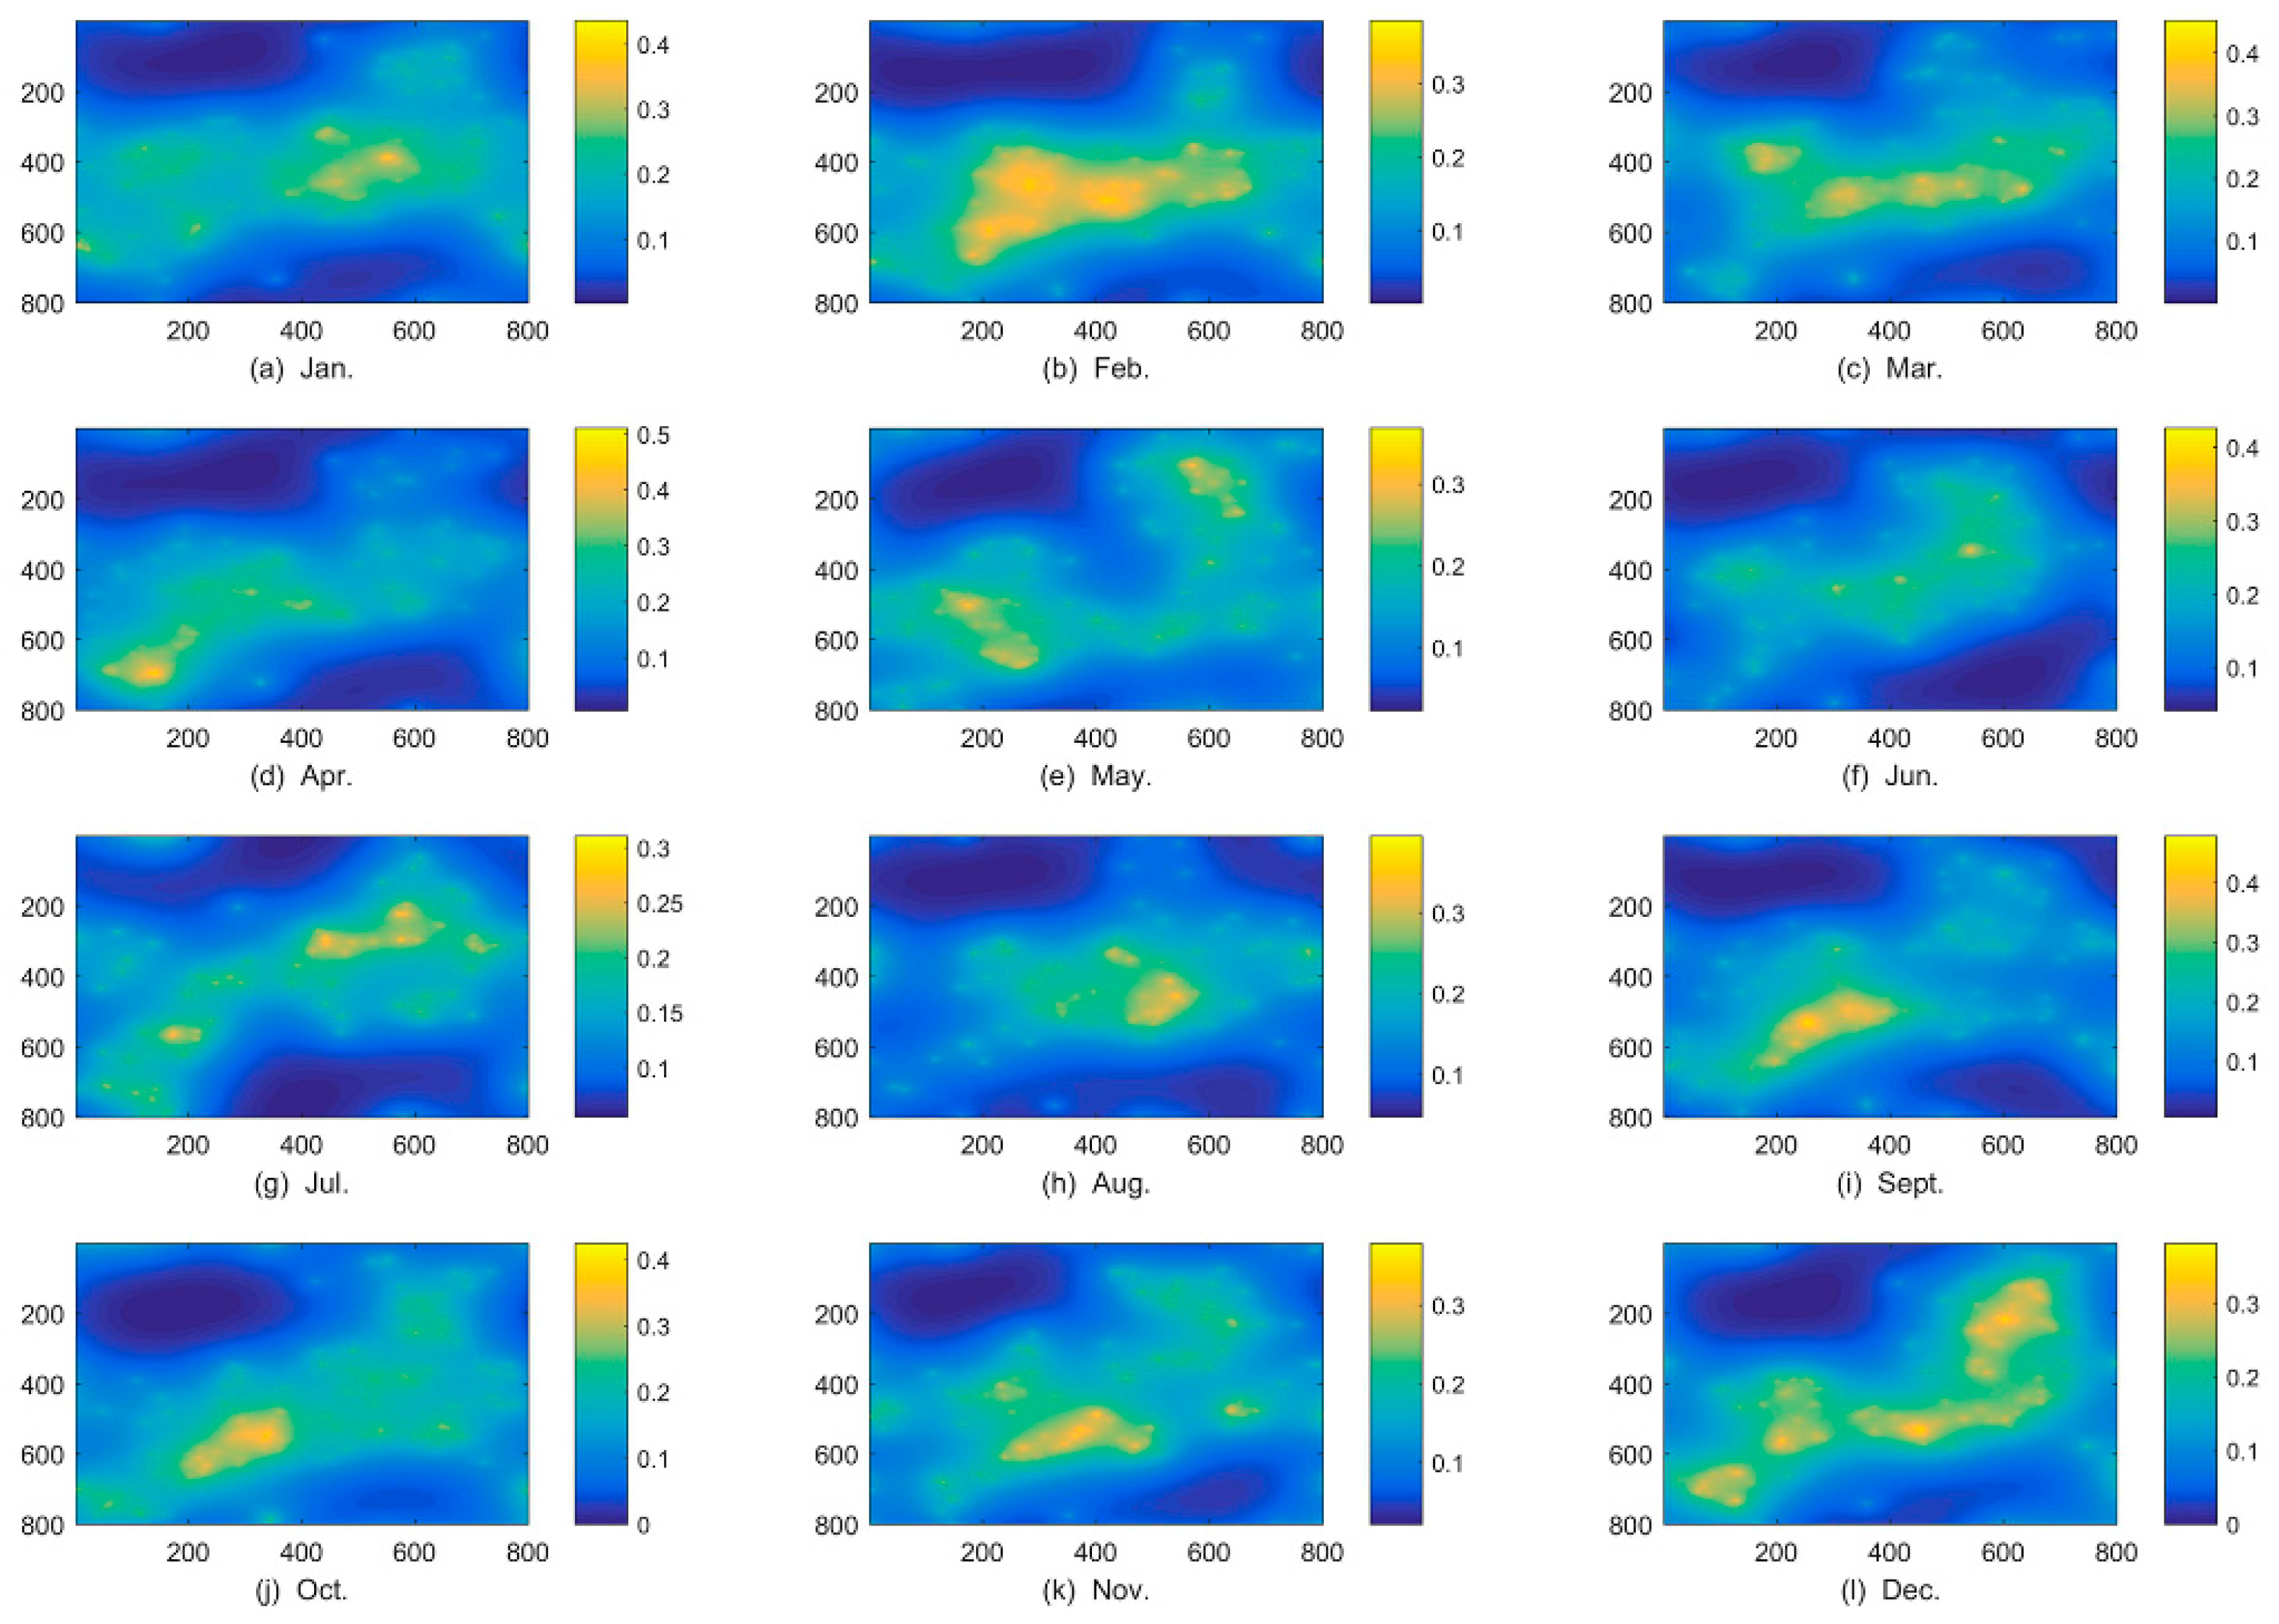
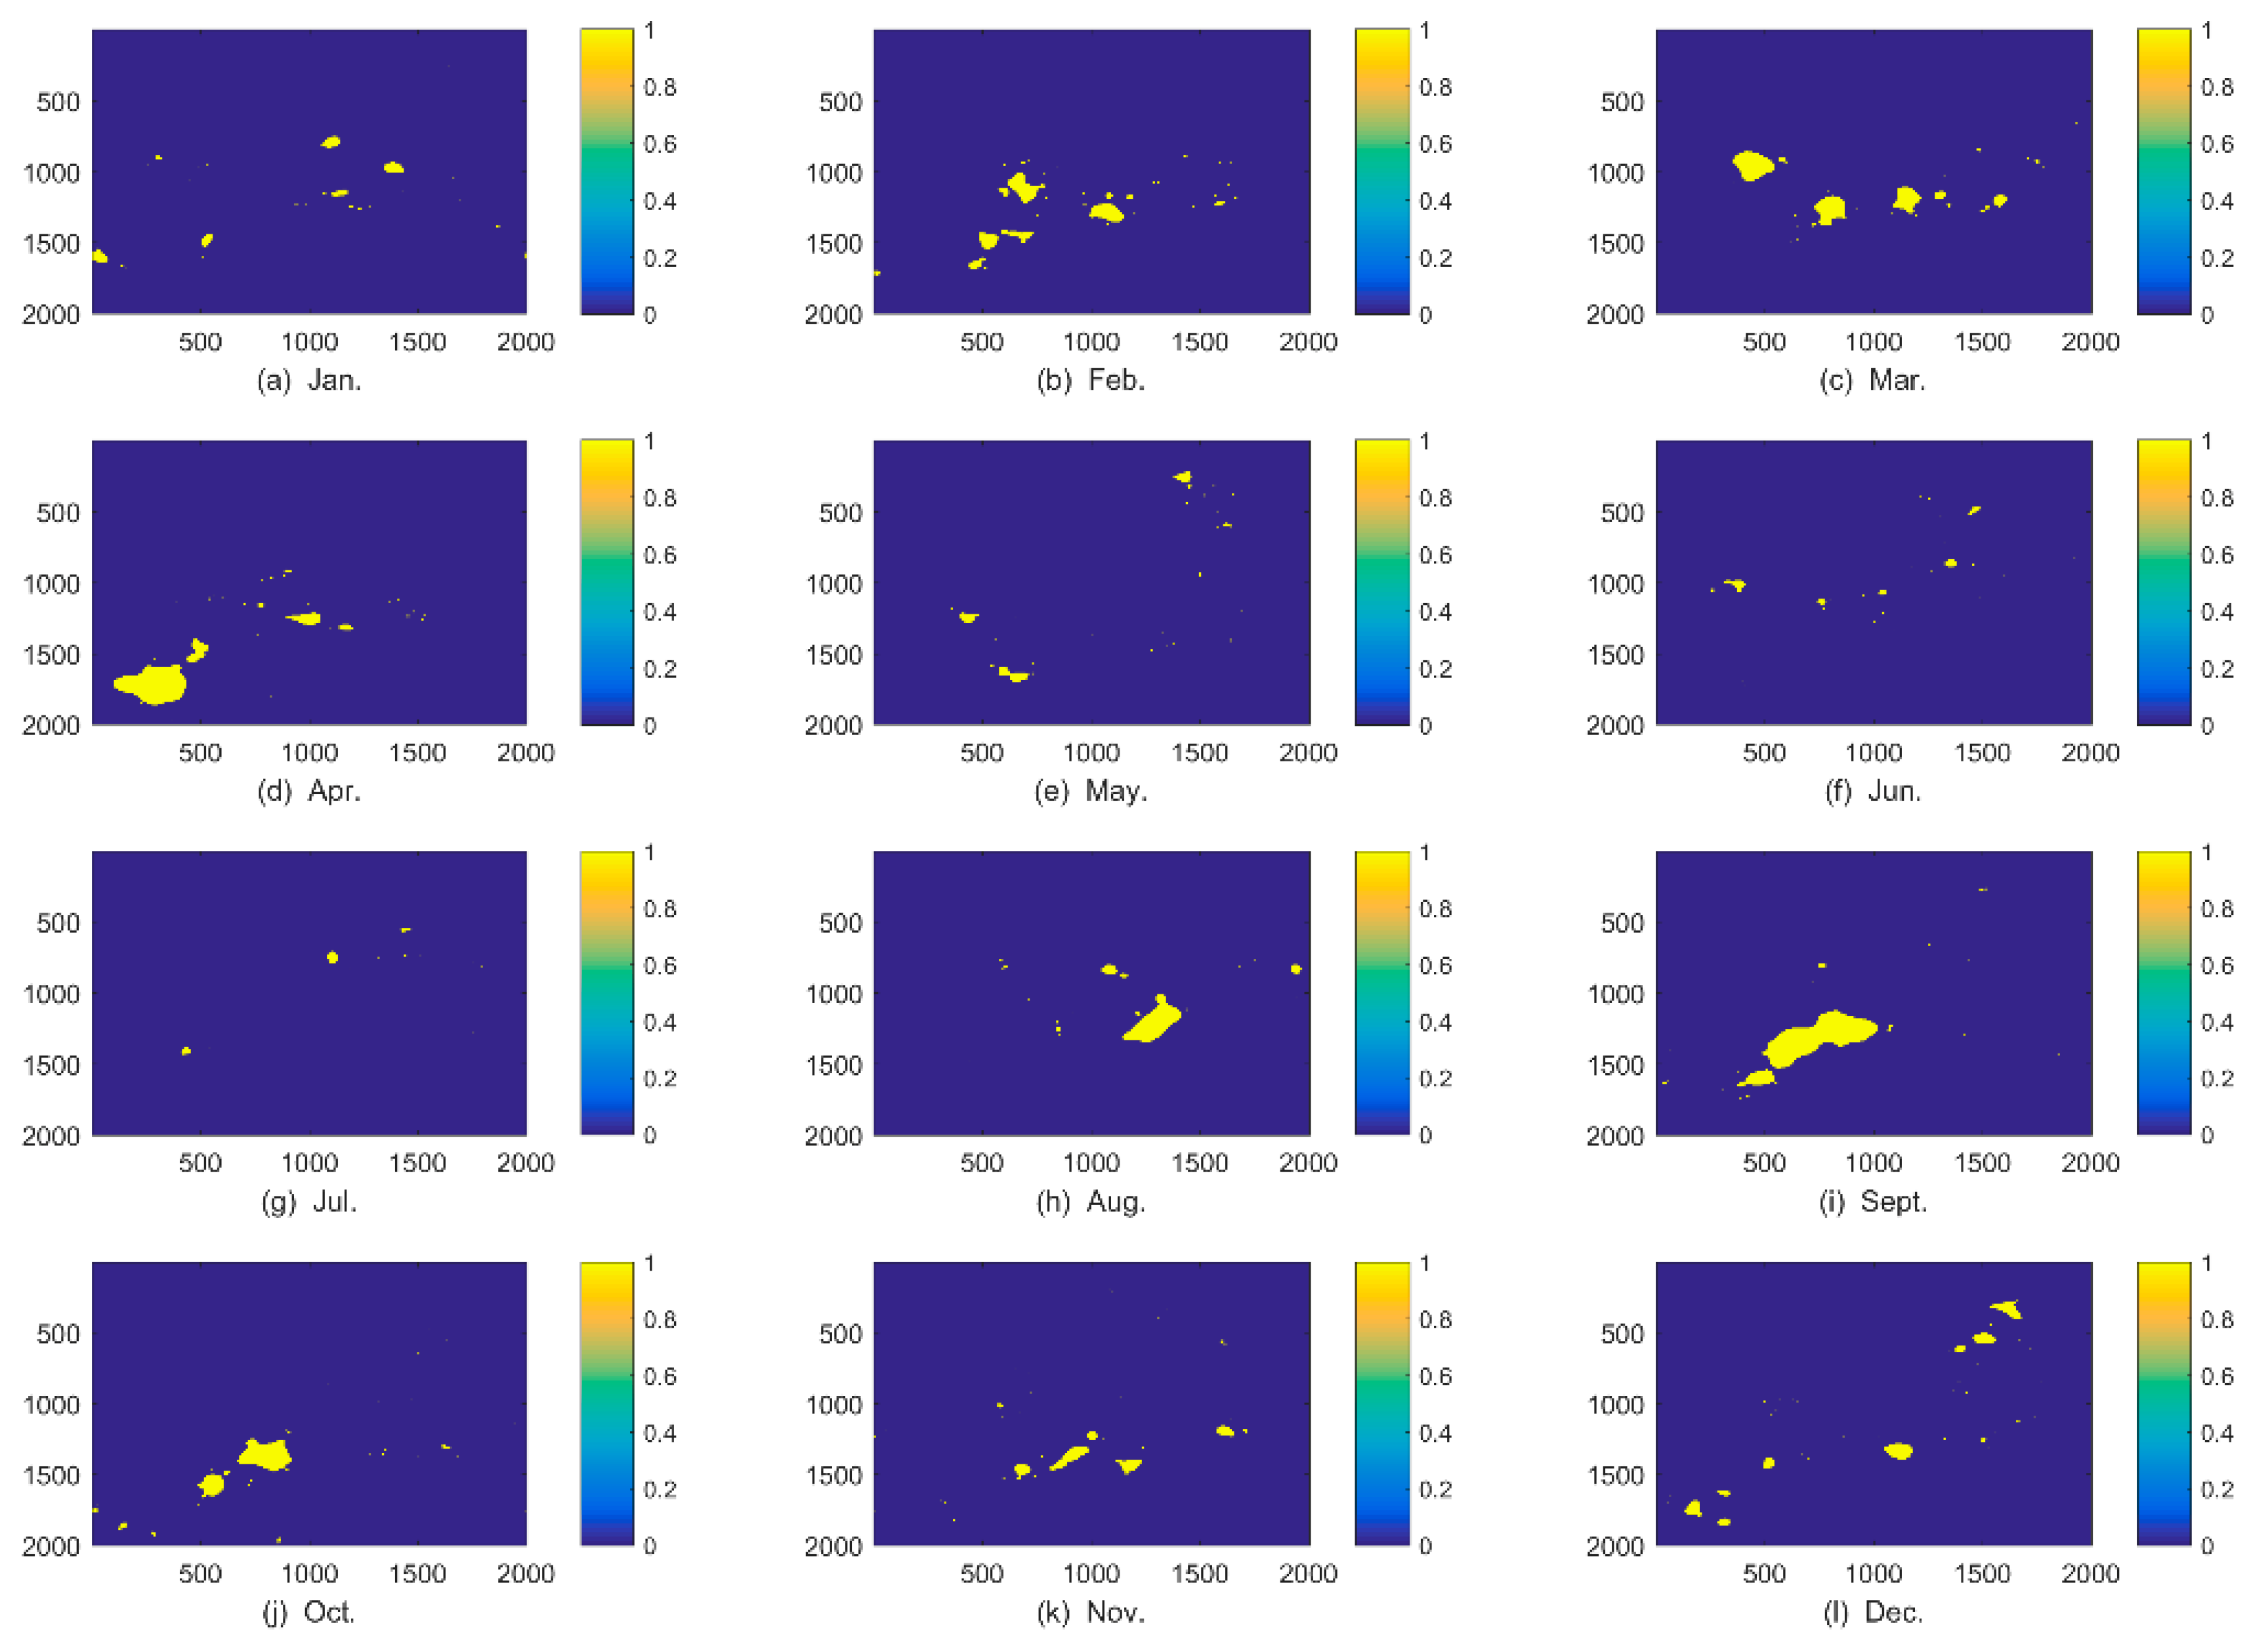
Figure 1. Analysis of nearly repeat. is a hot spot map created by kernel density estimation (KDE) for residential burglary in Qingshan District, Wuhan City of Hubei Province demonstrating the changes of location of hot spots of residential burglary from January to December 2014.
Some scholars do not agree with situational interventions, believing that offenses are inevitable due to social, economic, biological and psychological factors [23]. In their view, situational interventions contribute little to crime reduction, but simply result in the change of crime to another time, place or tactic. As can be seen from the figure (Figure 1), the hot spots are concentrated in northwestern, central and eastern Qingshan District. The three concentrated places bristle with commercial residential quarters with high population density, and are therefore vulnerable to residential burglary. More importantly, it is clear from the figure that the hot spots vary almost every month, that is, burglaries show notable spatial displacement, both within and between the three hot spots.
Although the target selection is seemingly random, there must be a reasonable criterion. Spatial displacement [24] is the displacement between similar places. From the view of environmental criminology, the selection of the target by offenders is influenced by motivation, how much effort is needed, and whether it is worth the reward. Some researchers argue that different target places are often similar in some respects, such as in their environmental characteristics. Moreover, based on one of the basic principles in behavioral geography, that is, the nearness principle, also known as the least-effort principle in psychology, human behavior is influenced by the least-effort principle, in which people hope to gain maximum benefits with minimum cost. As a result of this principle, when attempting to solve a problem or achieve a goal, people always tend to minimize their efforts by seeking a convenient, easy method. Thus, when several similar intended targets are optional, offenders are most likely to select the one requiring the least effort. The least-effort principle is of great importance for criminology.
3. Method and Dataset
3.1. Dataset
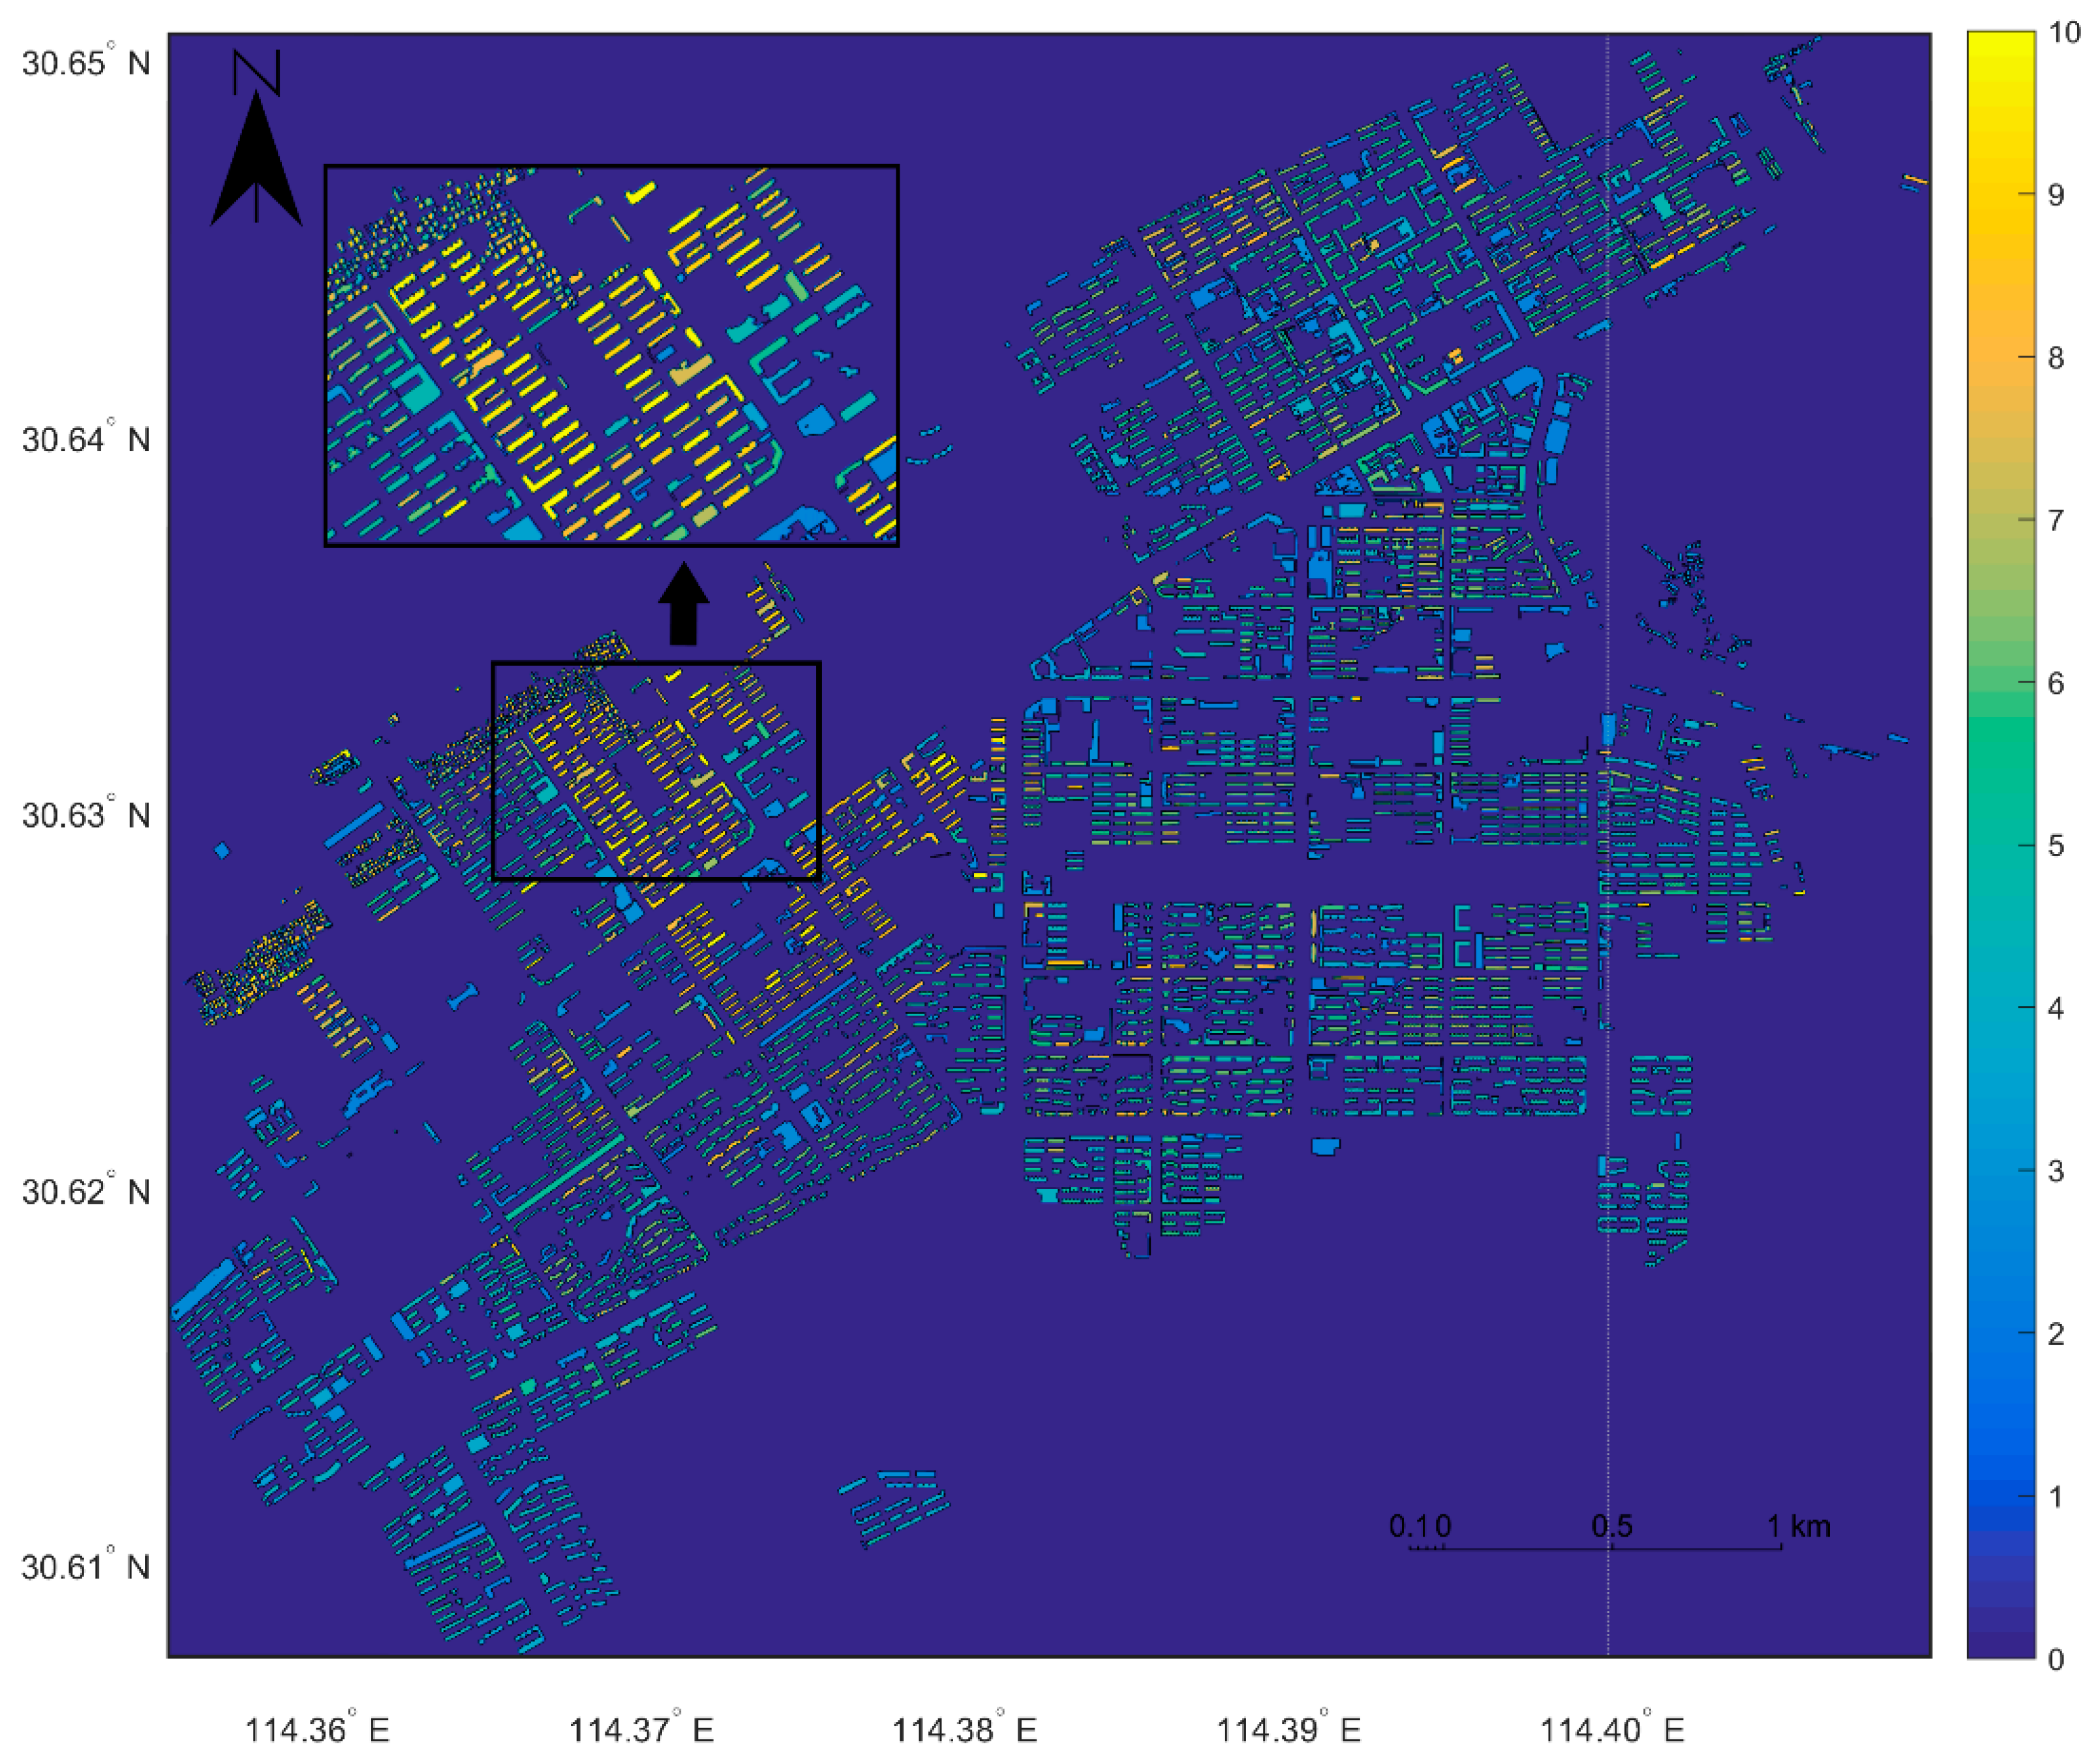
Qingshan District (30°37′N, 114°26′E) in Wuhan of Hubei Province is selected as the case study area. The household registration data achieved in 2013 consists of the coordinates of houses and their standard addresses. There are 452,870 households. There are 1170 crime incidents from January to December in 2014 with the thematic attributes of the date, place, type and description of crime. The configuration of computers is as follows: core i7 4770MQ processor GTX765 m GPU, 8 G memory. The case study area is with the grid size of raster . The vector data of house boundary achieved in 2011 is polygonal data, with the polygonal vertex coordinates composed of geographical coordinates. The house vector data in the experiment area covers 3964 polygon entities, and is used to provide spatial constraint for cases and household data, i.e., the computational accuracy of risk value in the paper reaches the building level. The distribution is described as follows:
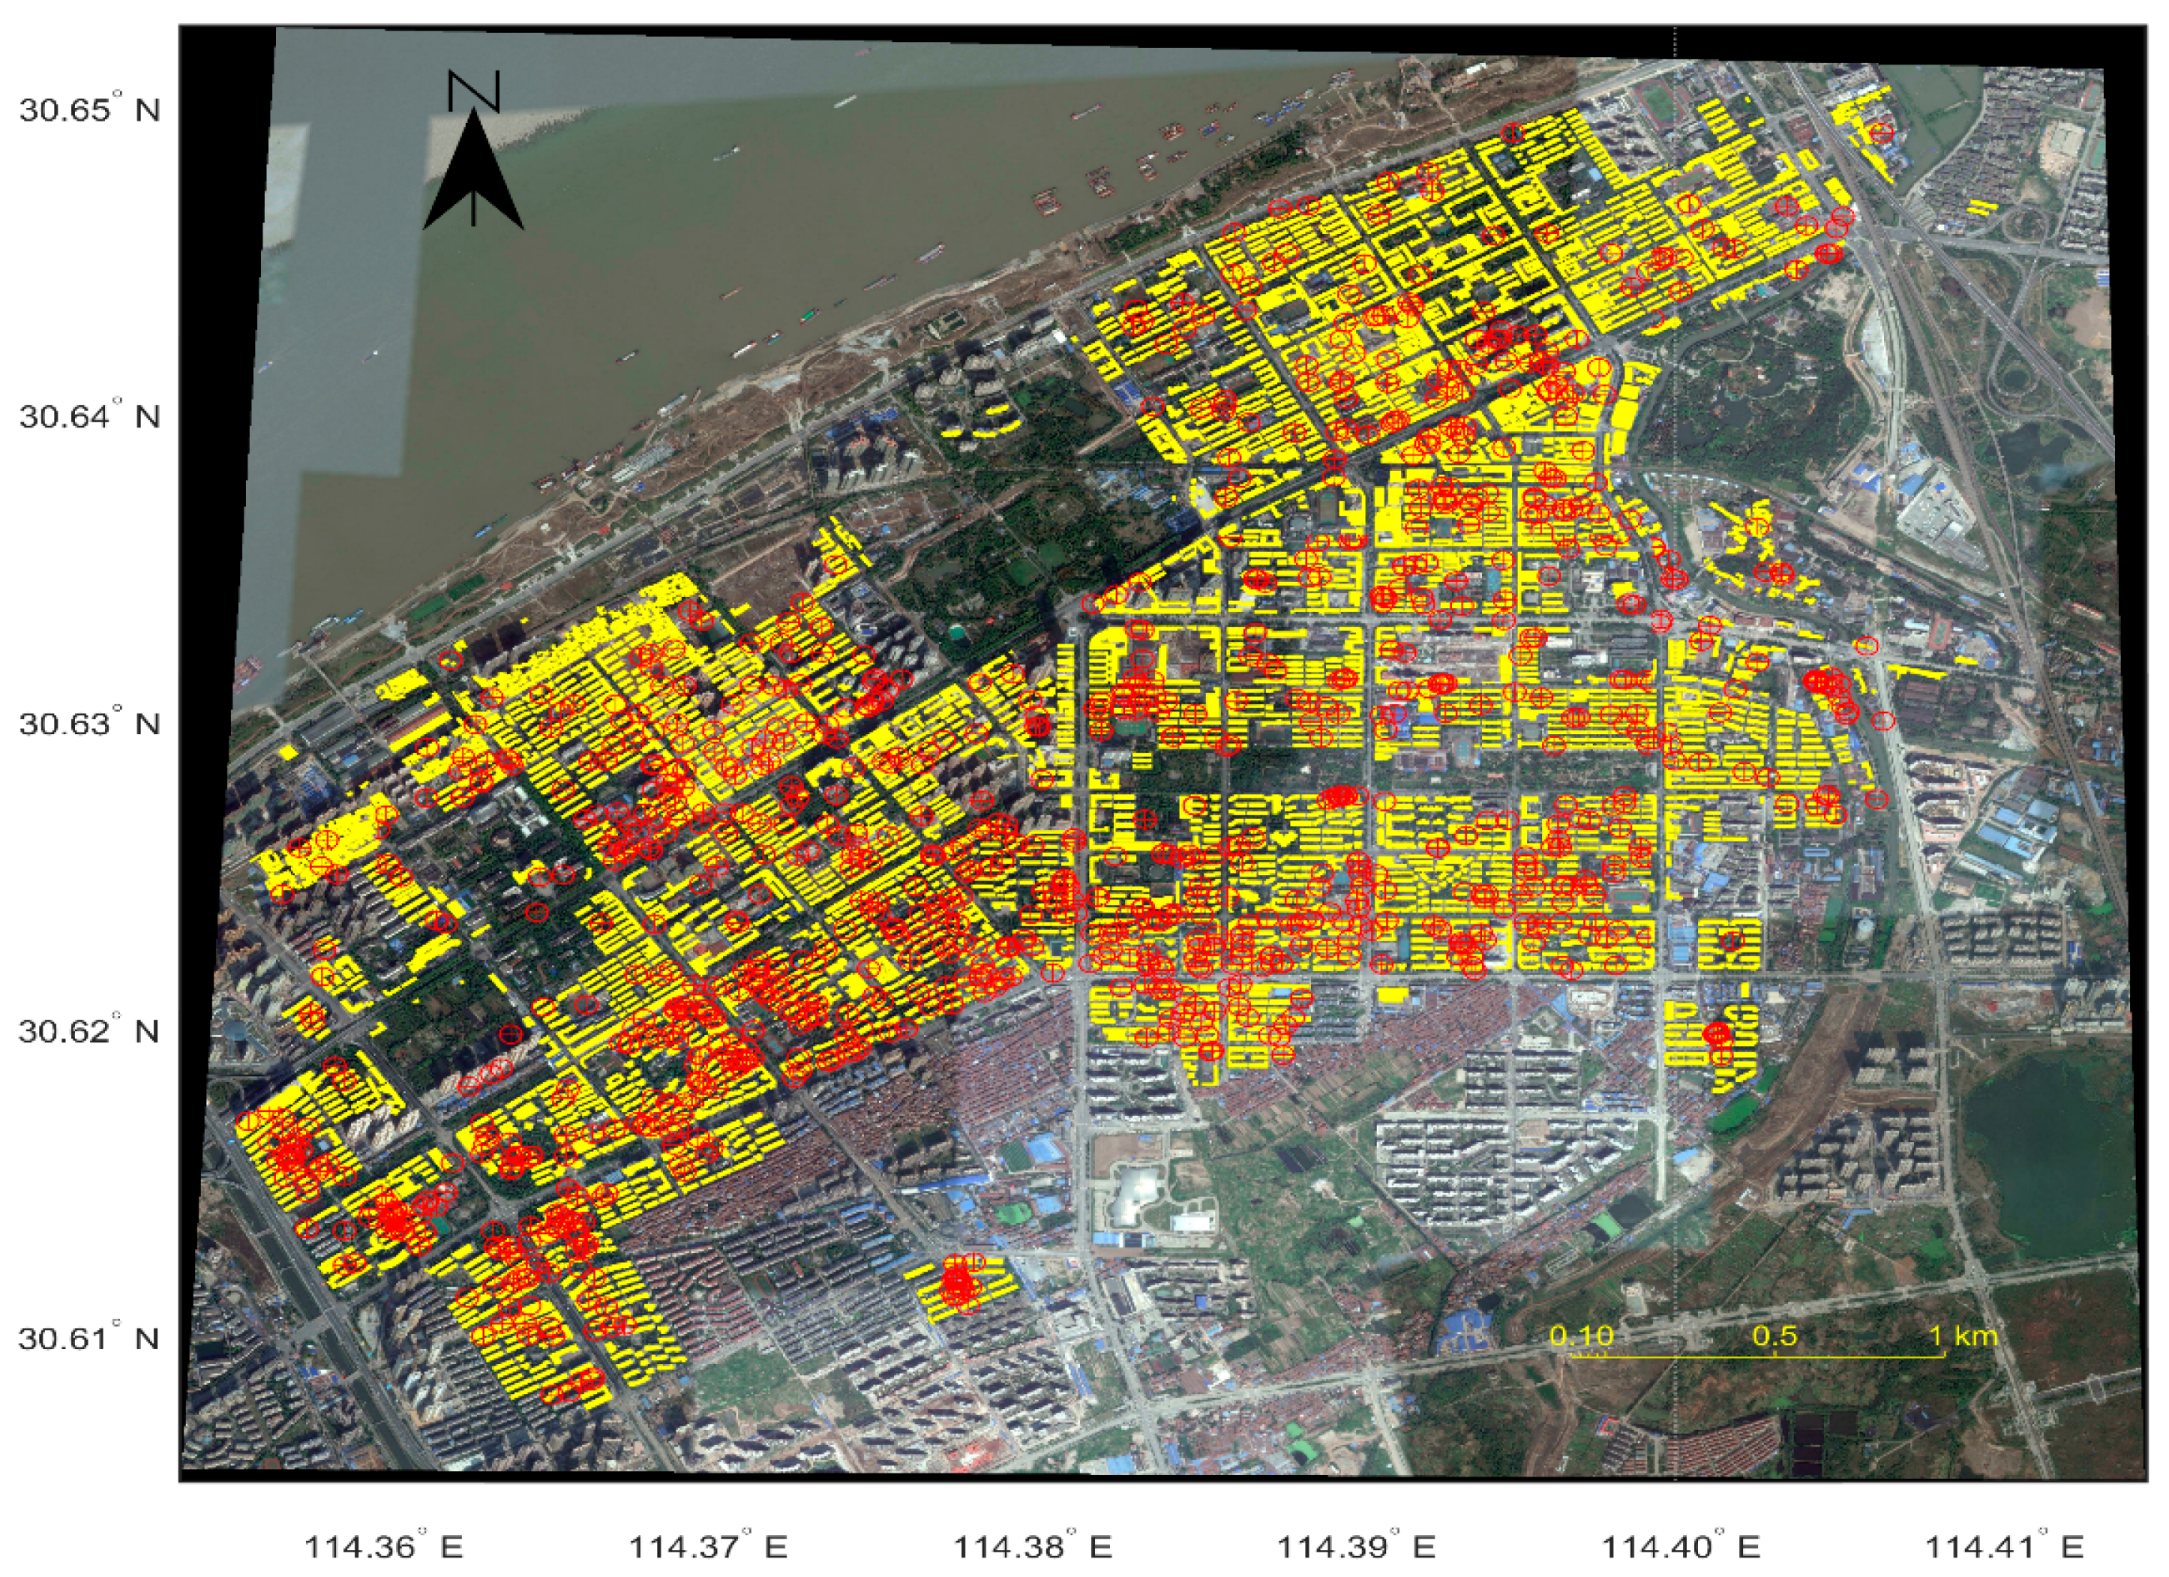
The Figure 2 is the building vector data in the experiment area and the distribution of cases. Depending on the thematic attributes of cases and spatial position, the cases which are classified as residential burglary and occur in the experimental region are screened out. As a result, 1117 pieces of case point data are screened, with a time span of one year. As for household registration data, the permanent address text (Floor xx, Unit xx, building xx, No. xx, Community xx, Street xx, Qingshan District, Wuhan City) of thematic attributes in household registration point data is used to associate with house vector data.
3.2. Similarity Measurement
Events of residential burglary and their secondary incidents share similar temporal and spatial data [14]. This similarity may be the result of the fact that the area experiencing burglary has unique environmental characteristics attractive to opportunistic burglars, who are likely to travel to the next community with a similar social environment. The social environment variables are formed by the combination of the original data of environment variables and the geographical entities. To establish a model for spatial displacement of criminal risk, it is essential that the environmental characteristics in the study area are qualified to identify the similarity between different geographic entities. In this study, household density is used as an environmental characteristic. Unlike population density, it is more closely related to burglary, as burglary is targeted at households rather than individuals.
3.2.1. Measurement of Environmental Characteristics
The vector data structure of geospatial data contains geographic entities with their geometrical features and thematic attributes. The surface entities of house boundary are generally described with polygon, and represent zonal geographic elements surrounded by closed polygon, like administrative district, building and house, and vegetation distribution. The surface object data used in the paper is house boundary data, designed for spatial constraint of the data on criminal cases and household registration to facilitate centralized calculation of environmental characteristics. The point object data in the paper mainly includes case data and household registration data. The case data primarily carries such thematic attributes as the type, description and time of cases and the registration data carries the location of a family. The thematic attributes in the household registration data largely show the information of household address, for example, Floor xx, Unit xx, Building xx, No. xx, Community xx, Street xx, Qingshan District, Wuhan City.
The relationships among spatial entities (household registration and house boundary) are called spatial relationships. This paper mainly applies spatial overlay to identify the topological relationships of inclusion and intersection. The intersection of the spatial locations of both households and house boundaries is determined and linked with thematic attributes. The household density on each surface element in the experimental region is determined by counting the number of households located within a certain polygon, extracting the floor from the household addresses in thematic attributes mentioned above and calculating the area of the surface entity of house boundary.
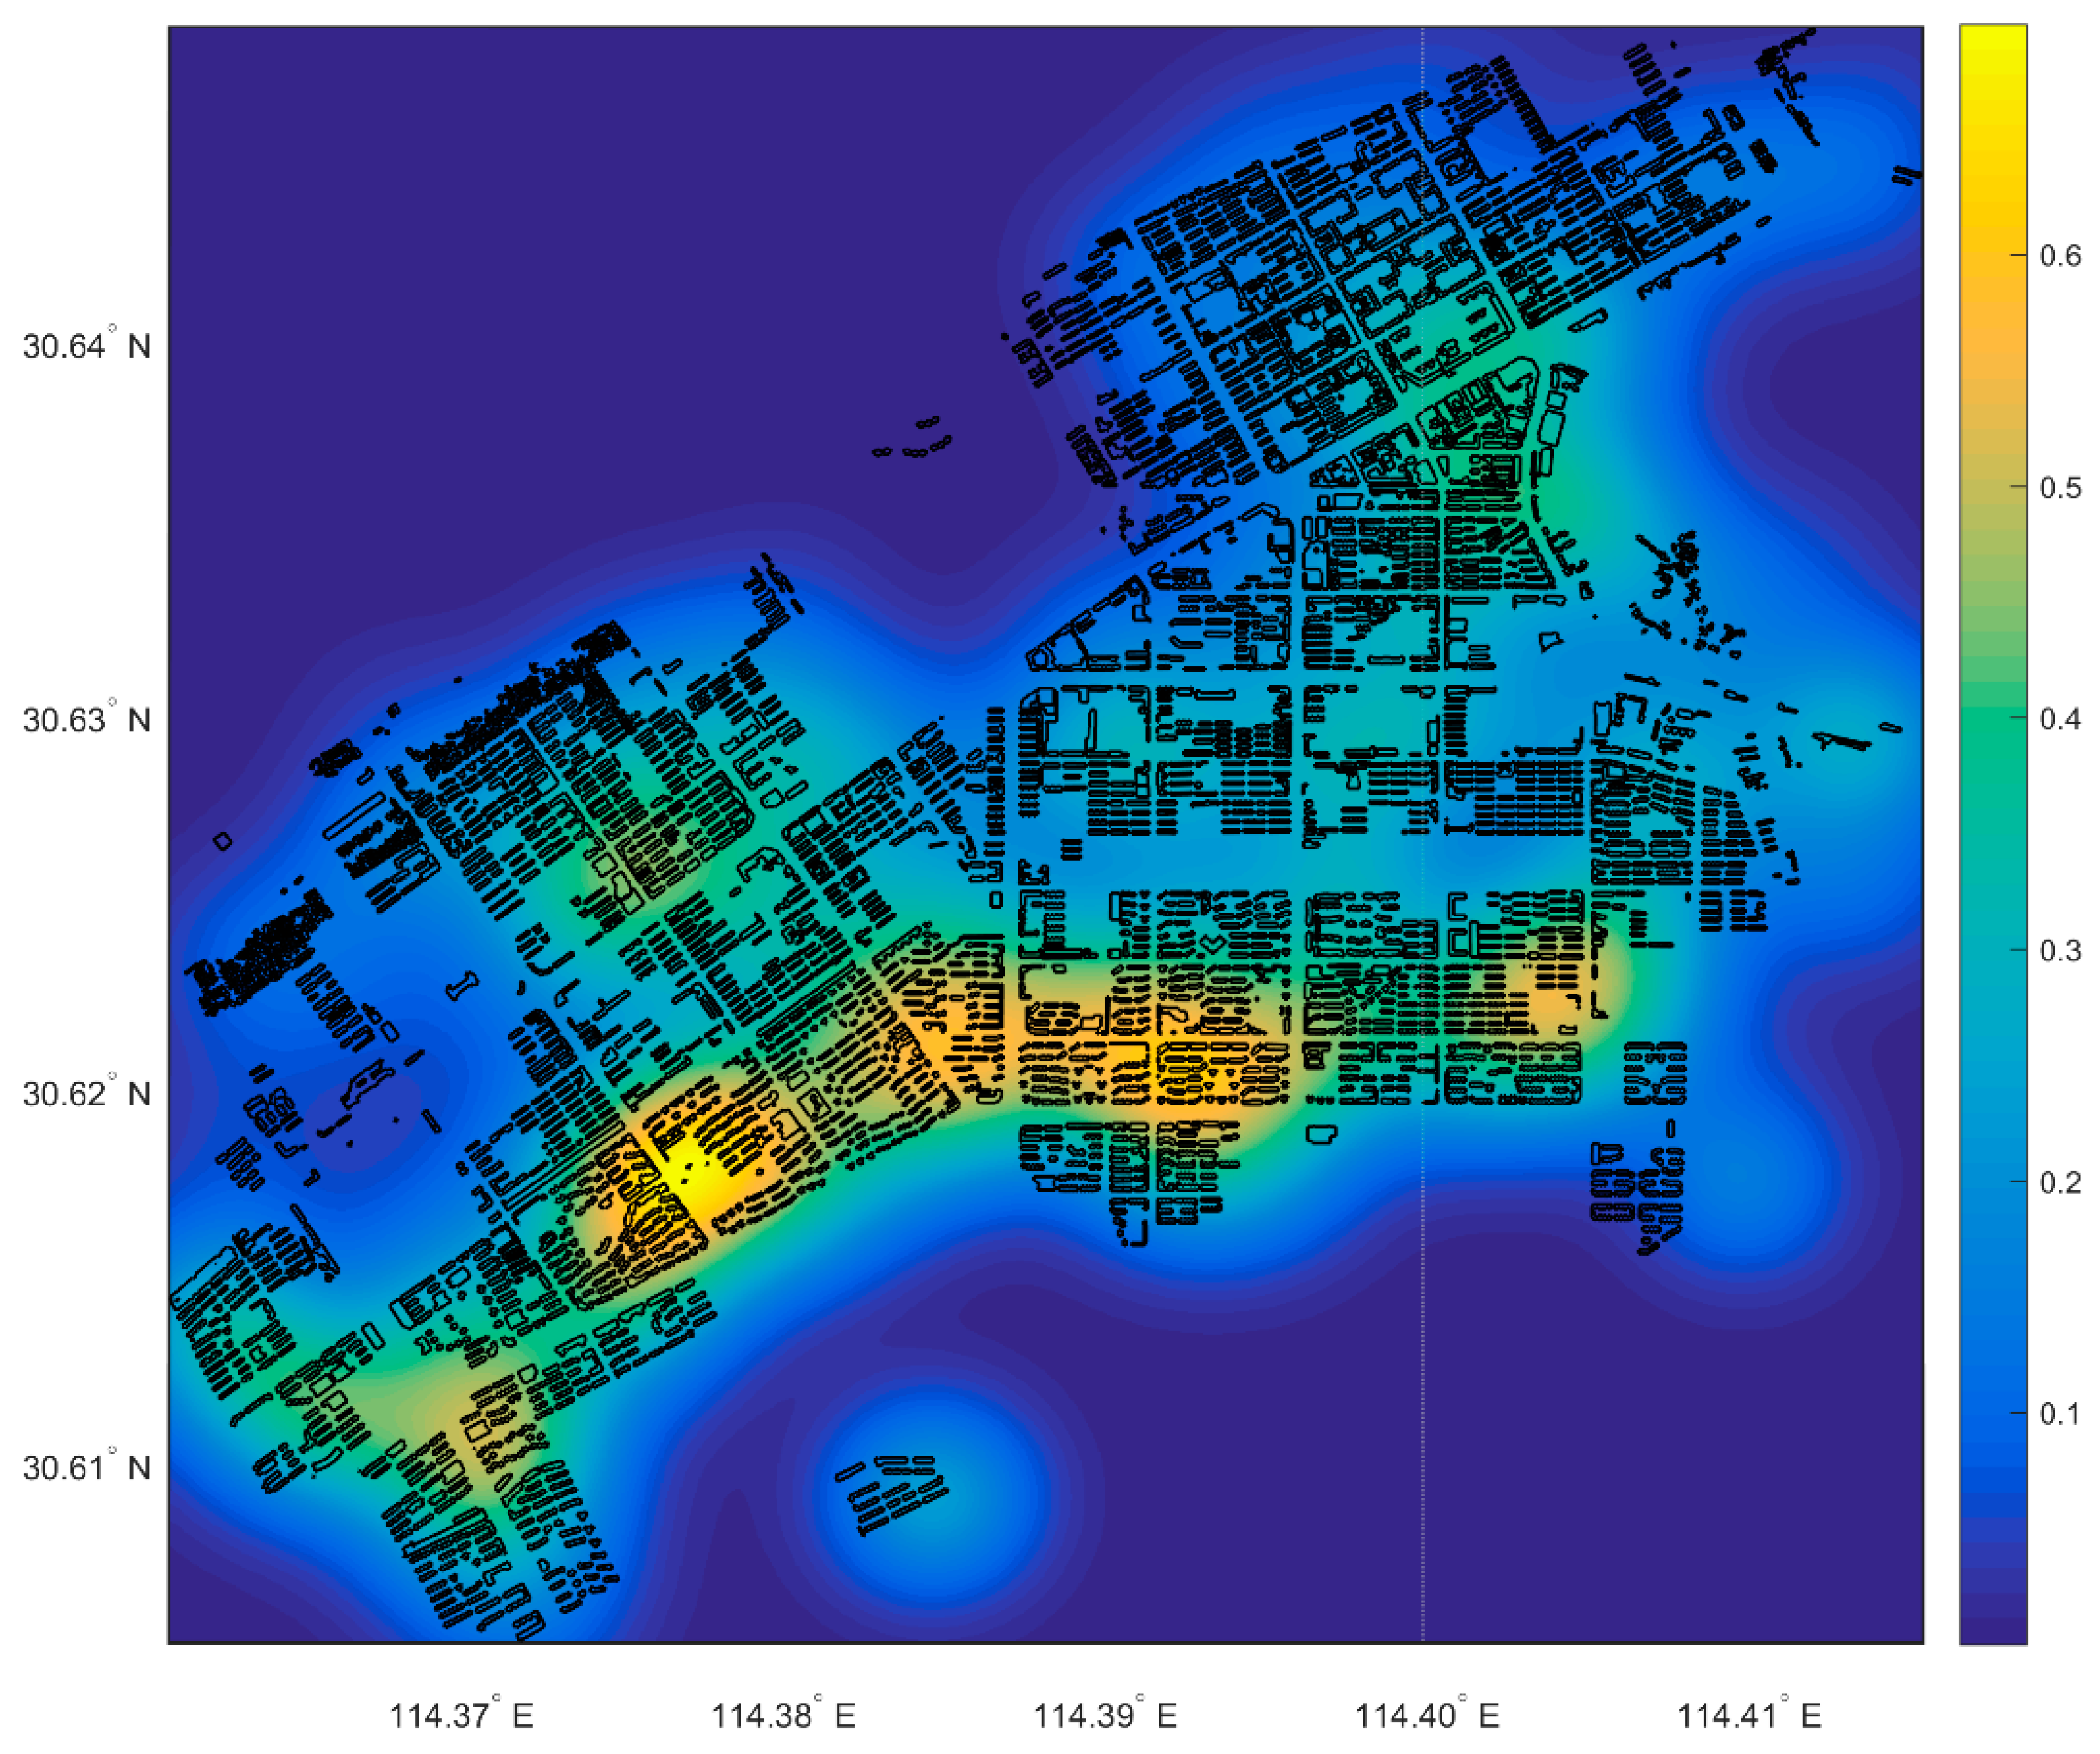
A raster data structure is based on a (usually rectangular, square-based) tessellation of the 2D geographic space into cells. The rasterization allows easy quantification and calculation of thematic attributes. Assume the step length , are the grid granularity. Two groups of grid lines parallel to longitude and latitude are drawn: . The area of is divided into small rectangles, with each given corresponding density value. The rasterization results of household density are as follows. Where, .
As shown in the Figure 3, the hot spots represent high household density.
3.2.2. Similarity Measurement
Quantifying the differences between samples and evaluating their similarity is necessary for the perspective of machine learning and data mining. To estimate the displacement of criminal risk values of residential burglary, the similarity in environmental characteristics between a surface entity of house boundary experiencing residential burglary and all other entities in the whole area is measured. This is done by comparing the distances between the thematic attributes of two surface elements to find the similarity in a thematic attribute between two geographic entities. With respect to households, their attribute similarity is measured through calculation of the household density among the surface entities of house boundary. The distance between the and surface entities of house boundary are defined below:
It is the squared exponential function which can be used to express the distance between the two elements in a certain metric space. This is advantageous for controlling the range in space and sensitivity of similarity between two samples. Where, is used to control the droop rate of with the increase of the distance between and and is the household density of the surface entity of house boundary and is the parameter for specified the way of declination.
The similarity in environmental characteristics between the surface entity of house boundary and others is expressed as . Then, we have:
We consider a spatial domain, our experiment area, where the instantaneous criminal activity at location (marked with white X) and time , traditional near-repeat model would suggest that the risk value tends to spread to spatially adjacent surface entities of house boundary. The paper argues, however, that risk value would also spread to adjacent surface entities of house boundary with similar environmental characteristics. To establish a model for the displacement effect, it is necessary to search the surface entities of house boundary similar in environmental characteristics to the burgled entity in the whole study area. In the event of a burglary, a similarity distribution will be developed and rasterized through the similarity defined in the section above.
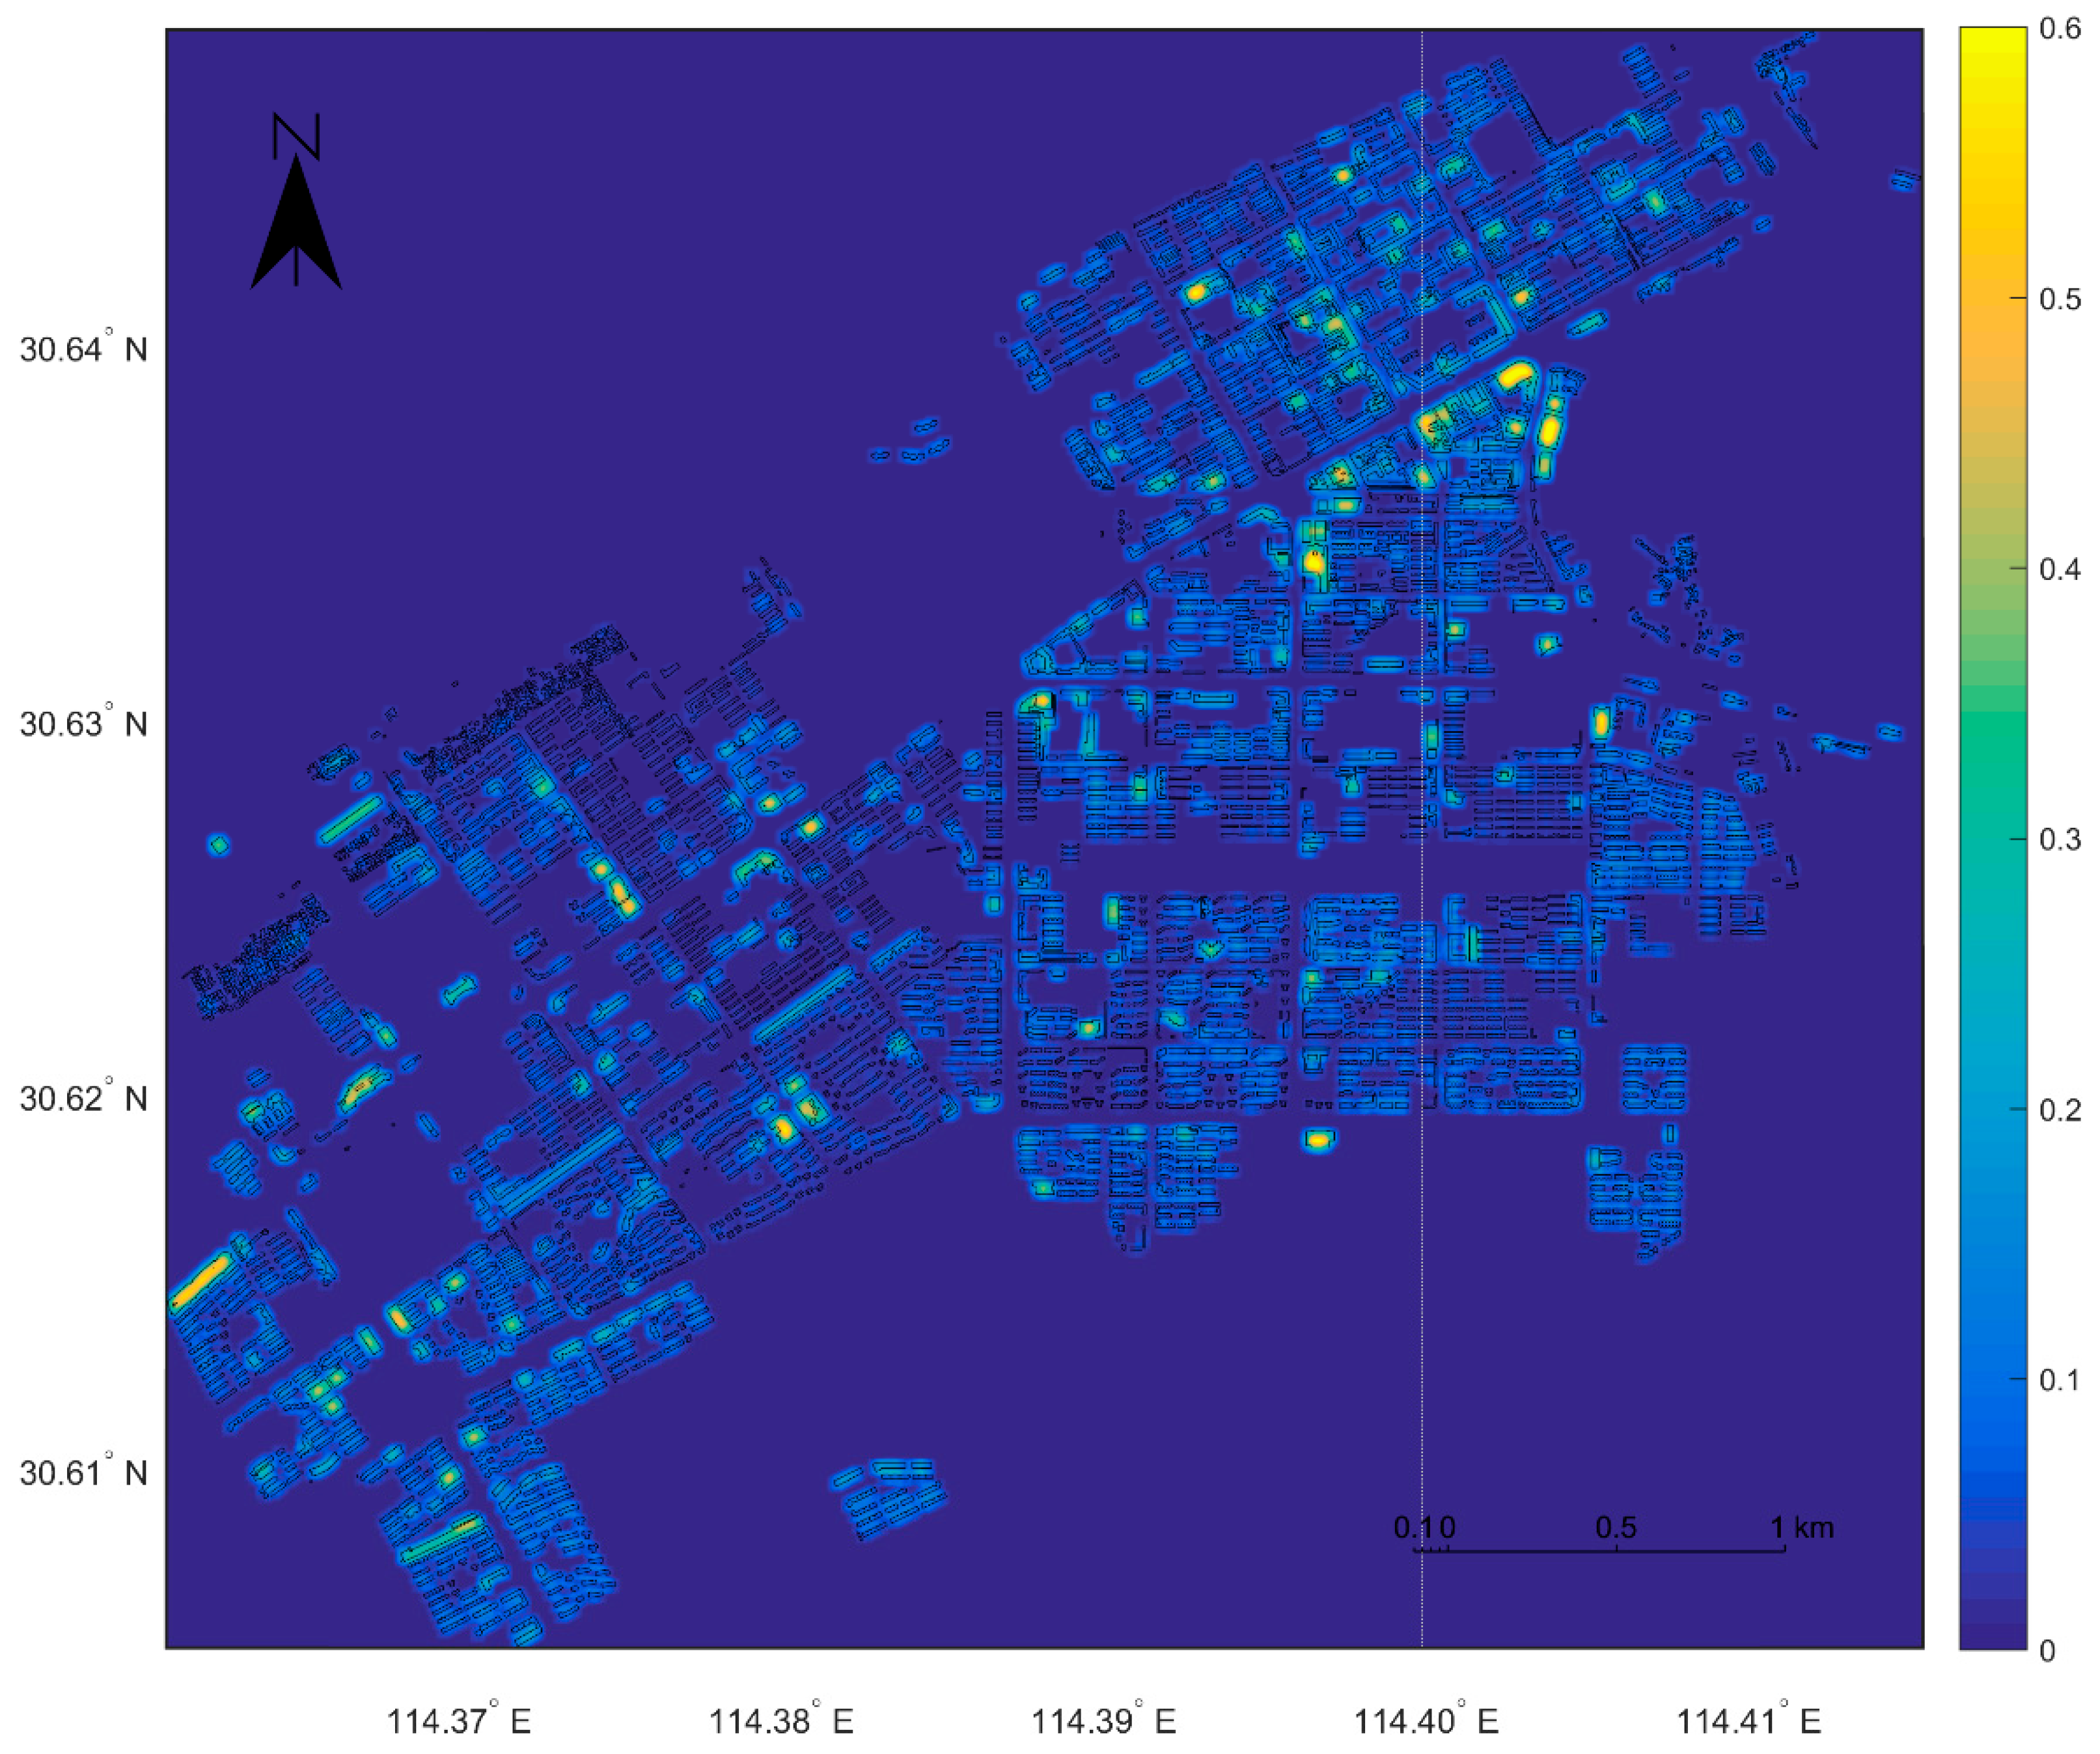
We show the understanding of displacement in Figure 4 based on our assumptions; the risk of burglary will be transferred to the geographic entities that have a similar social environment. Figure 4a shows the hot spots of household density. The hot spots indicate high density, and those bearing a white X mark are the places where burglaries have occurred. Figure 4b presents the hot spots where the household density is similar to that of the burgled place X, with the degrees of similarity in a range of 0–1. The hot spot figures for similarity are developed for each type of burglary. The rasterized graph can be viewed as a bivariate distribution function for the similarity. Different cases may see similar results.
3.3. Diffusion Model
Traditional near-repeat analysis describes the decrease process of residential burglary risk value when the distance increased in space and time [32,33,34,35], but fails to describe crime displacement. In order to analyze the diffusion and displacement phenomena of residential burglary risks, this paper considers using the diffusion equation to establish a model. The diffusion equation [36,37], also known as the heat conduction equation, is a parabolic partial differential equation and it is often used for modeling of the physical process subject to diffusion phenomenon [38,39,40] and describing the changes of substance or energy distribution concentration over time during diffusion. In the case of non-homogeneous distribution of temperature or energy in the system, heat will flow from high temperature to low temperature, and the distribution function is a function of time and location due to the energy intensities at different times and locations.
It is hard to work out an analytical solution to definite solution problem of most differential equations, so the numerical method is often used to get an approximate solution. Numerical solutions for partial differential equations mainly include the spectral method, the finite difference method, the finite element method and the finite volume (element) method, in which the finite difference method is one of the most commonly and widely used numerical methods. The paper applies alternating direction implicit difference method (ADI) [41], aiming to convert the multi-dimensional problems requiring solutions to a set of independent one-dimensional problems to solve, so as to reduce the computation burden and improve the computational efficiency. More importantly, its solution is stable [42], which is needed for the paper. For the analysis of stability, [43] refer to von Neumann linear analysis method which is not discussed here.
3.3.1. Local Diffusion of Risk Value
The homogeneous diffusion equation model, which is often used to describe heat conduction phenomena or characterize the diffusion of molecules and gases etc. It describes the uniform energy diffusion process of the system without internal energy source, and is used in this paper to describe the space-time diffusion effect expressed by near-repeat model. The results of the homogeneous diffusion equation are similar to the kernel density estimation (KDE); they equally described the process of the homogeneous diffusion of the risk of burglary in the geographical space. The initial and boundary conditions of the equation are as follows:
where, is the distribution function of residential burglary risk in geographic space ; is the diffusion rate of risk value in spatial domain; is initial distribution and is boundary condition.
For each criminal case point , the initial distribution is used for introducing risk value. The parameters and can be used to control the process in time and space and describe the observed space-time diffusion phenomenon of residential burglary risk value. The specific values can be determined based on the cell size of raster map and the space-time diffusion distance (such as 30 days, 600 m) of risk value. When beyond this space-time distance, the risk value shall be reduced below 30% of the initial value, a level requiring no police intervention.
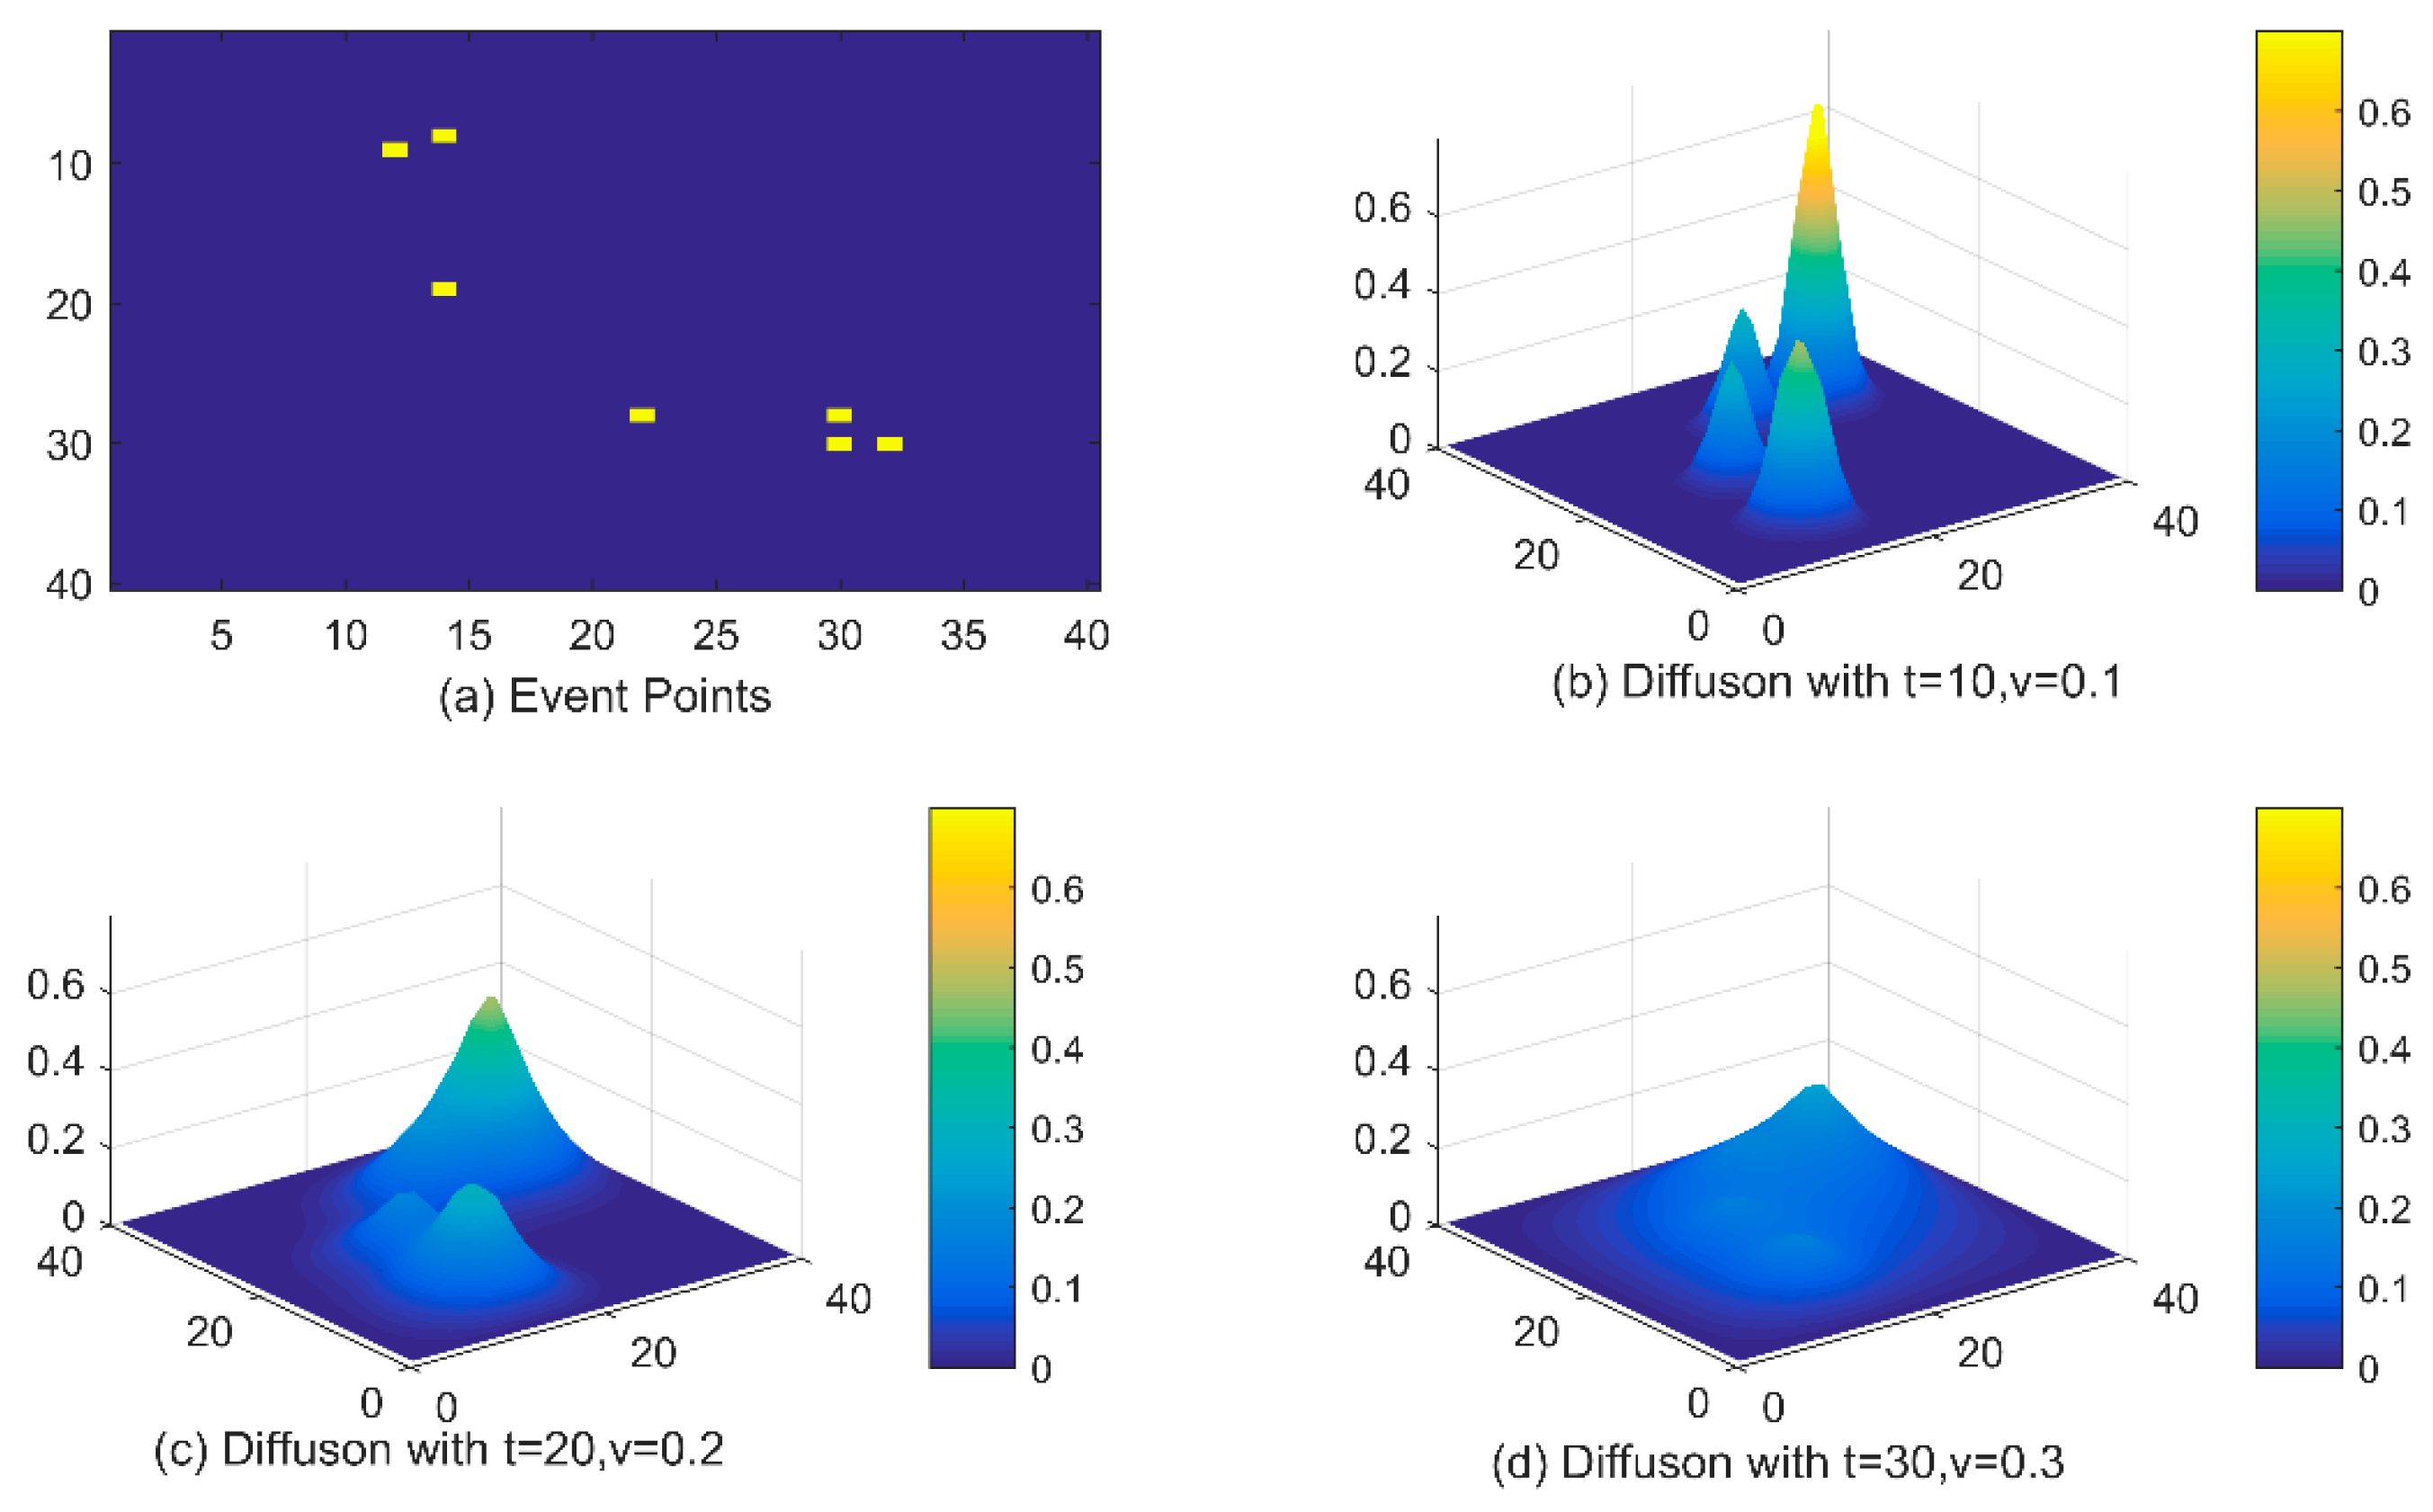
The initial distribution of cases is shown in Figure 5a and the rest is the diffusion of criminal risk values when t = 10, 20, 30 and v = 0.1, 0.2, 0.3 respectively. t is the number of iterations; v is the diffusion rate of risk value in grids. If t = 30 and v = 0.2, as shown in the Figure 5d, the risk has reduced below 30%. t and v are adjusted in accordance with grid size and near-repeat space-time rules in this area.
3.3.2. Global Transfer of Risk Value
In order to control and prevent crimes more effectively, the focus should change from the space coordinates of cases to the environmental characteristics of the areas where crimes occur so as to understand the nature of crime prevention from the perspective of environmental criminology. For residential burglary, offenders tend to commit a crime near the communities or on streets with similar environmental characteristics and cultural background [44]. When offenders are confronted with various resistances of crime prevention from the outside world, they will subconsciously follow the fundamental principles of criminal psychology to choose new targets [25].
The paper describes the diffusion effect of residential burglary risk through the non-homogeneous term. When crime occurs in a surface entity of house boundary, other areas with similar environmental characteristics will be searched, and will be given corresponding criminal risk values depending on similarity. The physical significance of non-homogeneous term in the diffusion equation is that there is an internal energy source in the system [37], which is considered the high-risk source produced temporarily by stimulation from any case inside the geographical space in the study area. In other words, based on the physical meaning of the diffusion equation, we considered the criminal cases that occurred at a given time and location to be exogenous stimulation (this does not mean that criminals come from the outside of the study area), and it lead to the temporary incensement of risk between the geographical entity with similar social environment which is described by non-homogeneous term in Equation 5. We considered this to be the internal attributes of the geographic space. When there has just been a crime, assume that the rate in geographic entities with similar environmental characteristics for new crimes will jump up temporarily. This jump declines the longer the geographic entities with specific environmental characteristics value goes without seeing a new crime, eventually falling back to the background rate. It is expressed as the equation below:
where, is the distribution function of residential burglary risk in geographic space ; is the diffusion
Which does change with time as assumed in the paper; and is used to control the weight of endogenous risk value. In this paper, and is the weight of specific environment characteristic and identically equals one.
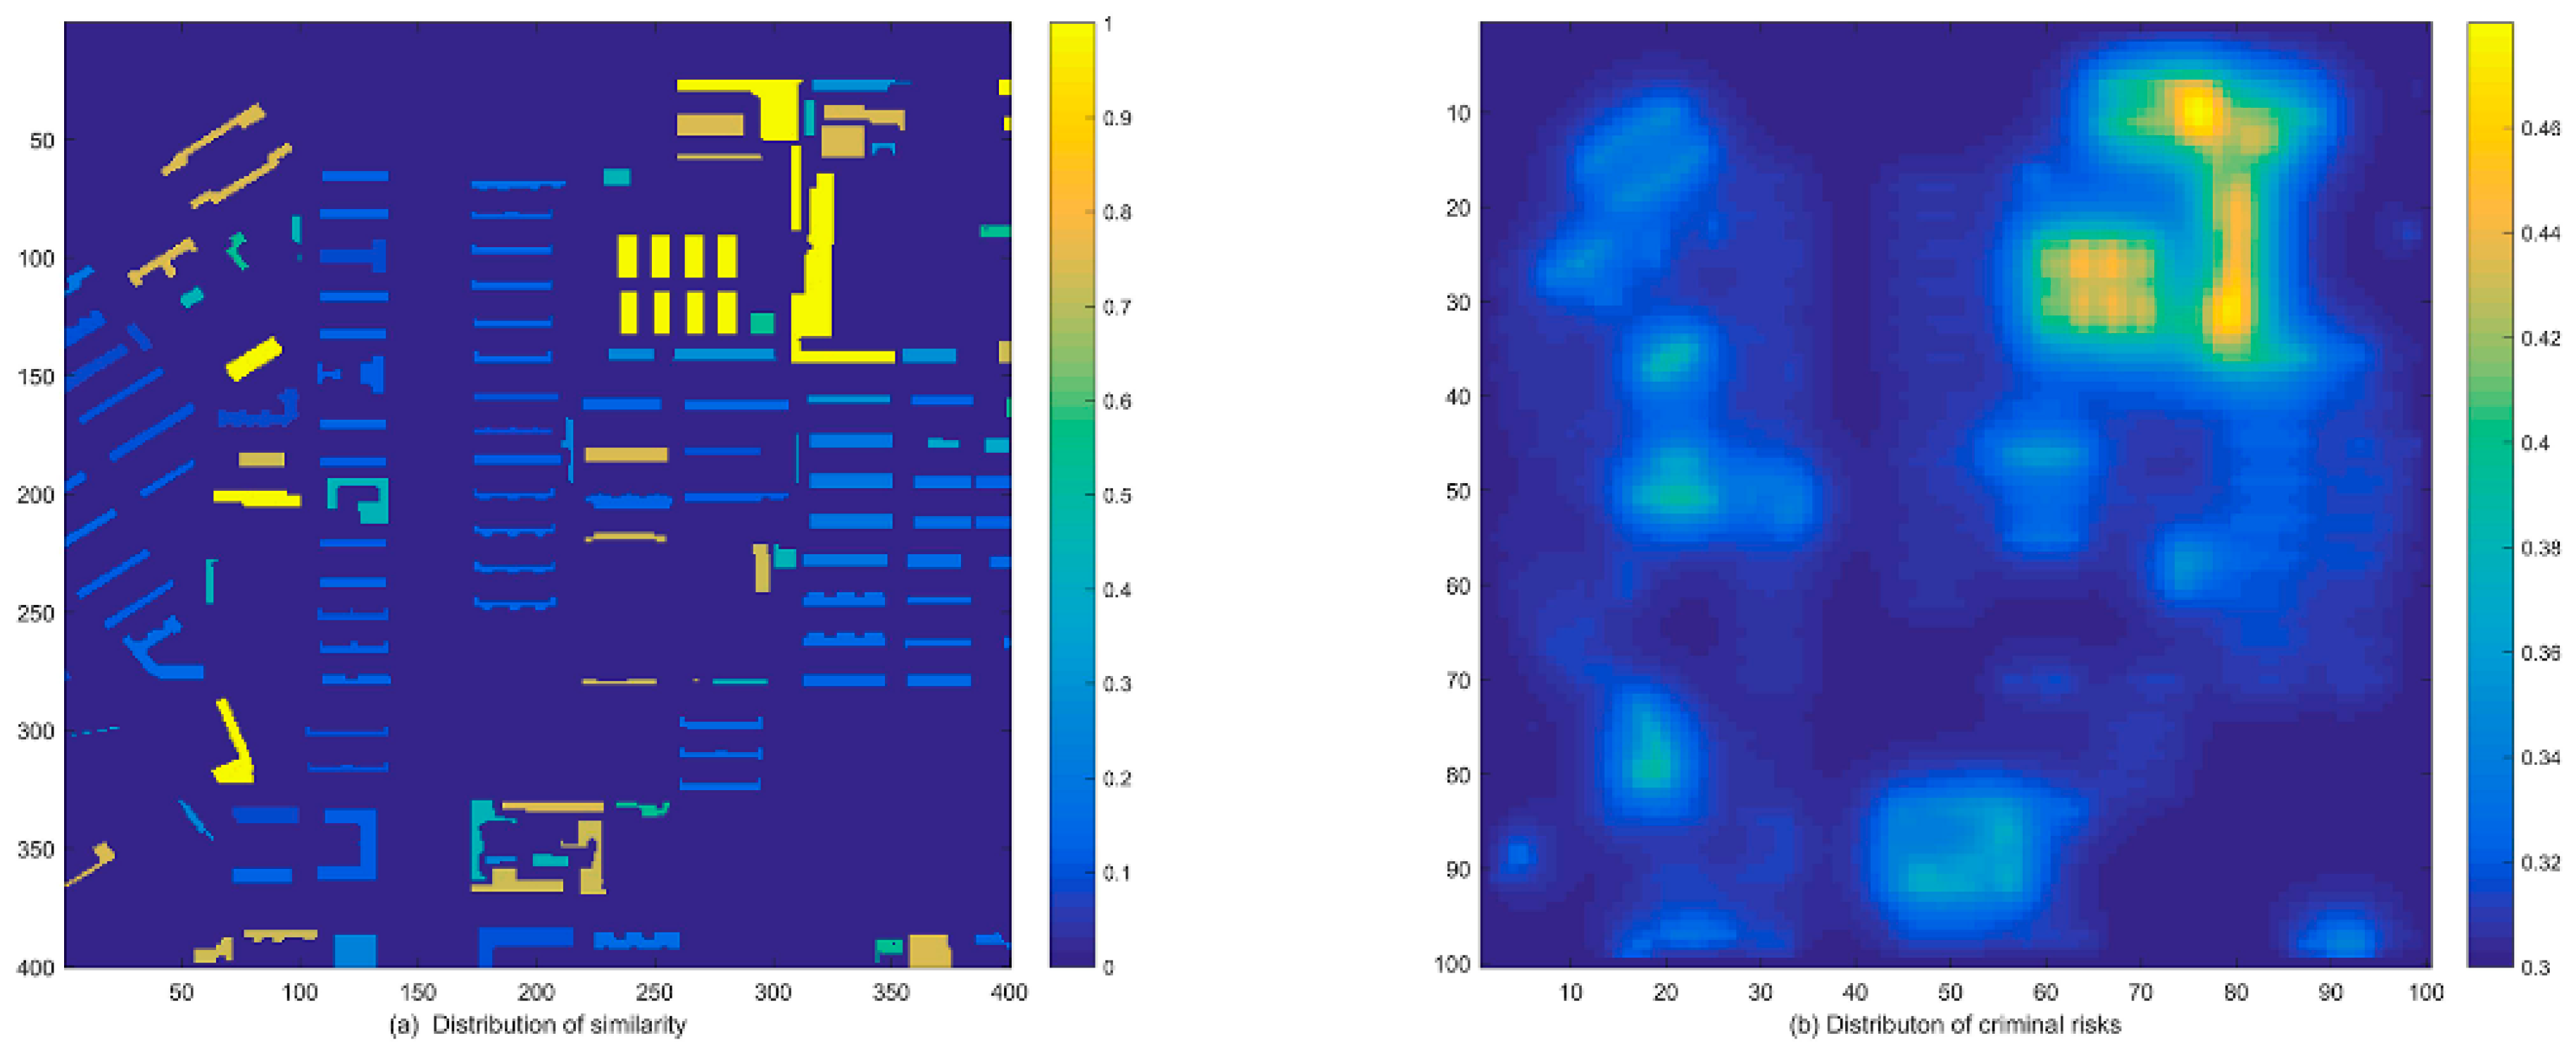
The result of simulated data of non-homogeneous diffusion is shown in the Figure 6:
4. Result and Discussion
4.1. Results
In order to describe the transfer effect of criminal risk in the experiment area, this paper uses the thematic attributes of date (format XX month XX day, XXXX year) in case data to divide 1117 pieces of case data into 1~12 months in 2014 and near-repeat analyze them respectively to learn about the spatial distribution in each month. The experimental results are shown in the Figure 7:
According to Equation (2), the distribution of household density is obtained as Figure 8:
The study region lies in the upper left of Qingshan District in Wuhan, where commercial residential quarters are concentrated. The formation of spatial distribution may be associated with the deployment of police forces, perfection of community security conditions etc. This paper attempts to describe the diffusion effect of crime hot spots mentioned above based on the research results of environmental criminology by using the similarity of environmental characteristics. Based on near-repeat theory, this paper considers not only the space-time proximity diffusion effect but also the displacement and diffusion effect in the surface entity of house boundary with similar environmental characteristics as the crime site. This paper sets the space-time diffusion distance of crime risks as 400 m 28 days based on the results of article [2] and regards the areas with the risk value over 30% as the areas in need of crime prevention.
Due to the linear nature of the diffusion equation, the non-homogeneous diffusion processes of different criminal cases can be accumulated based on superposition principle. Under the experiential environment in the paper, it takes about 0.05 seconds to process a case. With the progress of the diffusion procedure, the final results are compared (Figure 9 and Figure 10) by using the case data from January to June 2014 and they are analyzed as shown below with reference to the time-space distance of diffusion [2].
4.2. Discussion
This paper intends to use the precision ratio and recall ratio commonly used in information retrieval to quantify the experimental results. Recall and precision are the basic measurements used in evaluating search strategies of a retrieval system. In this paper, we use this concept to quantify the effectiveness of the algorithm. In retrieving pertinent literature collection, i.e., the ratio of the quantity of pertinent literature retrieved to the total quantity of pertinent literature in the retrieval system, the equation of precision ratio is generally expressed as:
where, is the quantity of correct information retrieved and is the quantity of extracted information.
The recall ratio, also known as accuracy, is an index used to measure the signal-noise ratio of a retrieval system, i.e., the ratio of the quantity of pertinent literature retrieved to the total quantity of retrieved literature, generally expressed as:
where, is the quantity of correct information retrieved and is the quantity of information in the sample.
The test method is as follows:
For the analysis results of near-repeat hot spots from January to December 2014, this paper selects the area with risk value over 30% in each month as the accumulated high risk area of residential burglary in the experimental region and the quantity of grids determined as high risk area is . The result is shown as Figure 11:
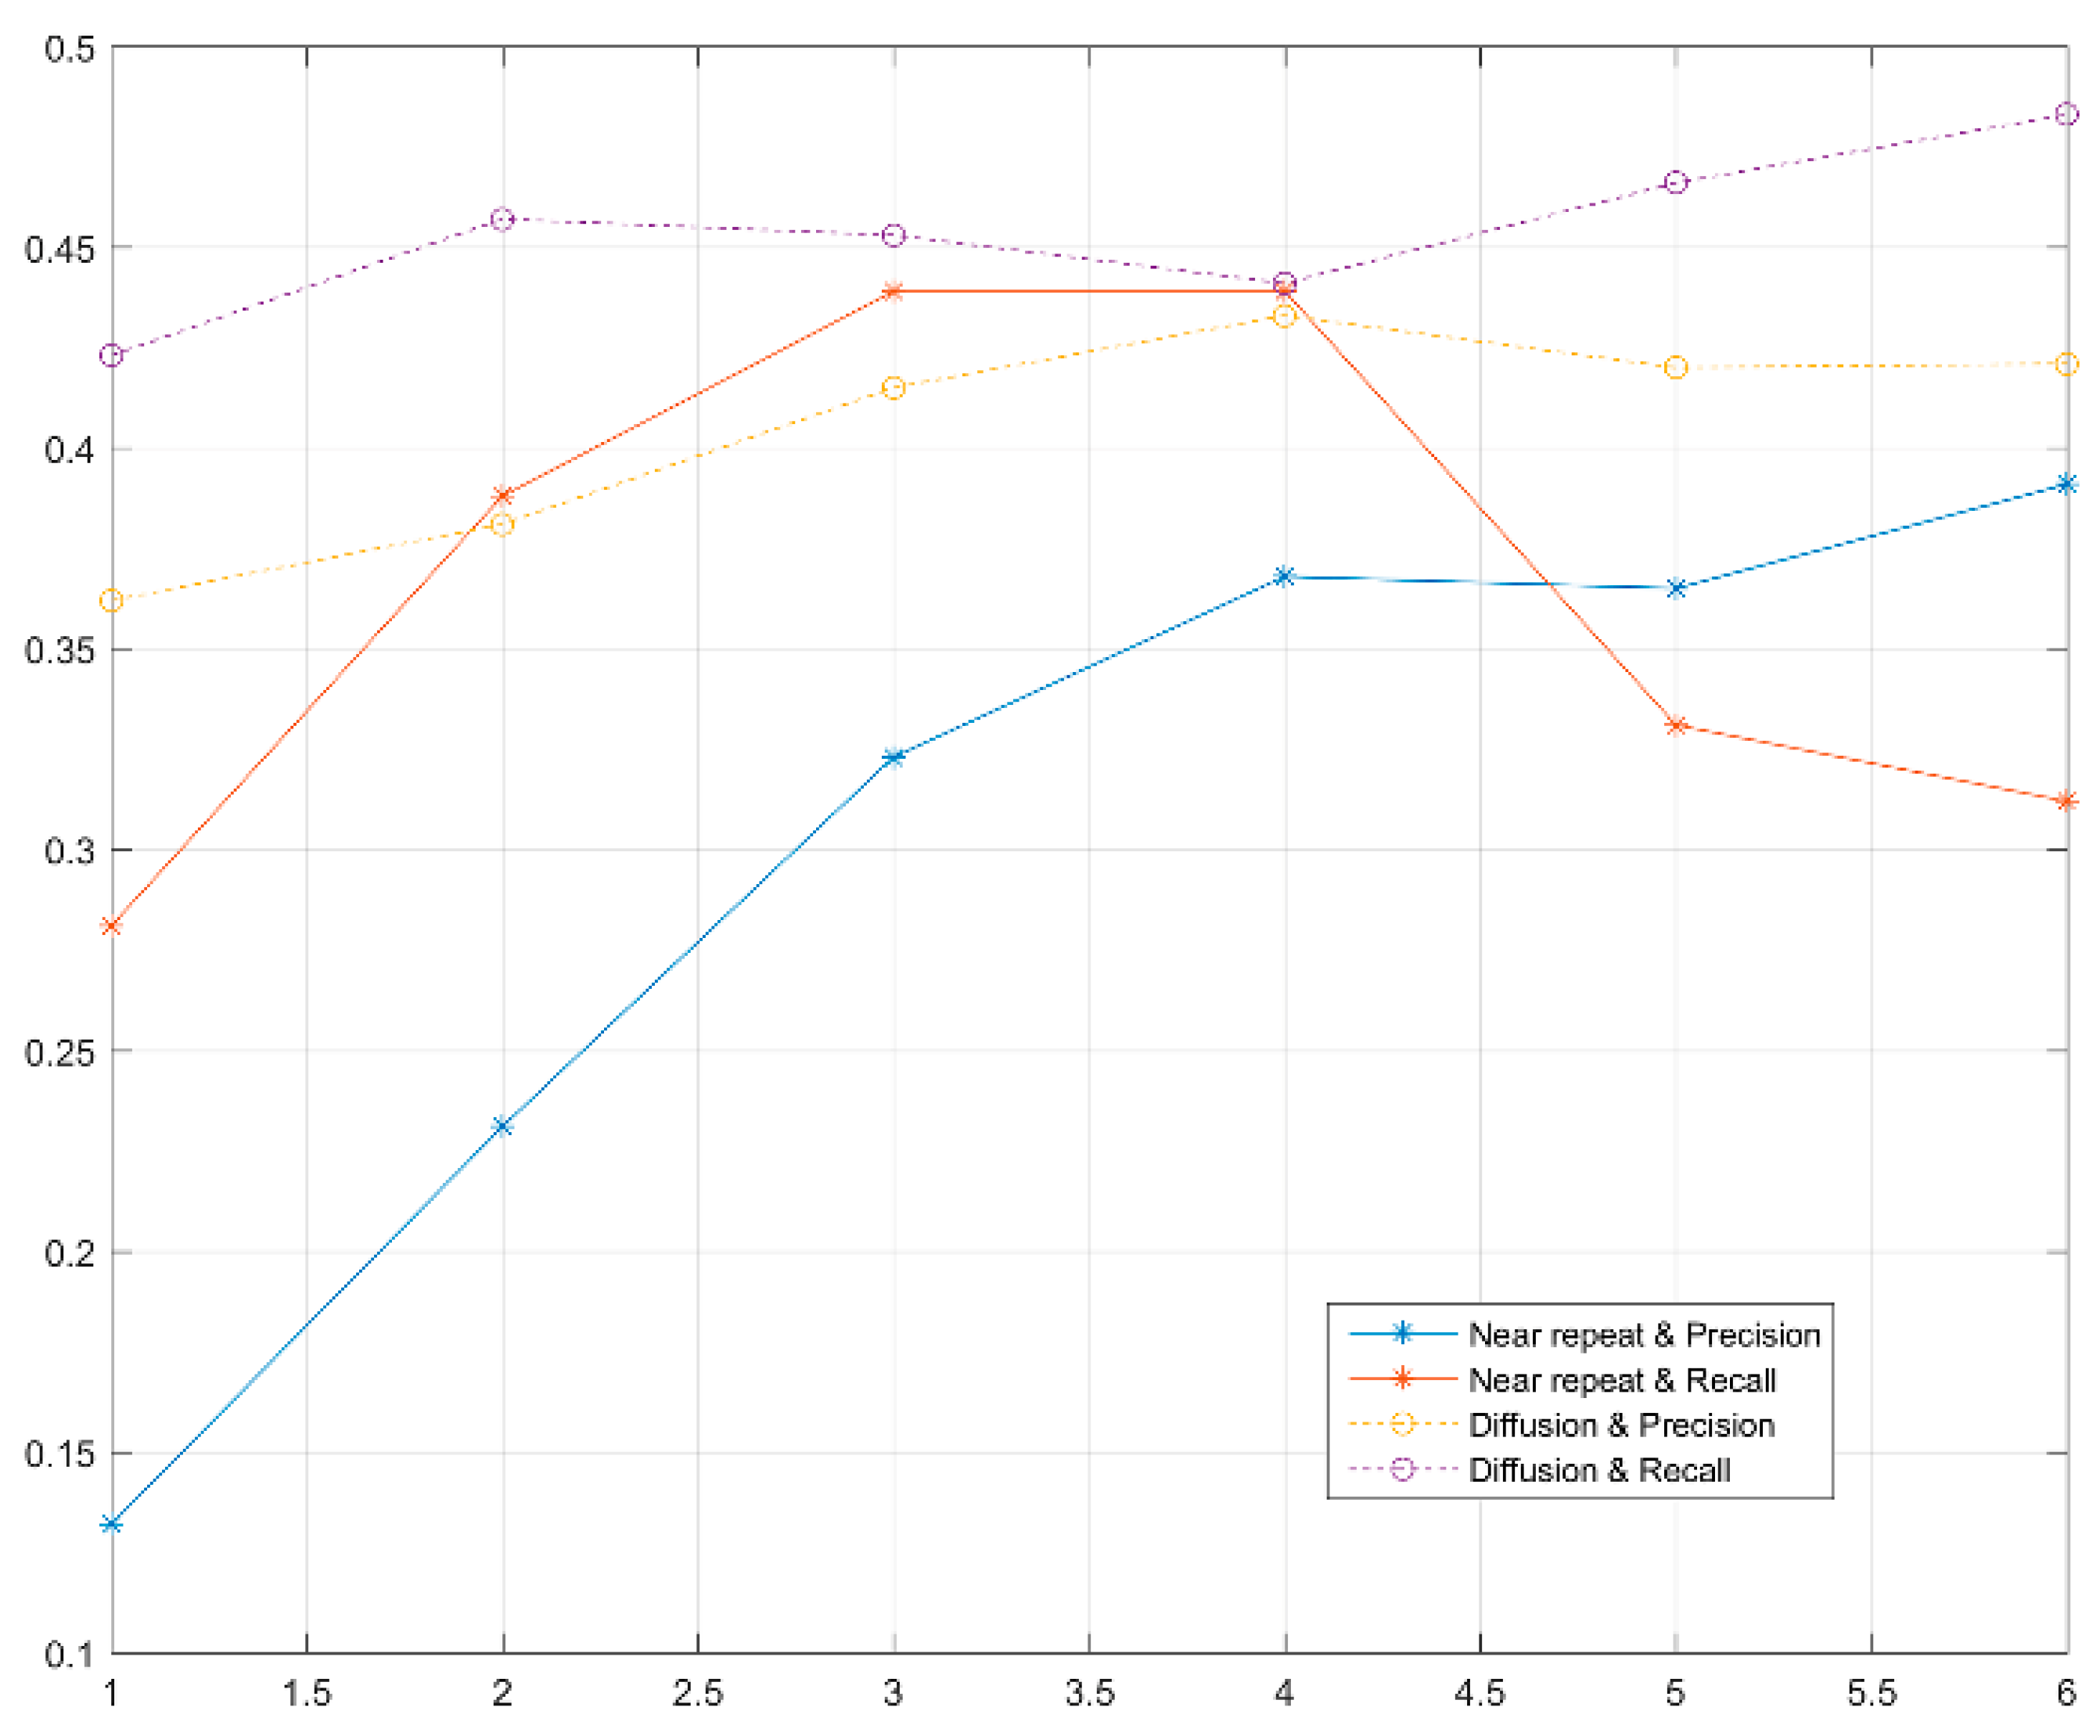
The hotspot of burglary cases from January to June were calculated by KDE and our method and compared with the hotspot of burglary cases from July to December. To compare the estimated results of risk value of residential burglary from the near-repeat analysis method and from the method in this paper, this paper assumes that only the data from January to June 2014 is known. Calculation is made six times respectively using both analysis methods and the experimental data is increased gradually every time and every month. The area with risk value over 30% is still deemed as the high-risk area requiring crime prevention. The results from the method in this paper and from the traditional near-repeat analysis method respectively are respectively and . The number of grids not equal to 0 is counted and calculated as and respectively, which correspond to the amount of extracted information . Next, and are intersected with the high-risk area to get and which correspond to the amount of extracted correct information . The high-risk area from June to December 2014 corresponds to verifying samples. The recall ratio and precision ratio are then calculated respectively to get the analysis results shown in the Figure 12:
As shown in the figure above, the precision ratio shows that crime risk estimations can be derived more precisely by using fewer data. The result of our method is stable and less affected by case data volume because of the introduction of environmental characteristics. The recall ratio shows that traditional near-repeat analysis will increase the number of invalid high risk areas and reduce the recall ratio when the data volume increases, but the method in this paper is much less affected. The calculations from January to June 2014 also indicate that the high-risk areas which fail to be discovered by historical data can be found by the method in this paper to achieve the expected purpose.
5. Conclusions
This paper not only considers the near-repeat effect about geographic space and date of cases, but also uses the “near-repeat effect” of environmental characteristics to facilitate the discovery of overall distribution rules of residential burglaries. The non-homogenous diffusion equation is utilized to establish models for proximity diffusion and global transfer of criminal risk values. The space-time distribution and environmental characteristics of residential burglaries are associated by referring to the research results of environmental criminology, and the relationship analyzed in this paper can not only provide direct and practical guidance to local policing practices, but can also add valuable information to the understanding of criminogenic mechanisms. Meanwhile, as a model that is convenient for extension, the standardized quantification process of environmental characteristics in the study area lays a solid foundation for criminal risk analysis and crime prevention in the future.
There are some limitations in this paper. First, the data of housing boundary are only used as a spatial constraint in the article, without considering the information of spatial structure, which is one of the important factors of the social environment, and further study can focus on the usage of housing boundary as space syntax [21,45,46,47]. Second, due to the sensitivity of data, the thematic attributes available for analysis is limited to household density, and more data related to residential burglary should be collected in the future, mainly covering the following categories.
- (a)
- Economy: quantity or density of commercial buildings (stores, supermarkets and commercial centers) and housing price of community.
- (b)
- Geographical factors: density of high-rise buildings and low-rise buildings, urban village or not. population: quantity of permanent residents and migrants, rate of rental households, rate of private households, unemployment rate etc.
- (c)
- Nature of land utilization: road, square, settlement place and public facilities.
- (d)
- Risk factors: distribution of security cameras and police offices in communities. All the data above can be associated with surface geographic entities directly.
It is necessary to consider the quantification methods and effects of environment characteristics on residential burglary. These characteristics include connectivity of roads, police force deployment, quantity or density of bus stops, density of intersections, density of road network, etc.; these factors cannot be associated with surface geological entities directly.
Acknowledgments
The authors thank Wuhan Public Security Bureau for providing data for the research., This work has been supported by National key R & D program (2016YFB0502204), National Science & Technology Pillar Program (2012BAH35B03), LIESMARS (State Key Laboratory of Information Engineering in Surveying, Mapping and Remote Sensing, Wuhan University) Special Research Funding, and Research on key techniques of dynamic map with position-perceived (Key Open Fund, LIESMARS). The authors are grateful for the valuable comments and suggestions from anonymous reviewers.
Author Contributions
Conceived and designed the experiments: Y.T., X.Y., W.G., T.H. Performed the experiments: Y.T., X.Y., X.Z., W.G., T.H. Analyzed the data: Y.T., F.Y., F.Z. Wrote the paper: Y.T., X.Y., X.Z., W.G., T.H.
Conflicts of Interest
The authors declare no conflict of interest.
References
- Turlach, B.A. Bandwidth Selection in Kernel Density Estimation: A Review. Available online: http://www.stat.washington.edu/courses/stat527/s14/readings/Turlach.pdf (accessed on 27 May 2017).
- Ye, X.; Xu, X.; Lee, J.; Zhu, X.; Wu, L. Space–time interaction of residential burglaries in Wuhan, China. Appl. Geogr. 2015, 6, 210–216. [Google Scholar] [CrossRef]
- Wu, L.; Liu, X.; Ye, X.; Leipnik, M.; Lee, J.; Zhu, X. Permeability, space syntax, and the patterning of residential burglaries in urban China. Appl. Geogr. 2015, 60, 261–265. [Google Scholar] [CrossRef]
- Sherman, L.W.; Gartin, P.R.; Buerger, M.E. Hot spots of predatory crime: Routine activities and the criminology of place. Criminology 1989, 27, 27–56. [Google Scholar] [CrossRef]
- Ye, X.; Wu, L. Analyzing the dynamics of homicide patterns in Chicago: ESDA and spatial panel approaches. Appl. Geogr. 2011, 31, 800–807. [Google Scholar]
- Wu, L.; Xu, X.; Ye, X.; Zhu, X. Repeat and near-repeat burglaries and offender involvement in a large Chinese city. Cartogr. Geogr. Inf. Sci. 2015, 42, 178–189. [Google Scholar] [CrossRef]
- Gerber, M.S. Predicting crime using Twitter and kernel density estimation. Decis. Support Syst. 2014, 61, 115–125. [Google Scholar] [CrossRef]
- Brantingham, P.J. Encyclopedia of Criminology and Criminal Justice. In Environmental Criminology; Springer: New York, NY, USA, 2014. [Google Scholar]
- Wortley, R.; Mazerolle, L.G. Environmental Criminology and Crime Analysis; Willan Publishers: London, UK, 2008. [Google Scholar]
- Wartell, J.; Gallagher, K. Translating Environmental Criminology Theory into Crime Analysis Practice. Policing 2012, 6, 377–387. [Google Scholar] [CrossRef]
- Silverman, B.W. Density Estimation for Statistics and Data Analysis. Available online: https://books.google.ch/books?hl=zh-CN&lr=&id=e-xsrjsL7WkC&oi=fnd&pg=PR9&dq=Density+estimation+for+statistics+and+data+analysis&ots=iwSqmn0HWq&sig=t6MJ3a9lBzh8scgvNvyyG2YpdMo&redir_esc=y#v=onepage&q=Density%20estimation%20for%20statistics%20and%20data%20analysis&f=false (accessed on 27 May 2017).
- Tobler, W.R. A computer movie simulating urban growth in the Detroit region. Econ. Geogr. 1970, 46, 234–240. [Google Scholar] [CrossRef]
- Taylor, R.B.; Gottfredson, S.D.; Brower, S. Block crime and fear: Defensible space, local social ties, and territorial functioning. J. Res. Crime Delinq. 1984, 21, 303–331. [Google Scholar] [CrossRef]
- Burgers, J.M. The Nonlinear Diffusion Equation: Asymptotic Solutions and Statistical Problems. Available online: https://books.google.com.hk/books?hl=zh-CN&lr=&id=U5vnCAAAQBAJ&oi=fnd&pg=PP8&dq=The+nonlinear+diffusion+equation:+asymptotic+solutions+and+statistical+problems&ots=SIIiBsqnfE&sig=y8_eEzMU5a-9Yw0oAc3to8LMNv4&redir_esc=y&hl=zh-CN&sourceid=cndr#v=onepage&q=The%20nonlinear%20diffusion%20equation%3A%20asymptotic%20solutions%20and%20statistical%20problems&f=false (accessed on 27 May 2017).
- Brantingham, P.J.; Brantingham, P.L. Anticipating the displacement of crime using the principles of environmental criminology. Crime Prev. Stud. 2003, 16, 119–148. [Google Scholar]
- Braga, A.A. The effects of hot spots policing on crime. Ann. Am. Acad. Political Soc. Sci. 2001, 578, 104–125. [Google Scholar] [CrossRef]
- Heidenreich, N.B.; Schindler, A.; Sperlich, S. Bandwidth selection for kernel density estimation: A review of fully automatic selectors. AsTA Adv. Stat. Anal. 2013, 97, 403–433. [Google Scholar] [CrossRef]
- Johnson, S.D.; Bowers, K.J. The burglary as clue to the future the beginnings of prospective hot-spotting. Eur. J. Criminol. 2004, 1, 237–255. [Google Scholar] [CrossRef]
- Wu, L.; Ye, X.; Webb, D. Space-time analysis of auto burglary patterns in a fast-growing small city. Int. J. Appl. Geosp. Res. 2012, 3, 69–86. [Google Scholar] [CrossRef]
- Weisburd, D.; Wyckoff, L.A.; Ready, J.; Eck, J.E.; Hinkle, J.C.; Gajewski, F. Does crime just move around the corner? A controlled study of spatial displacement and diffusion of crime control benefits. Criminology 2006, 44, 549–592. [Google Scholar] [CrossRef]
- Short, M.B.; D’Orsogna, M.R.; Brantingham, P.J.; Tita, G.E. Measuring and modeling repeat and near-repeat burglary effects. J. Quant. Criminol. 2009, 25, 325–339. [Google Scholar] [CrossRef]
- Townsley, M.; Homel, R.; Chaseling, J. Repeat burglary victimisation: Spatial and temporal patterns. Aust. N. Z. J. Criminal. 2000, 33, 37–63. [Google Scholar] [CrossRef]
- Wang, N.; Liu, L.; Eck, J.E. Analyzing crime displacement with a simulation approach. Environ. Plan. B Abstr. 2014, 41, 359–374. [Google Scholar] [CrossRef]
- Haskell, R.C.; Svaasand, L.O.; Tsay, T.T.; Feng, T.-C.; McAdams, M.S.; Tromberg, B.J. Boundary conditions for the diffusion equation in radiative transfer. JOSA A 1994, 11, 2727–2741. [Google Scholar] [CrossRef] [PubMed]
- Ripley, B.D. Modelling spatial patterns. J. R. Stat. Soc. Ser. B (Meth.) 1977, 39, 172–212. [Google Scholar]
- Di Bella, E.; Corsi, M.; Leporatti, L.; Persico, L. The Spatial Configuration of Urban Crime Environments and Statistical Modeling. Available online: http://0-journals-sagepub-com.brum.beds.ac.uk/doi/full/10.1177/0265813515624686 (accessed on 27 May 2017).
- Sagovsky, A.; Johnson, S.D. When does repeat burglary victimisation occur? Aust. N. Z. J. Criminol. 2007, 40, 1–26. [Google Scholar]
- Bernasco, W. Them again? Same-offender involvement in repeat and near repeat burglaries. Eur. J. Criminol. 2008, 5, 411–431. [Google Scholar] [CrossRef]
- Cornish, D.B.; Clarke, R.V. Understanding crime displacement: An application of rational choice theory. Criminology 1987, 25, 933–948. [Google Scholar] [CrossRef]
- Guerette, R.T.; Bowers, K.J. Assessing the extent of crime displacement and diffusion of benefits: A review of situational crime prevention evaluations. Criminology 2009, 47, 1331–1368. [Google Scholar] [CrossRef]
- Andresen, M.A.; Malleson, N. Police Foot Patrol and Crime Displacement. J. Contemp. Crim. Justice 2014, 30, 186–199. [Google Scholar] [CrossRef]
- Kolmogoroff, A.; Petrovsky, I.; Piscounoff, N. Study of the diffusion equation with growth of the quantity of matter and its application to a biology problem. Dyn. Curved Front. 2012. [Google Scholar] [CrossRef]
- Townsley, M.; Homel, R.; Chaseling, J. Infectious burglaries. A test of the near repeat hypothesis. Br. J. Criminol. 2003, 43, 615–633. [Google Scholar] [CrossRef]
- Ames, W.F. Nonlinear Partial Differential Equations; Academic press: New York, NY, USA, 1967. [Google Scholar]
- Morgan, F. The Encyclopedia of Theoretical Criminology. In Displacement of Crime; John Wiley & Sons, Ltd.: Hoboken, NJ, USA, 2014. [Google Scholar]
- Barash, D. Fundamental relationship between bilateral filtering, adaptive smoothing, and the nonlinear diffusion equation. IEEE Trans. Pattern Anal. Mach. Intell. 2002, 24, 844–847. [Google Scholar] [CrossRef]
- Diggle, P.J.; Chetwynd, A.G.; Häggkvist, R.; Morris, S.E. Second-order analysis of space-time clustering. Stat. Methods Med. Res. 1995, 4, 124–136. [Google Scholar] [CrossRef] [PubMed]
- Warming, R.F.; Beam, R.M. An extension of A-stability to alternating direction implicit methods. BIT Numer. Math. 1979, 19, 395–417. [Google Scholar] [CrossRef]
- Chen, P.; Yuan, H.; Li, D. Space-time analysis of burglary in Beijing. Secur. J. 2013, 26, 1–15. [Google Scholar] [CrossRef]
- Lynch, H.J.; Moorcroft, P.R. A spatiotemporal Ripley’s K-function to analyze interactions between spruce budworm and fire in British Columbia, Canada. Can. J. For. Res. 2008, 38, 3112–3119. [Google Scholar] [CrossRef]
- Peaceman, D.W.; Rachford, J.H.H. The numerical solution of parabolic and elliptic differential equations. J. Soc. Ind. Appl. Math. 1955, 3, 28–41. [Google Scholar] [CrossRef]
- Deng, D.; Zhang, C. A new fourth-order numerical algorithm for a class of three-dimensional nonlinear evolution equations. Numer. Methods Partial Differ. Equ. 2013, 29, 102–130. [Google Scholar] [CrossRef]
- Brantingham, P.; Brantingham, P. Criminality of place. Eur. J. Crim. Policy Res. 1995, 3, 5–26. [Google Scholar] [CrossRef]
- O’Sullivan, D.; Wong, D.W.S. A Surface-Based Approach to Measuring Spatial Segregation. Geogr. Anal. 2007, 39, 147–168. [Google Scholar] [CrossRef]
- Summers, L.; Johnson, S.D. Does the Configuration of the Street Network Influence Where Outdoor Serious Violence Takes Place? Using Space Syntax to Test Crime Pattern Theory. J. Quant. Criminol. 2017, 33, 397–420. [Google Scholar] [CrossRef]
- Hillier, B. Space is the Machine: A Configurational Theory of Architecture; Space Syntax: London, UK, 2007; pp. 333–335. [Google Scholar]
- Jacobs, J. The Death and Life of Great American Cities; Vintage Books: New York, NY, USA, 1992. [Google Scholar]
Figure 1.
Analysis of nearly repeat.

Figure 2.
Housing boundary of experimental area and burglary data.

Figure 3.
Density of household.

Figure 4.
Measurement of similarity.

Figure 5.
The diffusion of the criminal risk.

Figure 6.
The transfer and diffusion of the criminal risk. The figures (a) shows the distribution of similarity to the household density of a certain criminal event, and the areas with high similarity mainly concentrate at top right; (b) shows the distribution of criminal risks when t = 40, v = 0.1 in the diffusion equation, and the areas with high crime risk are highlighted, and there is little or no police intervention if the risk value is higher than 30% of the reference value.

Figure 7.
Movement of criminal hot spots.

Figure 8.
Density of the household.

Figure 9.
Result of near repeat analysis.

Figure 10.
Result of our method.

Figure 11.
Regions of high criminal risk.

Figure 12.
Recall and precision.

© 2017 by the authors. Licensee MDPI, Basel, Switzerland. This article is an open access article distributed under the terms and conditions of the Creative Commons Attribution (CC BY) license (http://creativecommons.org/licenses/by/4.0/).
Share and Cite
MDPI and ACS Style
Tang, Y.; Zhu, X.; Guo, W.; Ye, X.; Hu, T.; Fan, Y.; Zhang, F. Non-Homogeneous Diffusion of Residential Crime in Urban China. Sustainability 2017, 9, 934. https://0-doi-org.brum.beds.ac.uk/10.3390/su9060934
AMA Style
Tang Y, Zhu X, Guo W, Ye X, Hu T, Fan Y, Zhang F. Non-Homogeneous Diffusion of Residential Crime in Urban China. Sustainability. 2017; 9(6):934. https://0-doi-org.brum.beds.ac.uk/10.3390/su9060934
Chicago/Turabian StyleTang, Yicheng, Xinyan Zhu, Wei Guo, Xinyue Ye, Tao Hu, Yaxin Fan, and Faming Zhang. 2017. "Non-Homogeneous Diffusion of Residential Crime in Urban China" Sustainability 9, no. 6: 934. https://0-doi-org.brum.beds.ac.uk/10.3390/su9060934
Note that from the first issue of 2016, this journal uses article numbers instead of page numbers. See further details here.