Investigation of Indoor Air Quality and the Identification of Influential Factors at Primary Schools in the North of China


Department of Architecture and Built Environment, the University of Nottingham Ningbo China, 199 Taikang East Road, Ningbo 315100, China
*
Author to whom correspondence should be addressed.
Sustainability 2017, 9(7), 1180; https://0-doi-org.brum.beds.ac.uk/10.3390/su9071180
Submission received: 13 May 2017
/
Revised: 28 June 2017
/
Accepted: 1 July 2017
/
Published: 5 July 2017
(This article belongs to the Section Sustainable Engineering and Science)
Abstract
:Over 70% of a pupil’s school life is spent inside a classroom, and indoor air quality has a significant impact on students’ attendance and learning potential. Therefore, the indoor air quality in primary school buildings is highly important. This empirical study investigates the indoor air quality in four naturally ventilated schools in China, with a focus on four parameters: PM2.5, PM10, CO2, and temperature. The correlations between the indoor air quality and the ambient air pollution, building defects, and occupants’ activities have been identified and discussed. The results indicate that building defects and occupants’ activities have a significant impact on indoor air quality. Buildings with better air tightness have a relatively smaller ratio of indoor particulate matter (PM) concentrations to outdoor PM concentrations when unoccupied. During occupied periods, the indoor/outdoor (I/O) ratio could be larger than 1 due to internal students’ activities. The indoor air temperature in winter is mainly determined by occupants’ activities and the adiabatic ability of a building’s fabrics. CO2 can easily exceed 1000 ppm on average due to the closing of windows and doors to keep the inside air warmer in winter. It is concluded that improving air tightness might be a way of reducing outdoor air pollutants’ penetration in naturally ventilated school buildings. Mechanical ventilation with air purification could be also an option on severely polluted days.
1. Introduction
China has been experiencing serious air pollution problems in recent years, due to rapid industrialization, urbanization, and increasing energy consumption [1,2,3]. The Chinese economy is still largely dependent on fossil fuels. In 2011, 69% of total energy consumption was contributed by coal combustion, 18% by oil, and 4% by natural gas. Only 8% of the national energy mix was from renewable sources such as hydroelectric, solar, and wind [4]. As a result, the ambient air has been heavily affected, especially in urban areas. Only 5 cities out of 367 in China met the World Health Organization (WHO)’s recommended air quality standards in 2012. The primary air pollutant in Chinese cities has been identified as suspended particulate matters (PMs), specifically, PM2.5 and PM10. PM10 denotes inhalable particles with diameters that are generally 10 micrometers and smaller. PM2.5 denotes fine inhalable particles with diameters that are generally 2.5 micrometers and smaller [5]. The readings of PM2.5 concentrations in most urban areas have exceeded acceptable national standards, and are often worse in winter in the north of China due to fuel combustion for heating [6]. High exposure to particulate matters can bring morbidity problems like asthma, lung cancer, cardiovascular disease, respiratory diseases, birth defects, and premature death. Logue et al. [7] suggested that PM2.5 is one of the air pollutants which dominate health impacts in most U.S. residences due to chronic exposure. Such air pollutants lead to greater losses of disability-adjusted life-years (DALYs). Sundell et al. [8] concluded that the incidence of inflammation, respiratory infections, asthma symptoms, and short-term sickness is enhanced as a result of high exposure to air pollutants. Therefore, urban residents have to reduce the time they stay outdoors and their level of activity. However, it may not be safer to stay indoors, as some studies suggest that indoor air quality closely correlates to the outdoor pollution level, particularly in urban and industrial areas [9]. Another important factor which affects indoor air quality is building defects. Riley et al. [10] suggested that the penetration of particles through building cracks would significantly affect indoor air quality, especially for buildings where air exchange through openings or cracks is dominated by pressure differences arising from natural forces. Tian et al. [11] concluded that for naturally ventilated buildings, the key factors which determine occupants’ exposure to air pollutants were pressure difference, building air tightness, and air flow path. In addition, PM also can be generated by indoor activities, such as cooking, cleaning, cigarette smoking, and the movement of people. Abt et al. [12] found that cleaning activities and the movement of people significantly increased PM(0.7–10) concentrations by 0.27 μm3/cm3 and 0.25 μm3/cm3, respectively, per minute in domestic buildings in Boston. Long et al. [13] investigated nine homes in Boston and figured out that dusting, vigorous walking, and sautéing were the key factors affecting indoor air quality.
Apart from particulate matters, indoor air quality also can be affected by other parameters, such as carbon dioxide (CO2) level and indoor air temperature. Seppänen et al. [14] found that the risk of air-related health problems can be decreased when CO2 concentrations fall below 800 ppm. Fang et al. [15] indicated that indoor air temperature has great impact on perceived air quality in office buildings, and high air temperatures can promote the generation of other pollutants, such as volatile organic compounds (VOCs) and formaldehyde.
Children are more sensitive when they are exposed to unhealthy air, because they generally breathe a higher volume of air relative to body weight at a faster rate [16,17]. Bakó-Biró et al. [18] figured out that over 30% of a pupil’s life was spent at schools, and about 70% of their time inside a classroom during school days. Shauhnessy et al. [19] claimed that poor indoor air quality caused by excessive CO2 and VOC concentrations have a negative impact on students’ attendance and learning potential, and lead to poor academic performance. Therefore, indoor air quality in school buildings is highly important, and may have a significant impact on a nation’s healthcare system. Haverinen-Shaughnessy et al. [20] investigated one hundred elementary schools in the southwest of the U.S. and found that 87% of the classrooms had air quality problems. Studies have also pointed out that indoor air pollutant concentrations in classrooms, such as CO2, PM, and VOCs are greatly influenced by air pollution sources outside the school, primarily traffic and industrial emissions [21,22,23,24].
The PM concentration inside classrooms is partly determined by infiltration from the outside air. Zwoździak et al. [25] concluded that there is a positive correlation between outdoor air pollution and indoor air quality, suggesting that urgent action should be taken to improve a building’s air tightness and reduce air infiltration. Amato et al. [26] investigated 39 primary schools in Barcelona and found that 53% of the indoor PM2.5 concentration measured could be traced back to seven outdoor sources in the ambient environment. Moreover, schools without paved playgrounds have an increased contribution by 5–6 μg/m3 on average compared to those with paved playgrounds. Janssen et al. [27] pointed out that schools close to roadways with heavy traffic usually have higher numbers of children suffering from bronchial hyper responsiveness, positive allergic sensitization, or both, compared with schools located far away from the traffic or industrial areas.
In school buildings, the resuspension of particles by students’ indoor activities also affects the indoor particle concentration in occupied classrooms [28,29]. Lefcoe and Inculet [30] found that indoor activities, such as cleaning and children playing, had significant impacts on the indoor concentration of particles greater than 1 μm. Raunemaa et al. [31] reported that the average concentration of particles larger than 1.5 μm highly depends on the amount of time spent indoors. Another study from Majumdar et al. [32] indicated that PM2.5 and PM10 also can be produced when writing on the blackboard in a classroom.
Apart from those chemical toxicants and particulate matters, it is found that the CO2 level may exceed 1500 ppm in classrooms in East London, which is much higher than the recommended level of 600 ppm from the Chartered Institution of Building Services Engineers (CIBSE) [33]. Ramalho et al. [34] investigated the indoor CO2 concentration in 489 mechanically ventilated classrooms in France, and the results indicated that 33% of the samples had a CO2 concentration above 1700 ppm, which is two times greater than the CIBSE value.
In China, mechanical ventilation systems are not commonly used in public primary schools, and the only way to introduce fresh air into a classroom is to open windows and doors; however, particles and other air pollutants will be brought into the classroom simultaneously. Moreover, in winter, when the air pollution is the most serious in China, doors and windows are often closed to keep the inside warm. This may lead to two consequences: inadequate fresh air supply, and increased indoor air pollution from the combined effect of air penetration and indoor activity.
Currently research related to indoor air quality in China has been focused on chemical toxicants, such as formaldehyde and benzene. Most studies were carried out in office buildings and residential houses. The indoor air quality in primary school buildings and the influential factors affecting indoor air quality (IAQ) have not been extensively investigated. Therefore, this empirical study aims to investigate indoor air quality in primary school buildings in China and identify the opportunities for improvement.
2. Research Methodology
This research involves four case studies for primary schools in the North of China. These schools are all naturally ventilated, and were built in different times in compliance with different building construction codes. Field measurements were conducted in the selected classrooms in the four schools. The investigations and observations were also carried out with a focus on building defects and indoor activities. The purpose was to examine the links between outdoor air pollution, indoor air quality, building defects, and indoor activities.
2.1. Case Study Schools
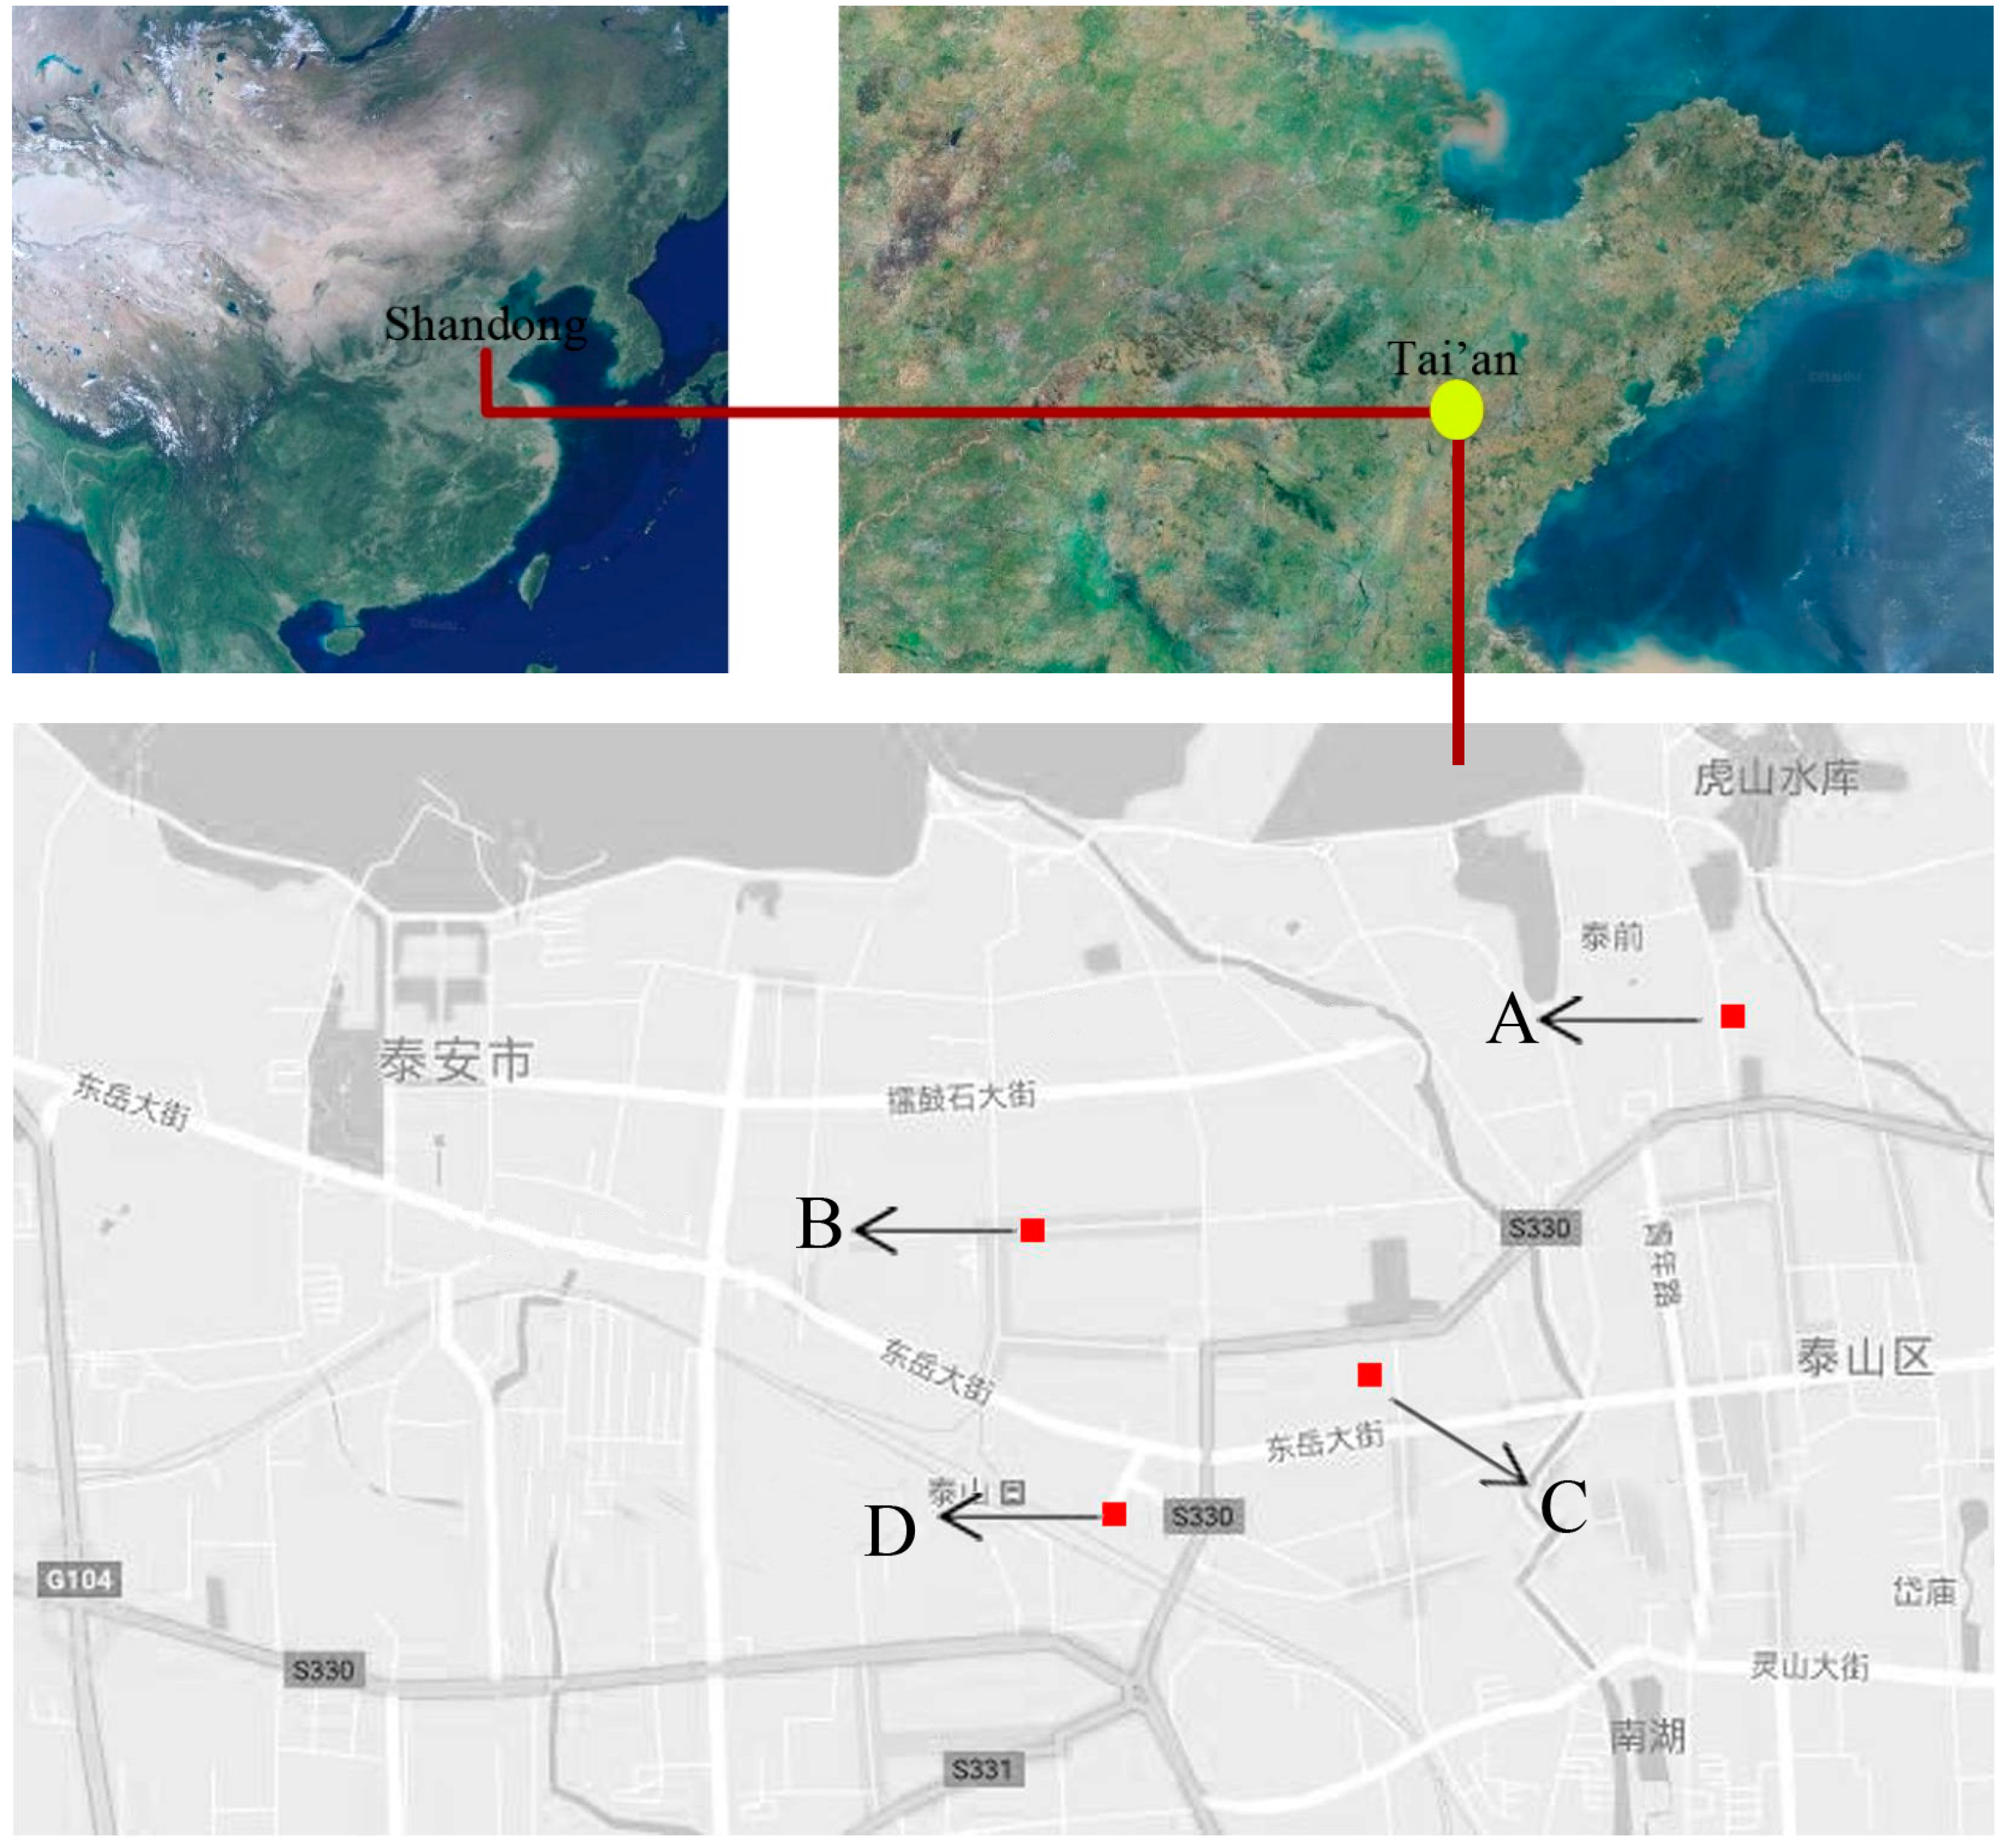
Four primary schools in Tai’an city were selected as case studies (Figure 1). Table 1 summarizes the characteristics of the selected school buildings. It should be noted that all of the classrooms selected have a similar floor area and floor height, and the same number of students, to facilitate comparisons. On the other hand, these buildings were built in different times, which leads to varying building compliances. For example, School D was completed in 2005, when the China Public Building Energy Saving Standard (GB50189-2005) [35] took effect, so external insulation, double glazed windows, and air tightness (level) were implemented. School B was completed in 2015 in accordance with the new version of the China Public Building Energy Saving Standard (GB50189-2015) therefore it has better insulation (lower U-values) and higher air tightness (level 6) compared to School D. Natural ventilation dominates air exchange in all measured school buildings. Thus, when doors and windows are closed, fresh air is brought in through gaps and cracks through the envelope. It is also noted that a heating system is not installed in these buildings, thus closing windows and doors helps to keep stable indoor temperatures in winter. This reduces air pollutant intake from outdoors; however the indoor air may become stale and unhealthy due to inadequate fresh air supply.
2.2. Field Measurements
Since the central heating system in Tai’an annually heats the buildings from 15 November, and the heavy air pollution always happens after the system starts working, field measurements were carried out from 20 November 2016 to 10 December 2016. The measured parameters were particulate matter (PM2.5 and PM10), CO2, and indoor air temperature. The results were then compared to the recommended values from the China Indoor Air Quality Standard (GBT18883-2002), the World Health Organization (WHO), and the Chartered Institution of Building Services Engineers (CIBSE) (Table 2). In general, China has relatively lower requirements for PM2.5 and PM10. The annual mean value and 24 h mean value of PM2.5 in the Chinese Standards are 5 μg/m3 and 10 μg/m3 higher than the WHO values. Also, the recommended annual mean value of PM10 is two times greater. Regarding CO2 concentration, China sets 1000 ppm as the upper limit, while WHO has divided CO2 concentration into three levels, and the acceptable level is 600 ppm.
The measurements were conducted from 8:00 a.m. to 5:00 p.m. in a day. During the measuring hours, the windows were all closed due to low temperatures outside, and the measuring equipment was placed 1.5 m above the floor level at the center of the classrooms. A DUST TRAK model 8530 from TSI Inc., U.S. was used to measure the outdoor PM10 and PM2.5, since it makes more noise during the measuring period. The indoor PM10 and PM2.5 concentrations were measured by a portable hand-held detector of BRAMC-SMART-126 model from China. The DUST TRAK model 8530 cannot measure PM2.5 and PM10 simultaneously; therefore, the PM2.5 was measured in the morning and the PM10 was measured in the afternoon. The temperature and the CO2 were measured by a recording detector of HTV-M model from PPM Company, U.K.
In order to figure out the correlations between the indoor and the outdoor pollution level, measurements were also carried out during an unoccupied period in the same classrooms on weekends. There were no students inside and the classrooms were cleaned up in advance (e.g., dust and chalk ash were removed).
3. Measuring Results
3.1. PM2.5 and PM10
It can be seen from Table 3 that the performance of PM2.5 and PM10 of selected primary schools cannot meet the requirements of any indoor air quality standards. The average indoor PM2.5 and PM10 concentrations in occupied classrooms range from 199 μg/m3 to 149 μg/m3 and 205 μg/m3 to 138 μg/m3, respectively, which is 5 times higher than the requirements of the WHO’s and China’s standards. The highest value of PM2.5 reached 274 μg/m3 in School D, and the lowest value was 118 μg/m3 in School C. The highest level of indoor PM10 reached 267 μg/m3, which was found in School C, and the lowest reading of 80 μg/m3 was found in School A.
Table 4 shows the readings of indoor PM2.5 and PM10 concentrations in the same classrooms when they were not occupied. All of the indoor mean values of PM2.5 are above the annual standard and the 24 h guideline values of the WHO and the GBT18883-2002 of China. Schools A and B have mean PM10 values of 45 μg/m3 and 41 μg/m3, respectively, which satisfies the 24 h standard of the WHO and the GBT18883-2002 of China. The highest level of indoor PM2.5 and PM10 reached 221 μg/m3 and 191 μg/m3 in School D, and the lowest levels of 32 μg/m3 and 33 μg/m3 was found in School B.
3.2. Temperature
From Table 5 it can be seen that the schools cannot meet the requirement of thermal comfort based on the recommended values of 19 °C to 21 °C from CIBSE, except School B. The highest mean indoor air temperature was 19.4 °C and the lowest was 11.5 °C. During the measuring period, the highest temperature of 23 °C was recorded at School B, and the lowest temperature of 9 °C was recorded at School C. On average, School C had the worst performance, since the building is the oldest and has the weakest thermal condition and air tightness level. Schools A and D are ranked with average performance.
3.3. CO2
As shown in Table 6, the carbon dioxide mean levels all exceeded the WHO requirements (600 ppm) and China standard (1000 ppm) when the classrooms were occupied. The highest level of 4692 ppm measured was in School B, and the lowest level measured was 476 ppm in School A. The mean values range from 1237 ppm to 1932 ppm. There has been a wide variation in the results at the upper scale of the measured CO2, while at the lower scale, the measured results were very similar. This is because the CO2, produced from occupants is caused due to the different intensity of internal activities. In addition, when students have a lunch break, the CO2 concentration decreased and reached close to the outdoor CO2 concentration.
4. Discussion
The measured results have shown generally a low level of regulatory compliance. The mean values of PM2.5, PM10, and CO2 are not able to meet the recommended standard values. In addition, indoor comfort is not satisfied in most of the schools investigated.
4.1. Effects from Outdoor Air Environment
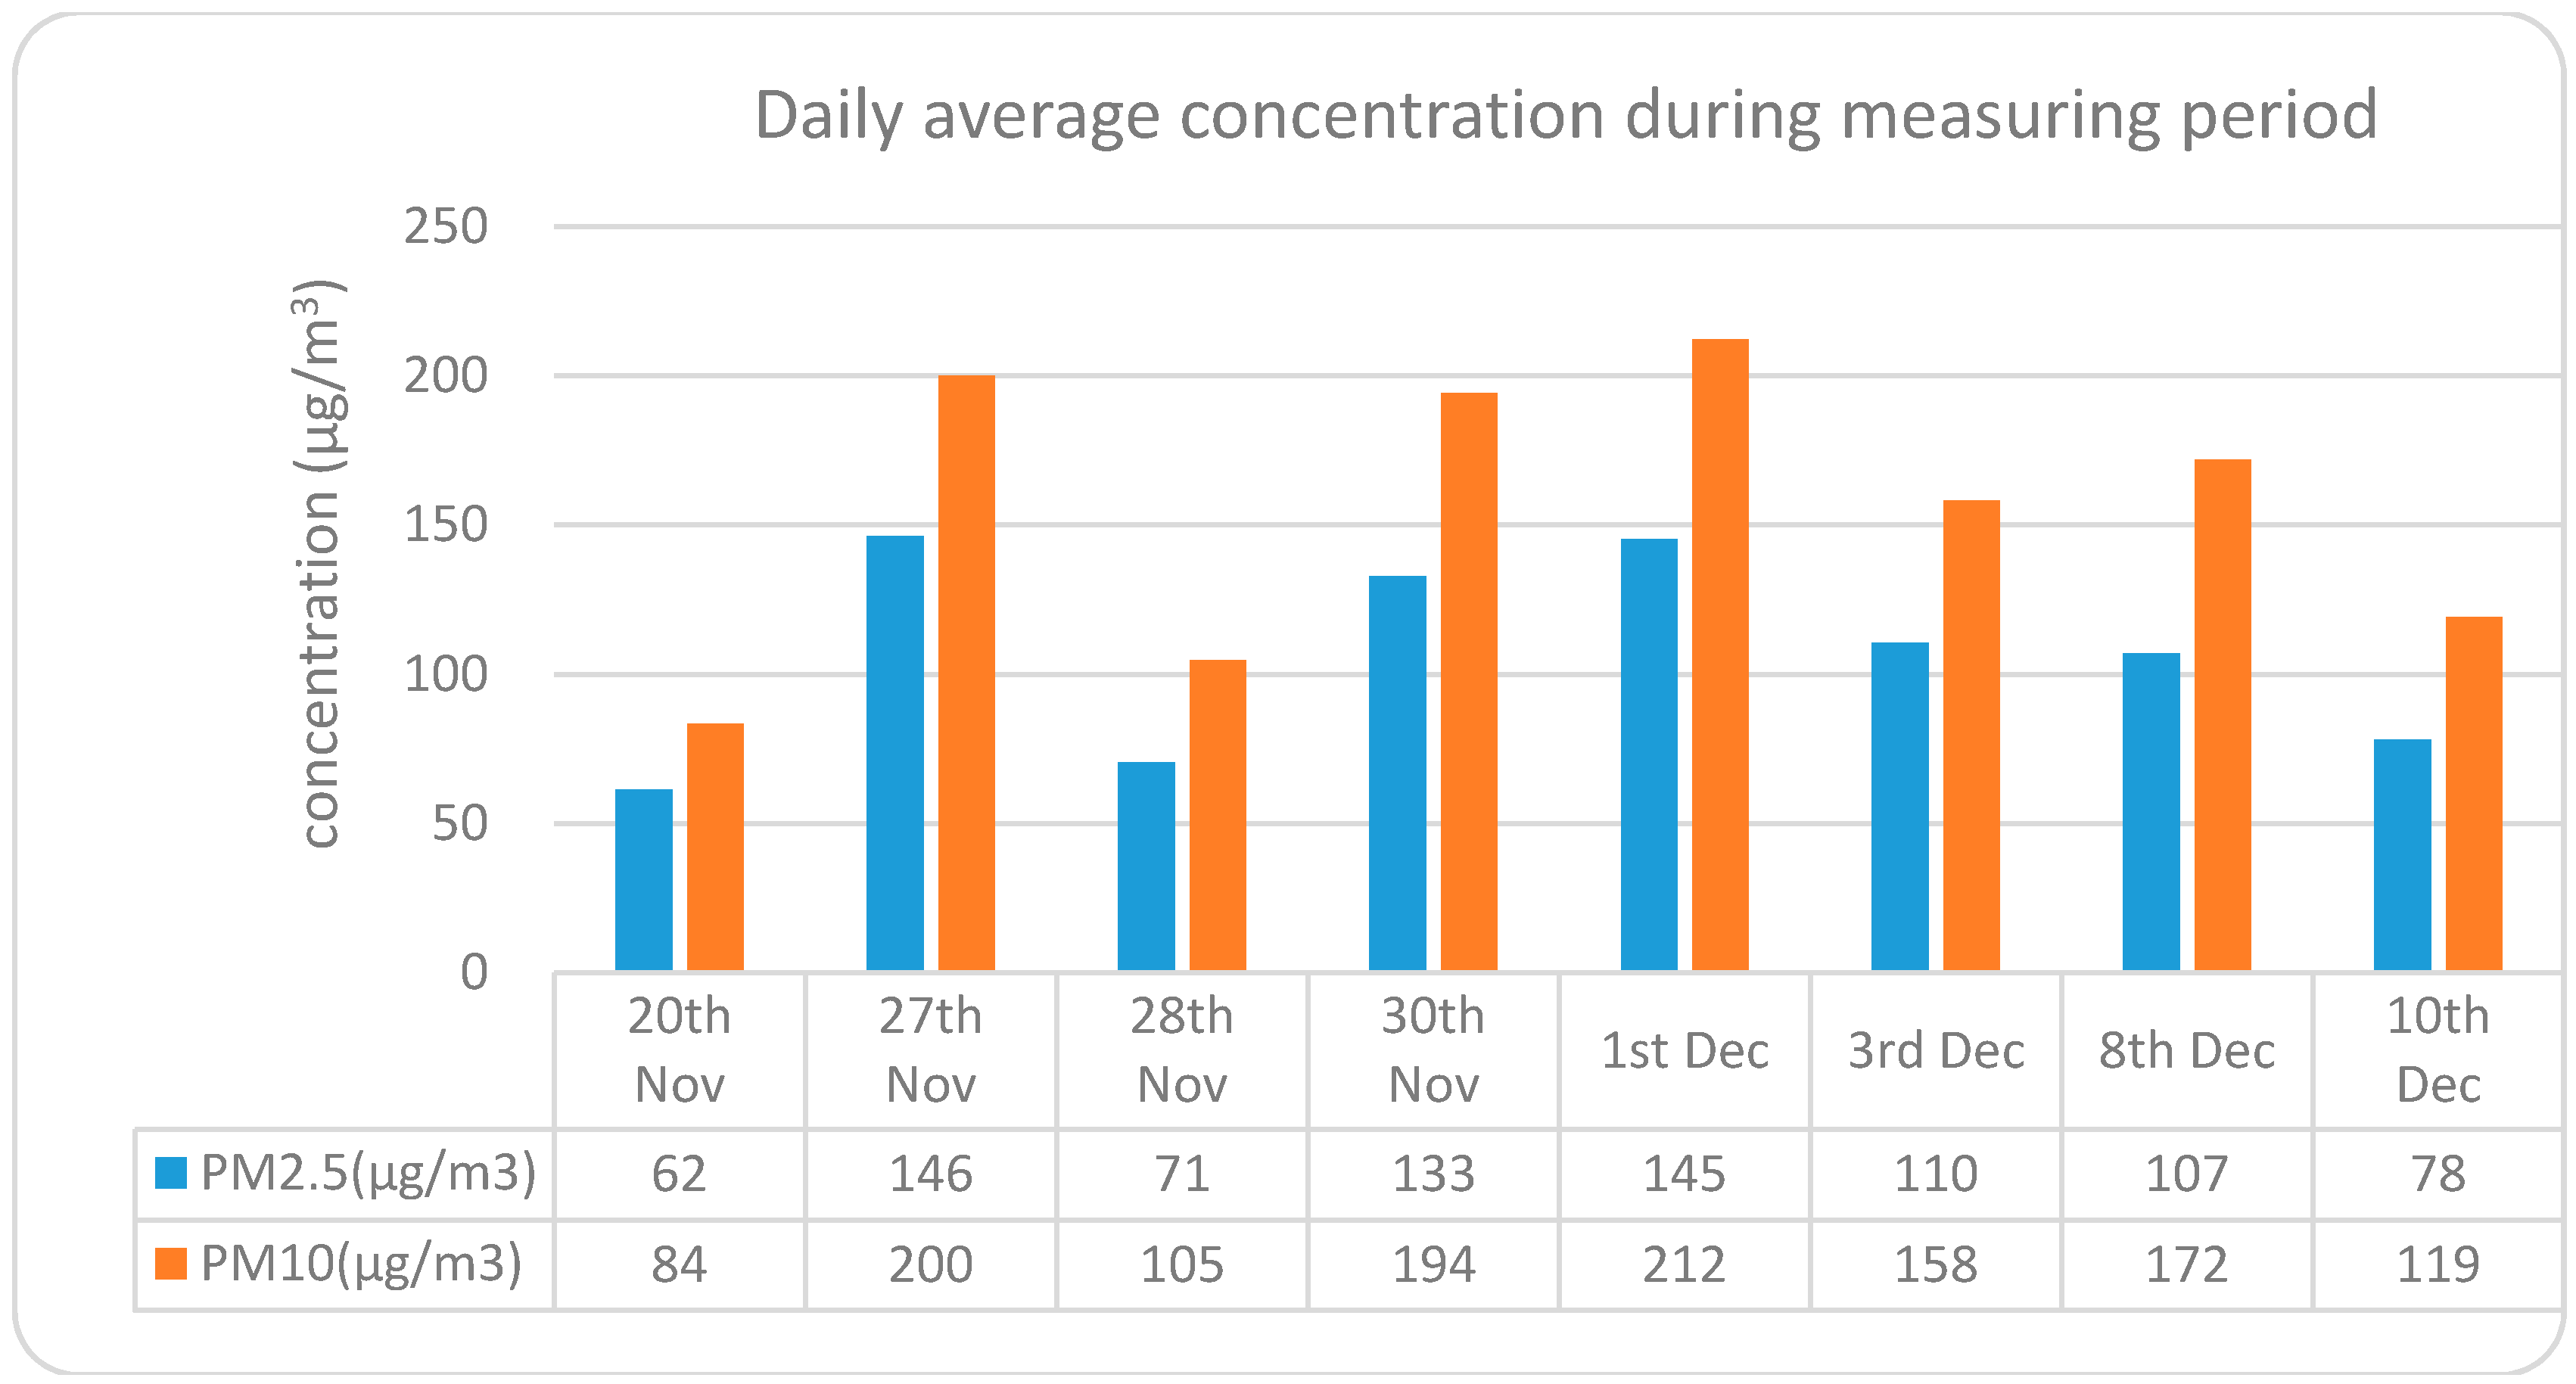
The ambient air quality usually is worse in winter as a result of the coal consumed for heating provisions in the North of China. Figure 2 indicates the daily average PM concentration recorded by the local environmental monitoring stations during the measurement period.
It has been shown that during the measurement days, the ambient PM concentrations are all higher than the Chinese standards (35 μg/m3 for PM2.5 and 50 μg/m3 for PM10). Since indoor air quality closely correlates to outdoor pollution levels, especially for naturally ventilated buildings, ambient air pollutants can flow inside through purpose-provided openings and penetrate via cracks in the envelope.
4.2. Effects of Building Defects
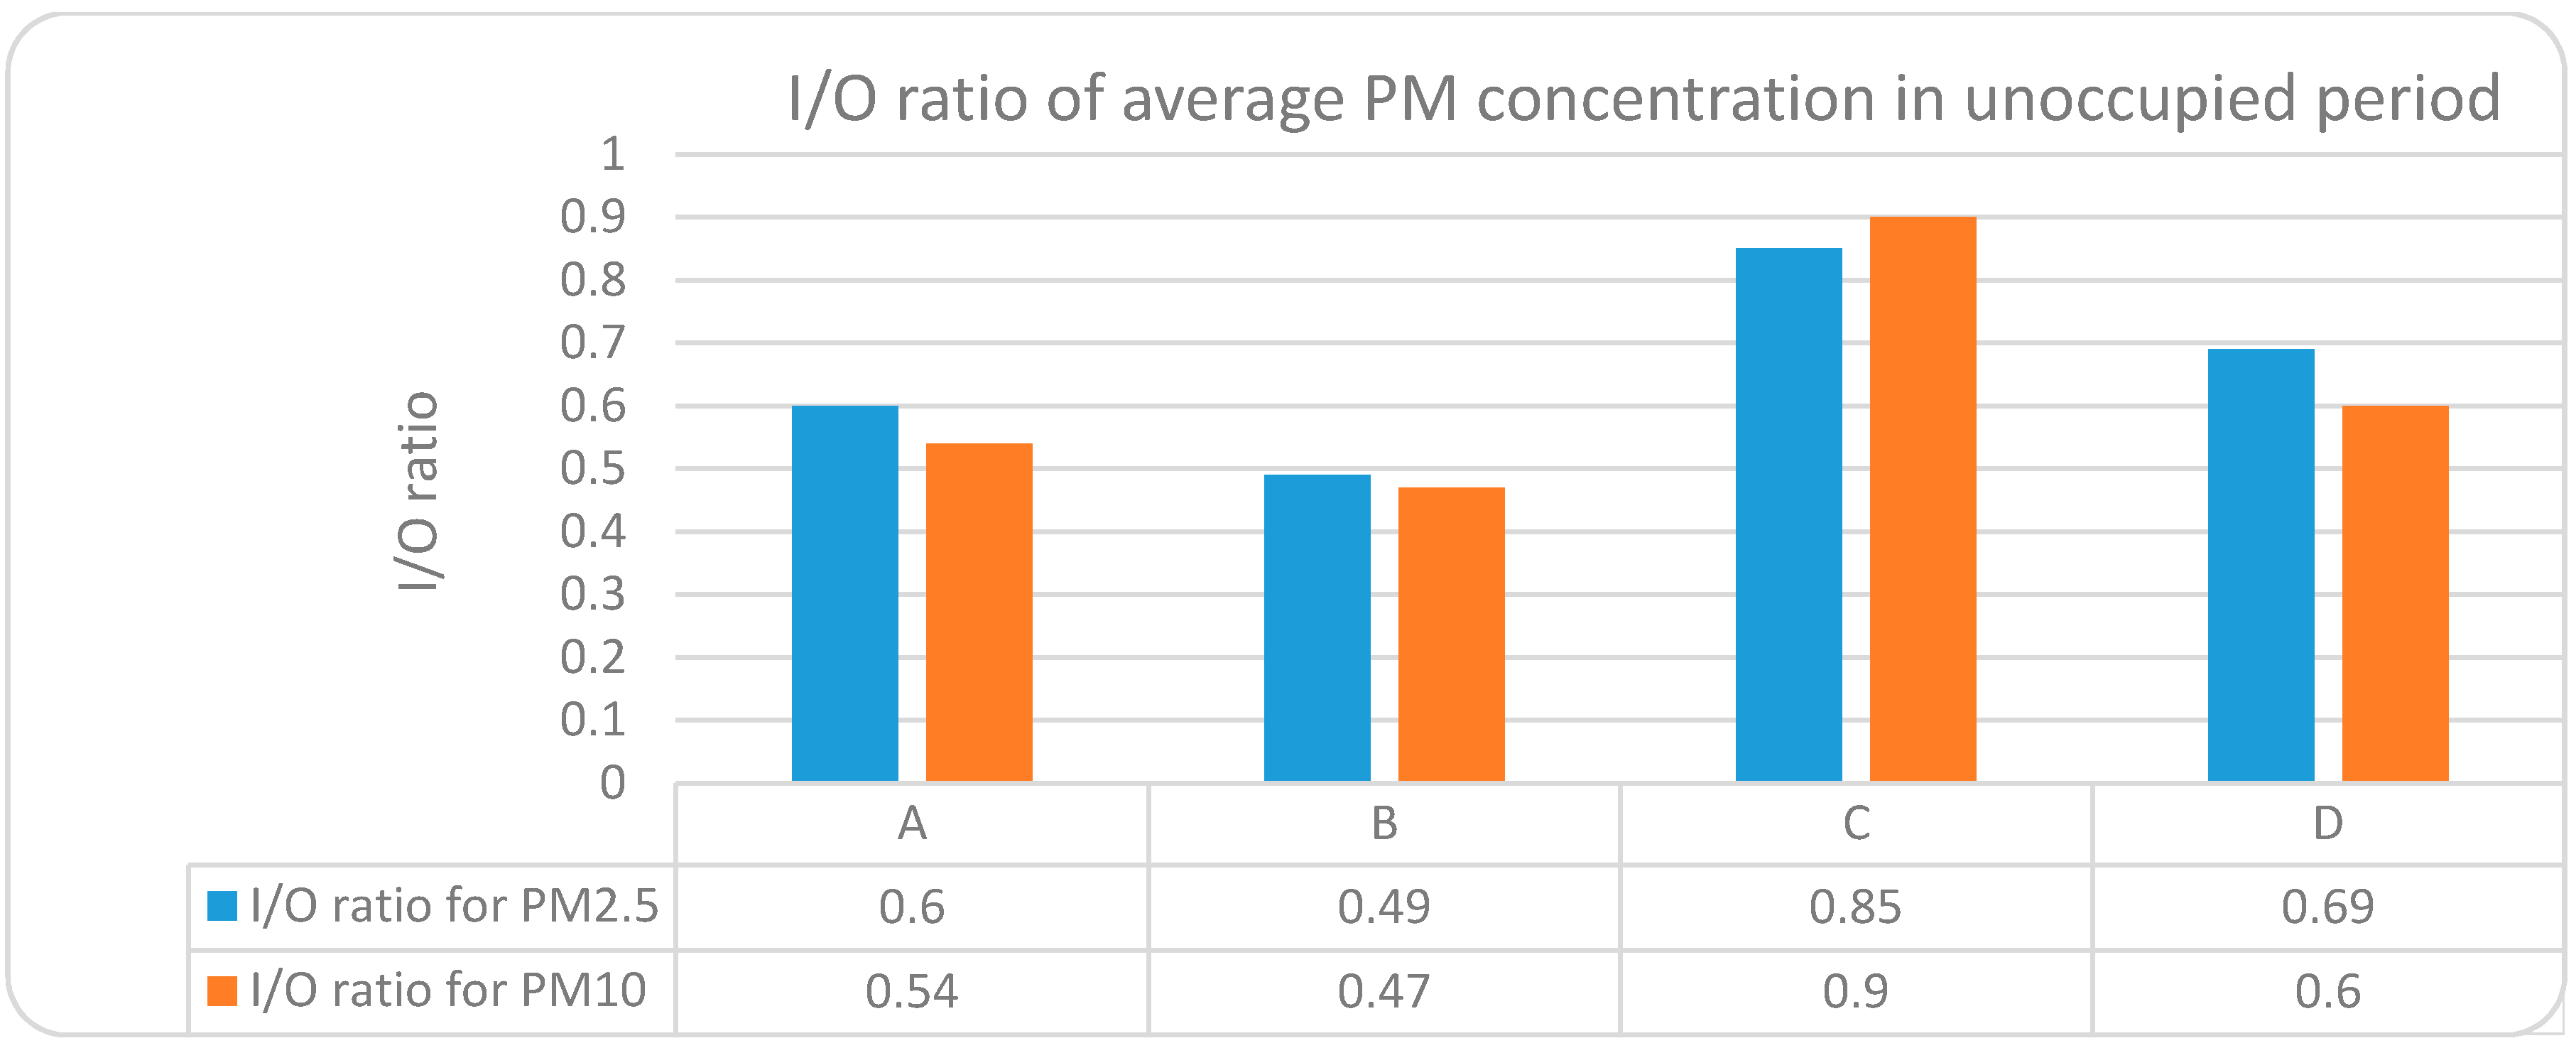
The indoor/outdoor (I/O) ratio between indoor PM concentrations measured in unoccupied classrooms and outdoor PM concentrations is used to reflect the effect of building defects (Figure 3). The classrooms were cleaned the night before the measurement was taken. Thus, it is assumed that the indoor sources of particles, such as the students’ activities and the resuspensions of chalk dust, have been eliminated. In addition, the doors and windows were closed, therefore penetrating through cracks into the envelope, which would be the only way for indoor PM aggregation to occur.
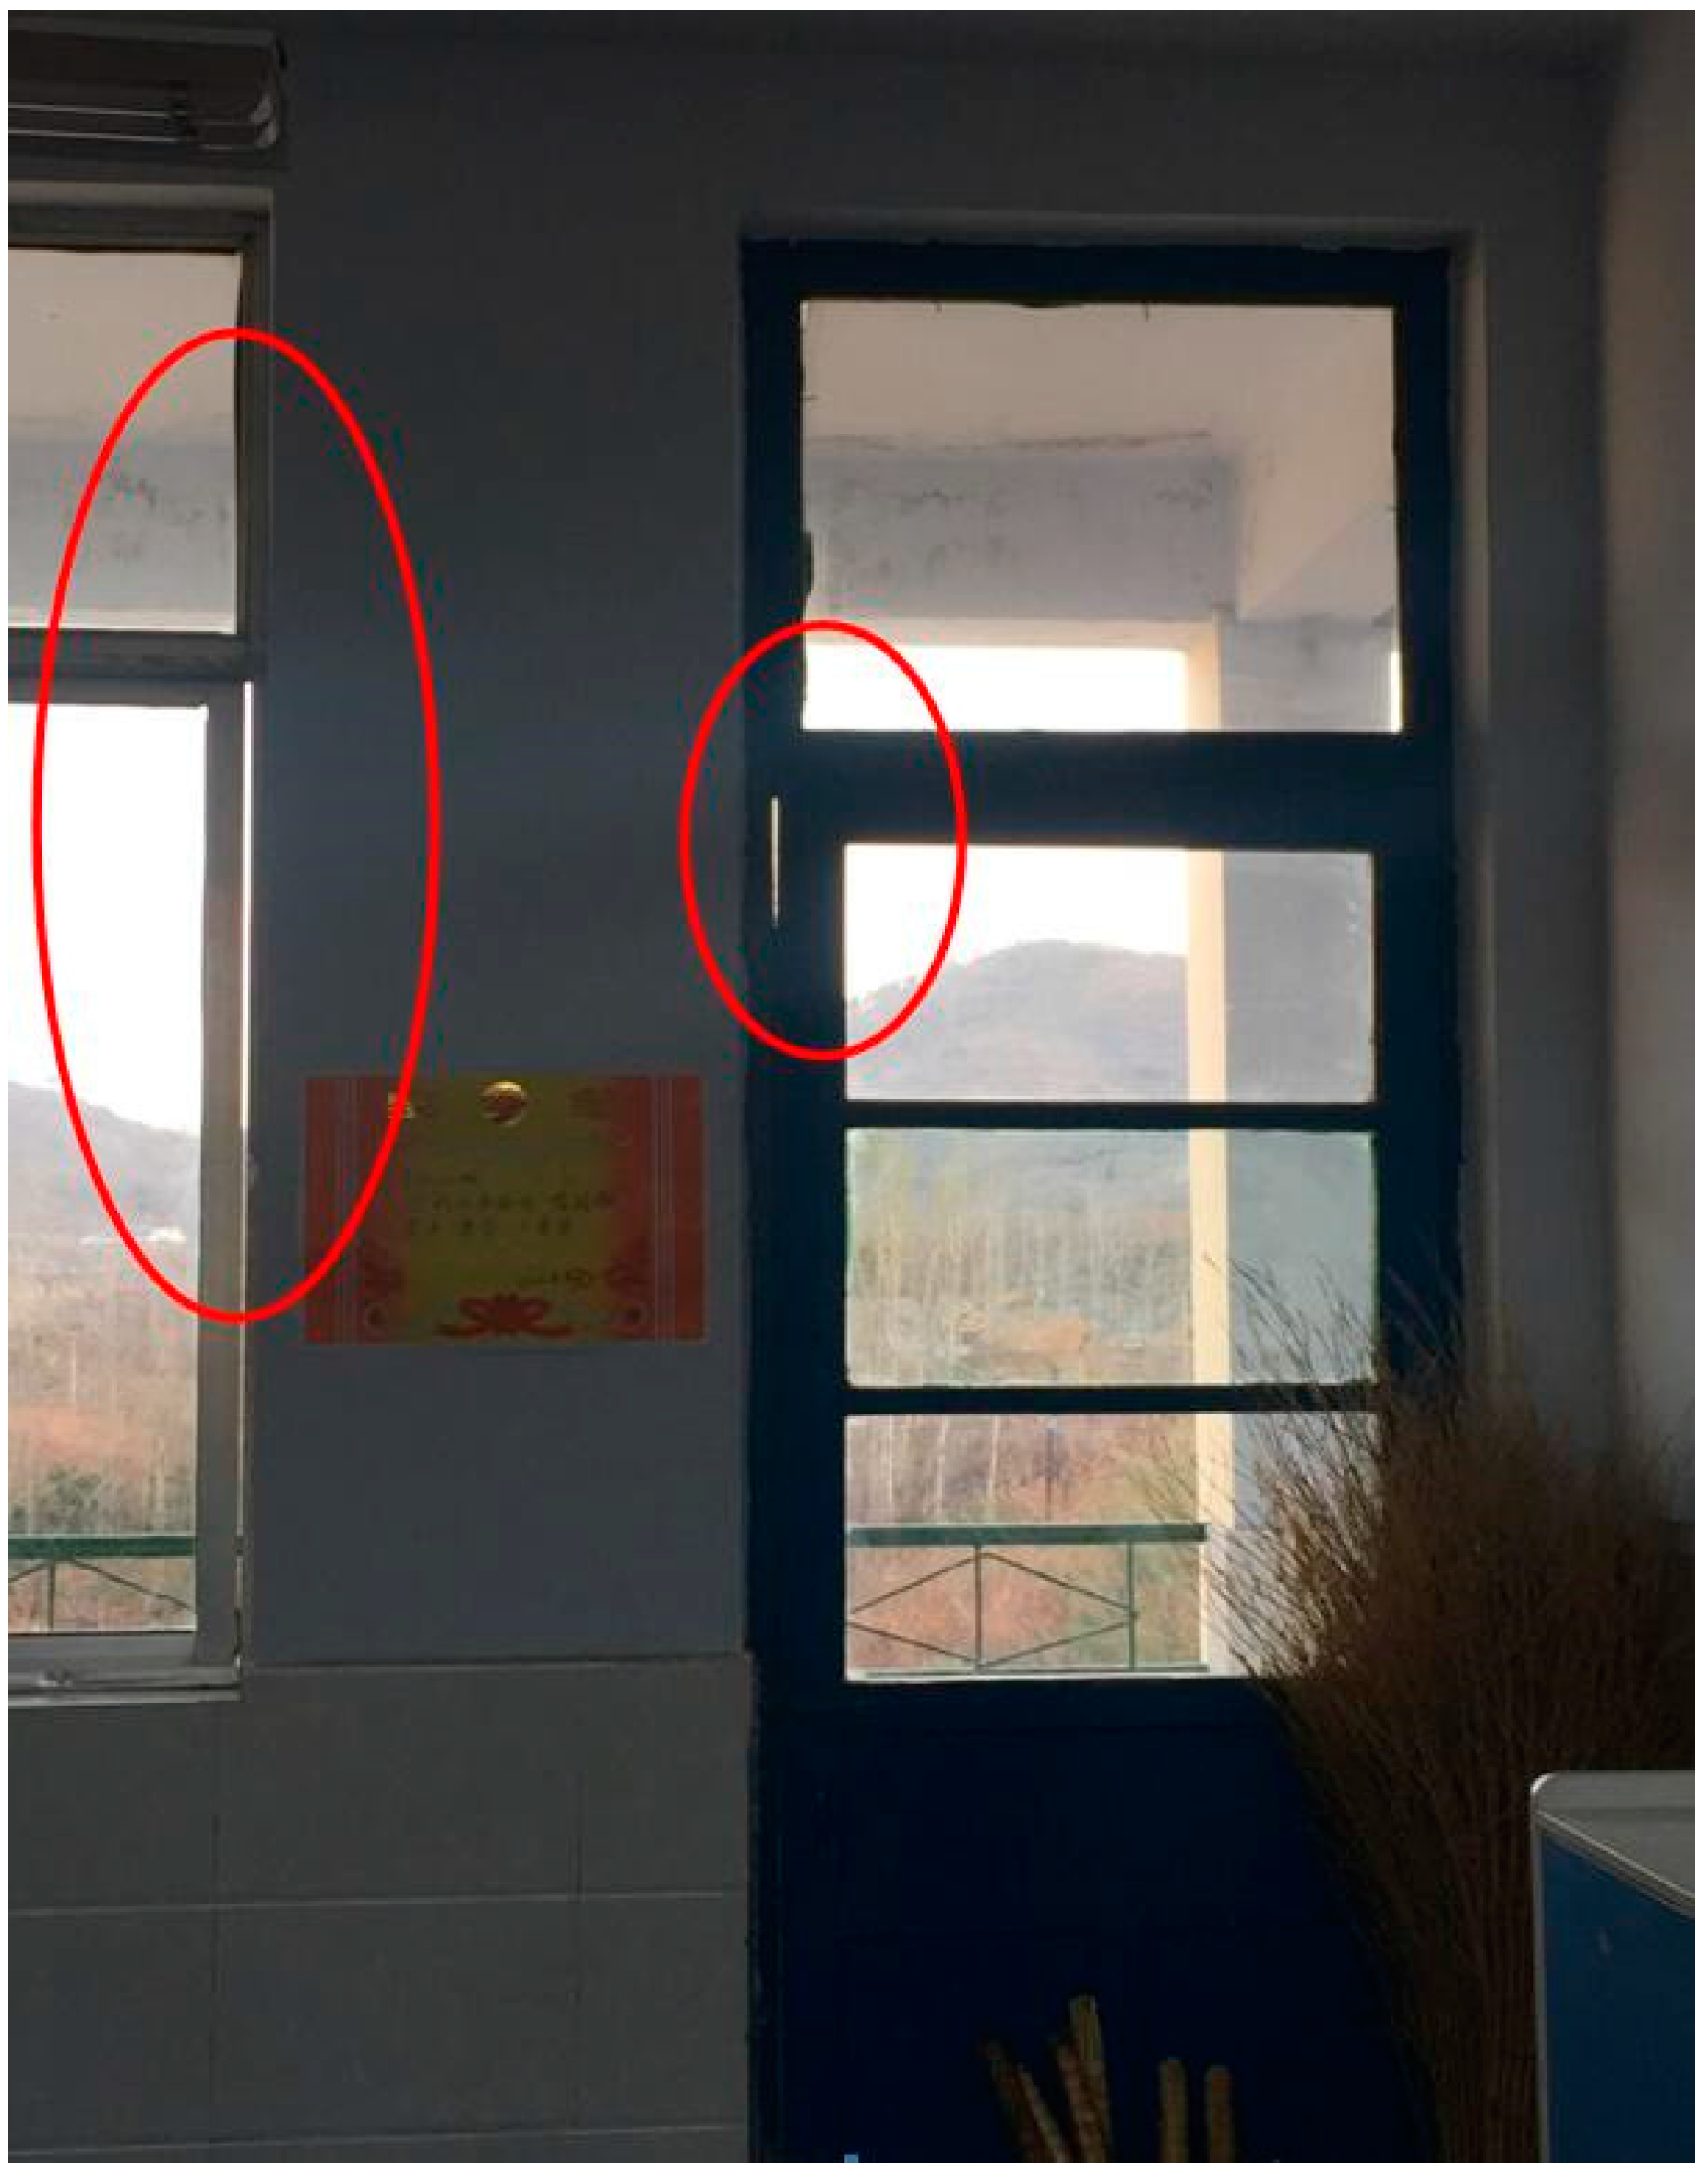
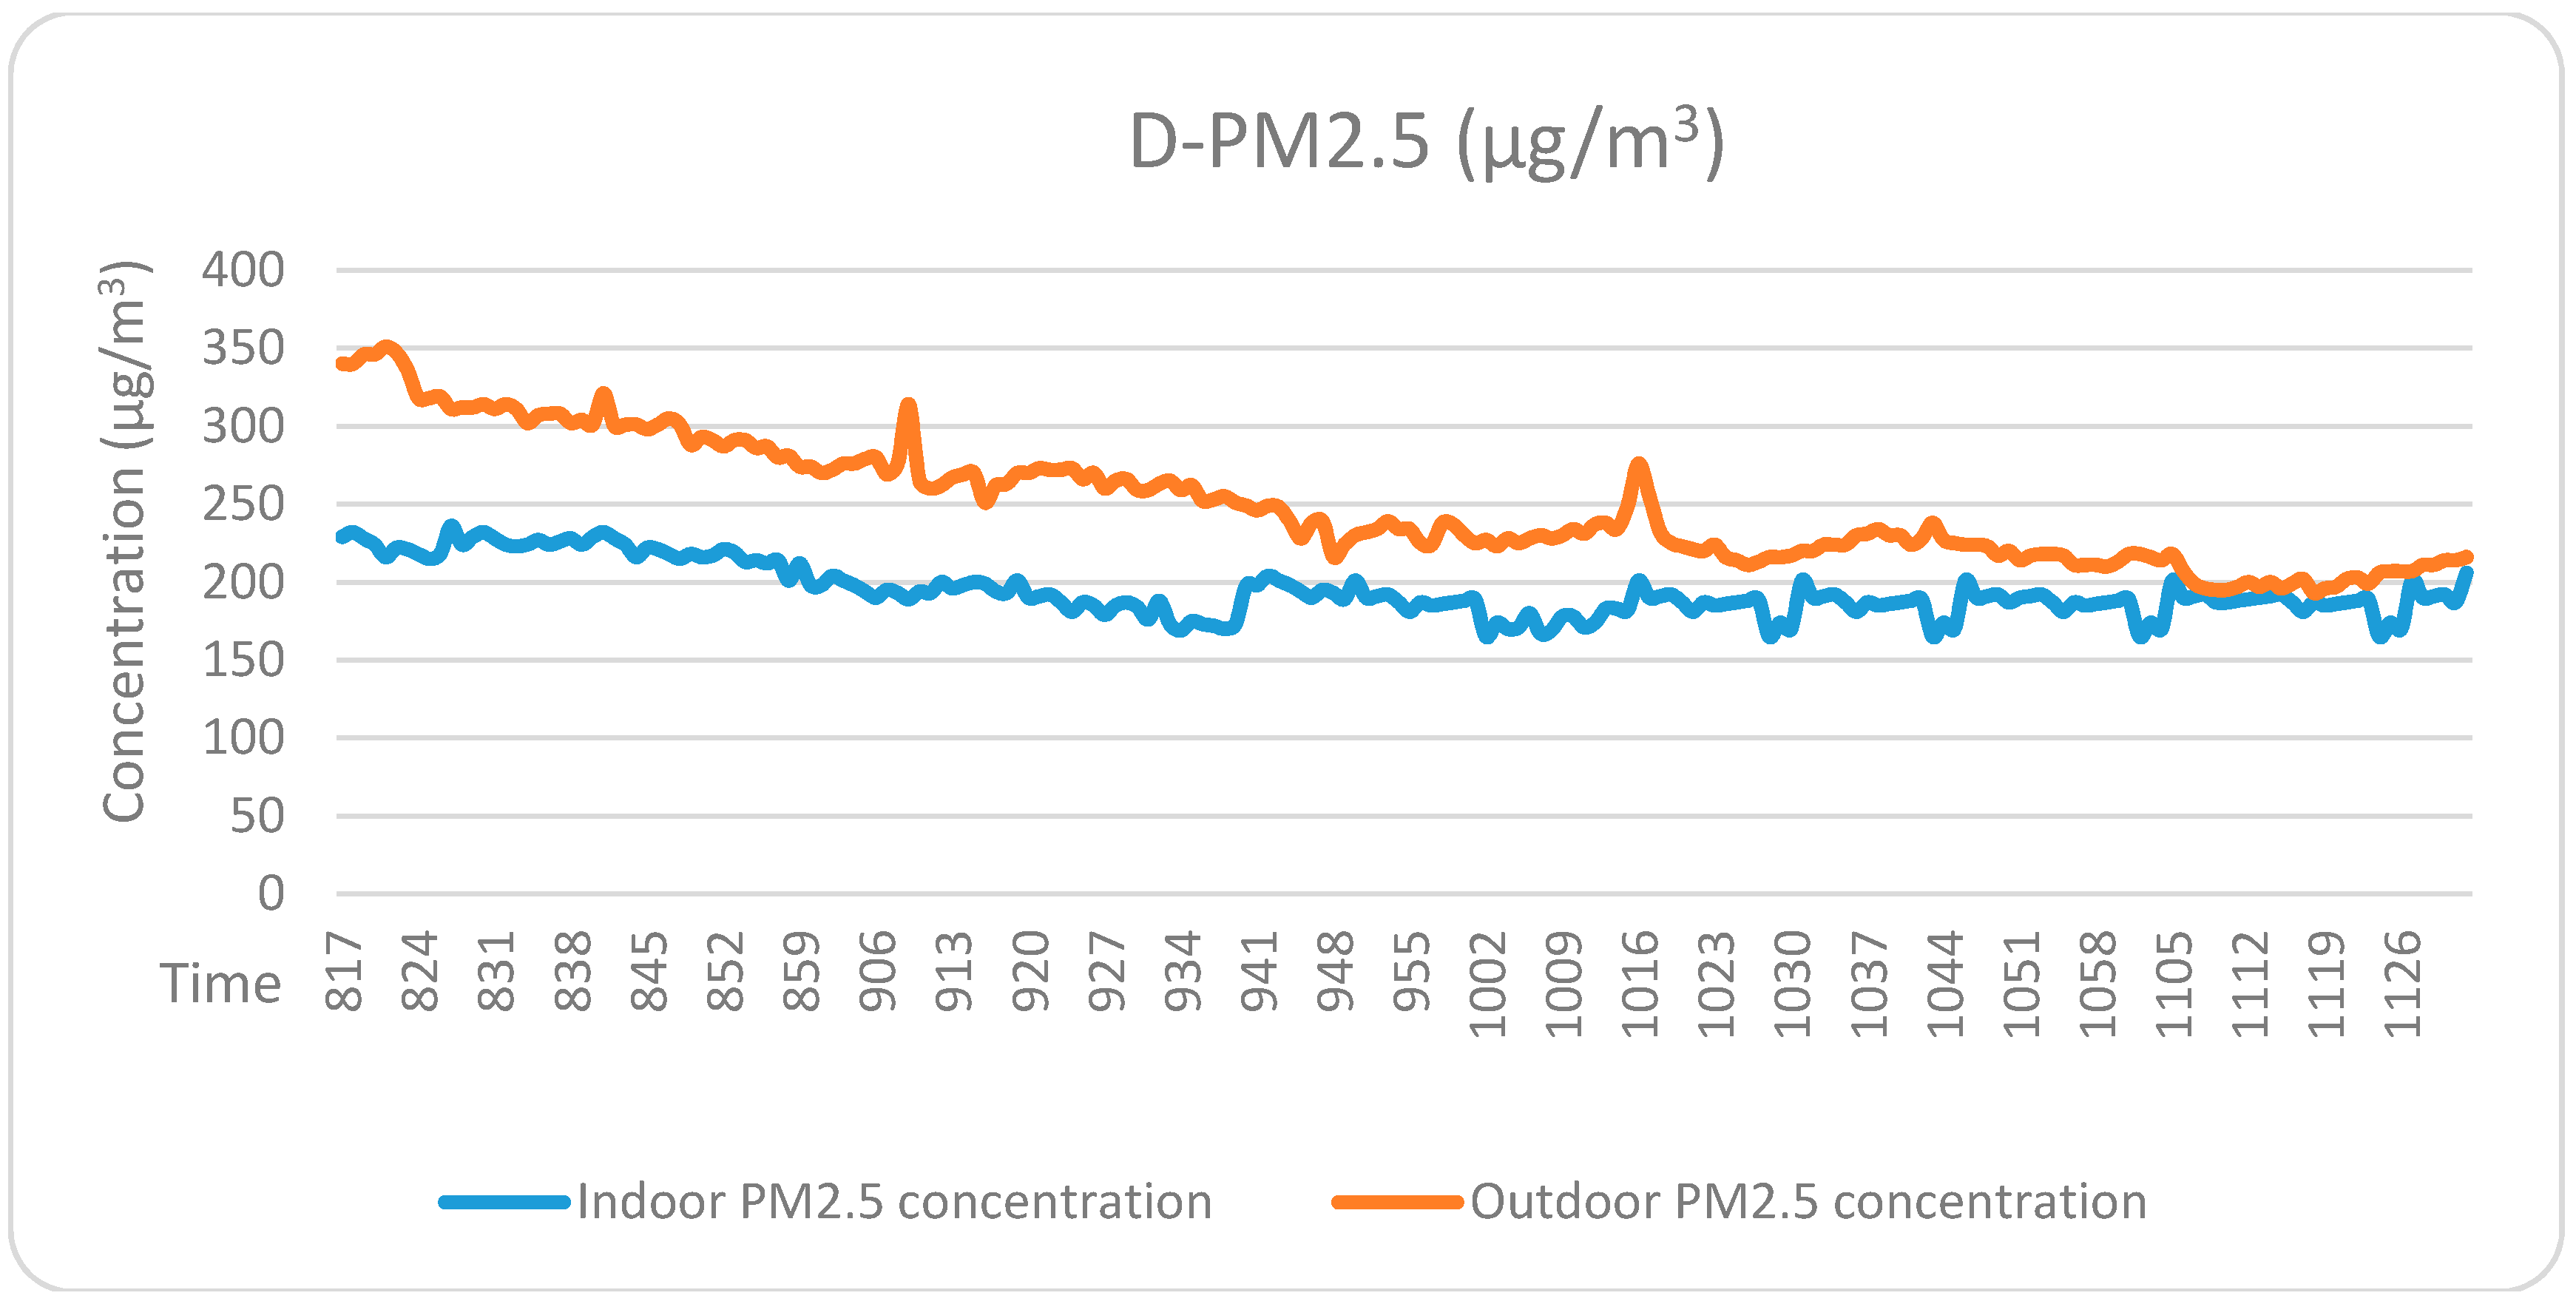
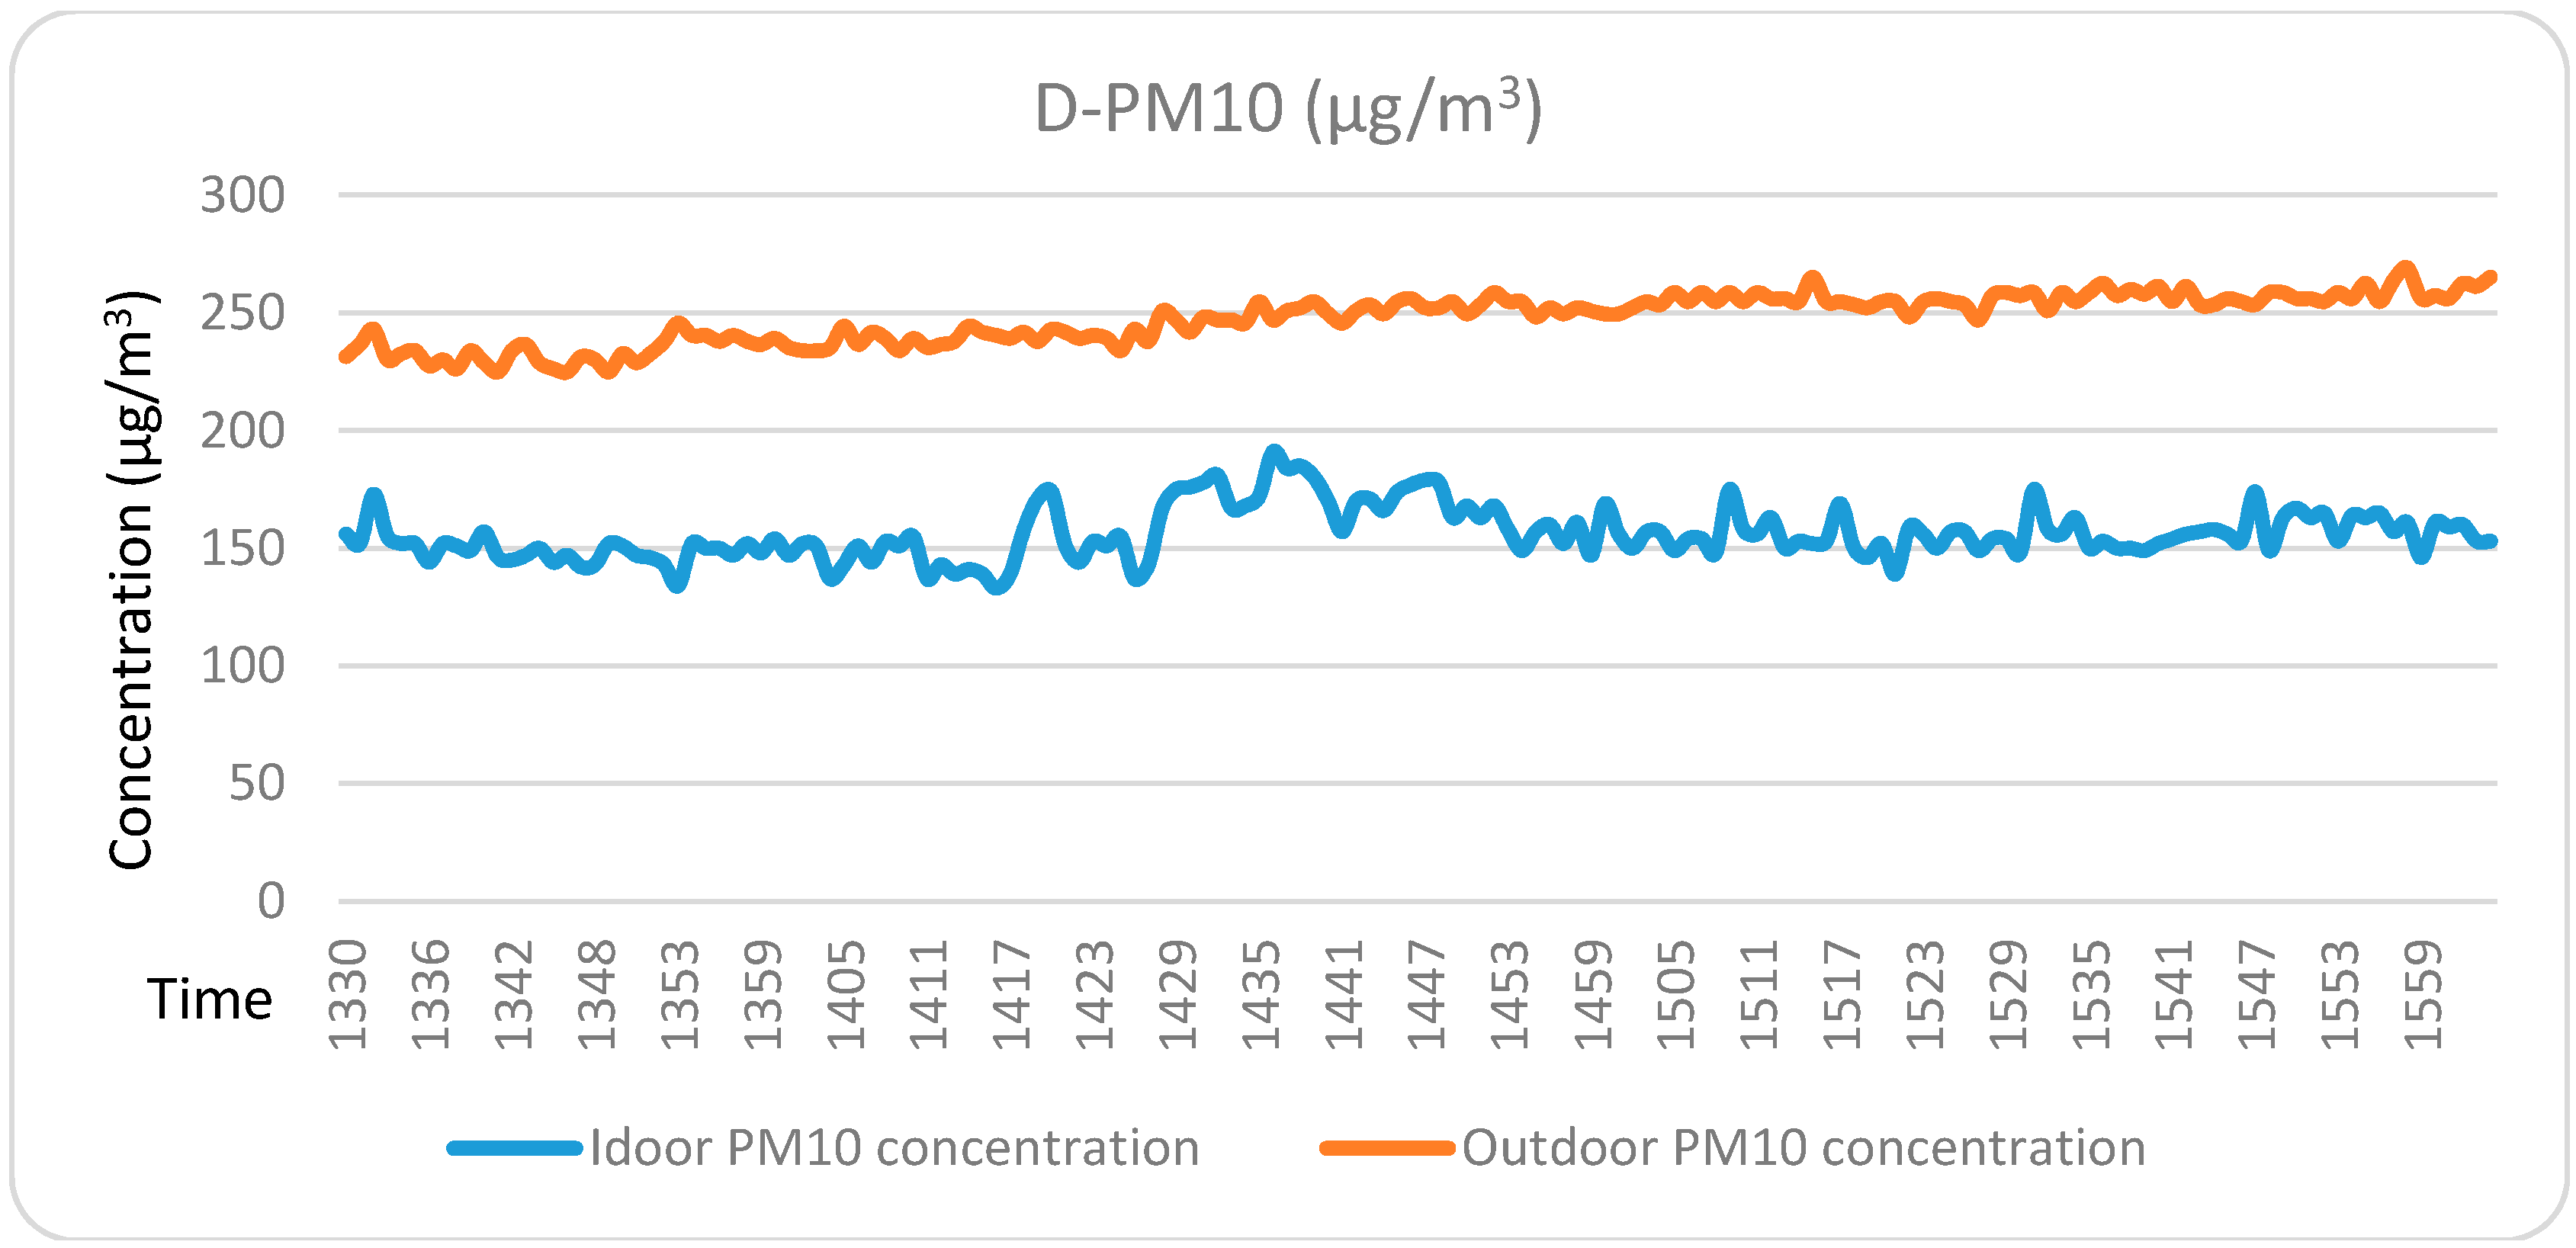
School B has the lowest I/O ratios of 0.49 and 0.47 for PM2.5 and PM10, respectively, and School C has the highest I/O ratios of 0.85 and 0.9 for PM2.5 and PM10, respectively. This is because School B has the building air tightness level of 6, which meets the current highest requirement based on the latest building regulation. School C was built in 2003, when building air tightness was missing in the building regulations. So, cracks and gaps in the envelope can be easily found (Figure 4). Schools A and D both have an air tightness level of 4, so the I/O ratios of PM concentration were around 0.54–0.69. Figure 5 and Figure 6 describe the indoor and outdoor PM performance in a measured day in School D. A similar decline of PM2.5 and a similar increase of PM10 for both indoor and outdoor air can be found. The changing tendency for both indoor and outdoor PM concentrations was consistent. A similar pattern can be found in the other primary schools. These results suggest that in naturally ventilated buildings, the indoor air quality could be significantly affected by the penetration of particles.
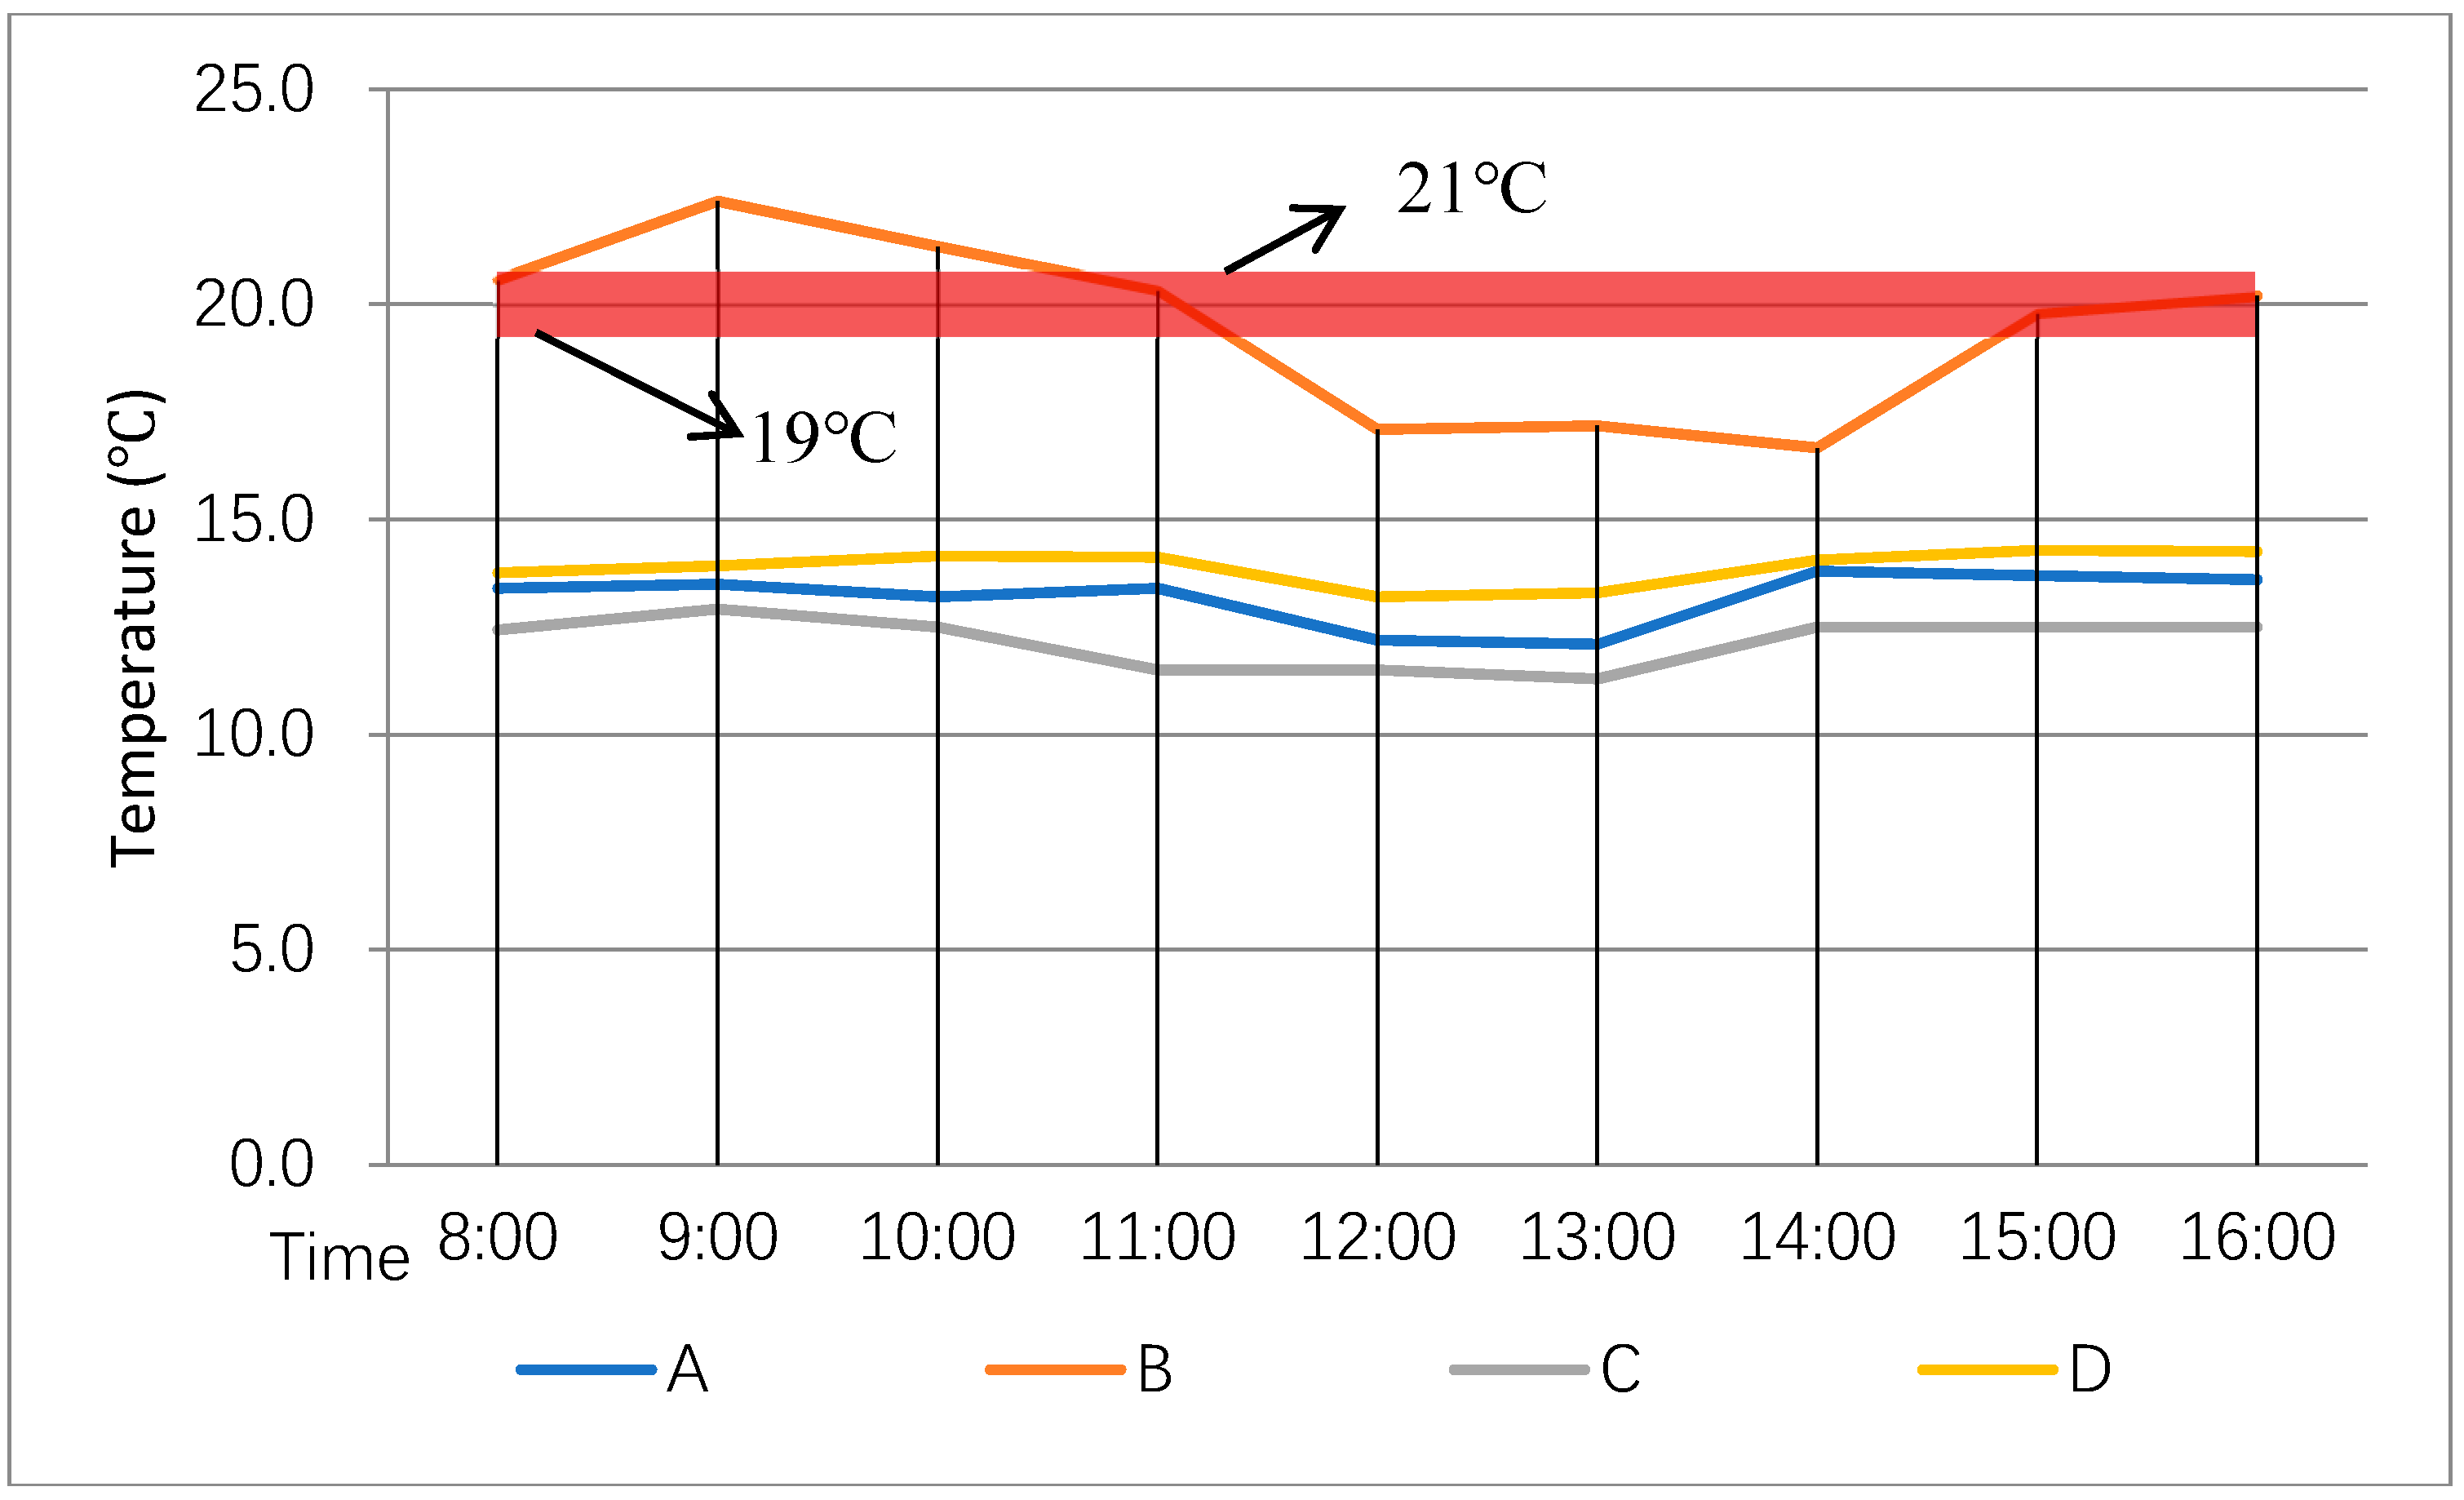
Without heating provided to the classrooms, the indoor temperature is dynamic and primarily determined by four factors: heat loss from the fabric, air infiltration, heat gains from indoor heat sources (lighting and metabolic), and solar radiation. The classrooms measured had the same orientation and number of students. The lights were turned off during the measurement periods. It is a reasonable assumption to say that the insulation and air tightness were the two main factors determining the indoor air temperature. It is seen from Figure 7 that School B had the highest indoor temperature, since it was built in 2015 to comply with the new requirements for building insulation and air tightness.
4.3. Effects of Internal Activities
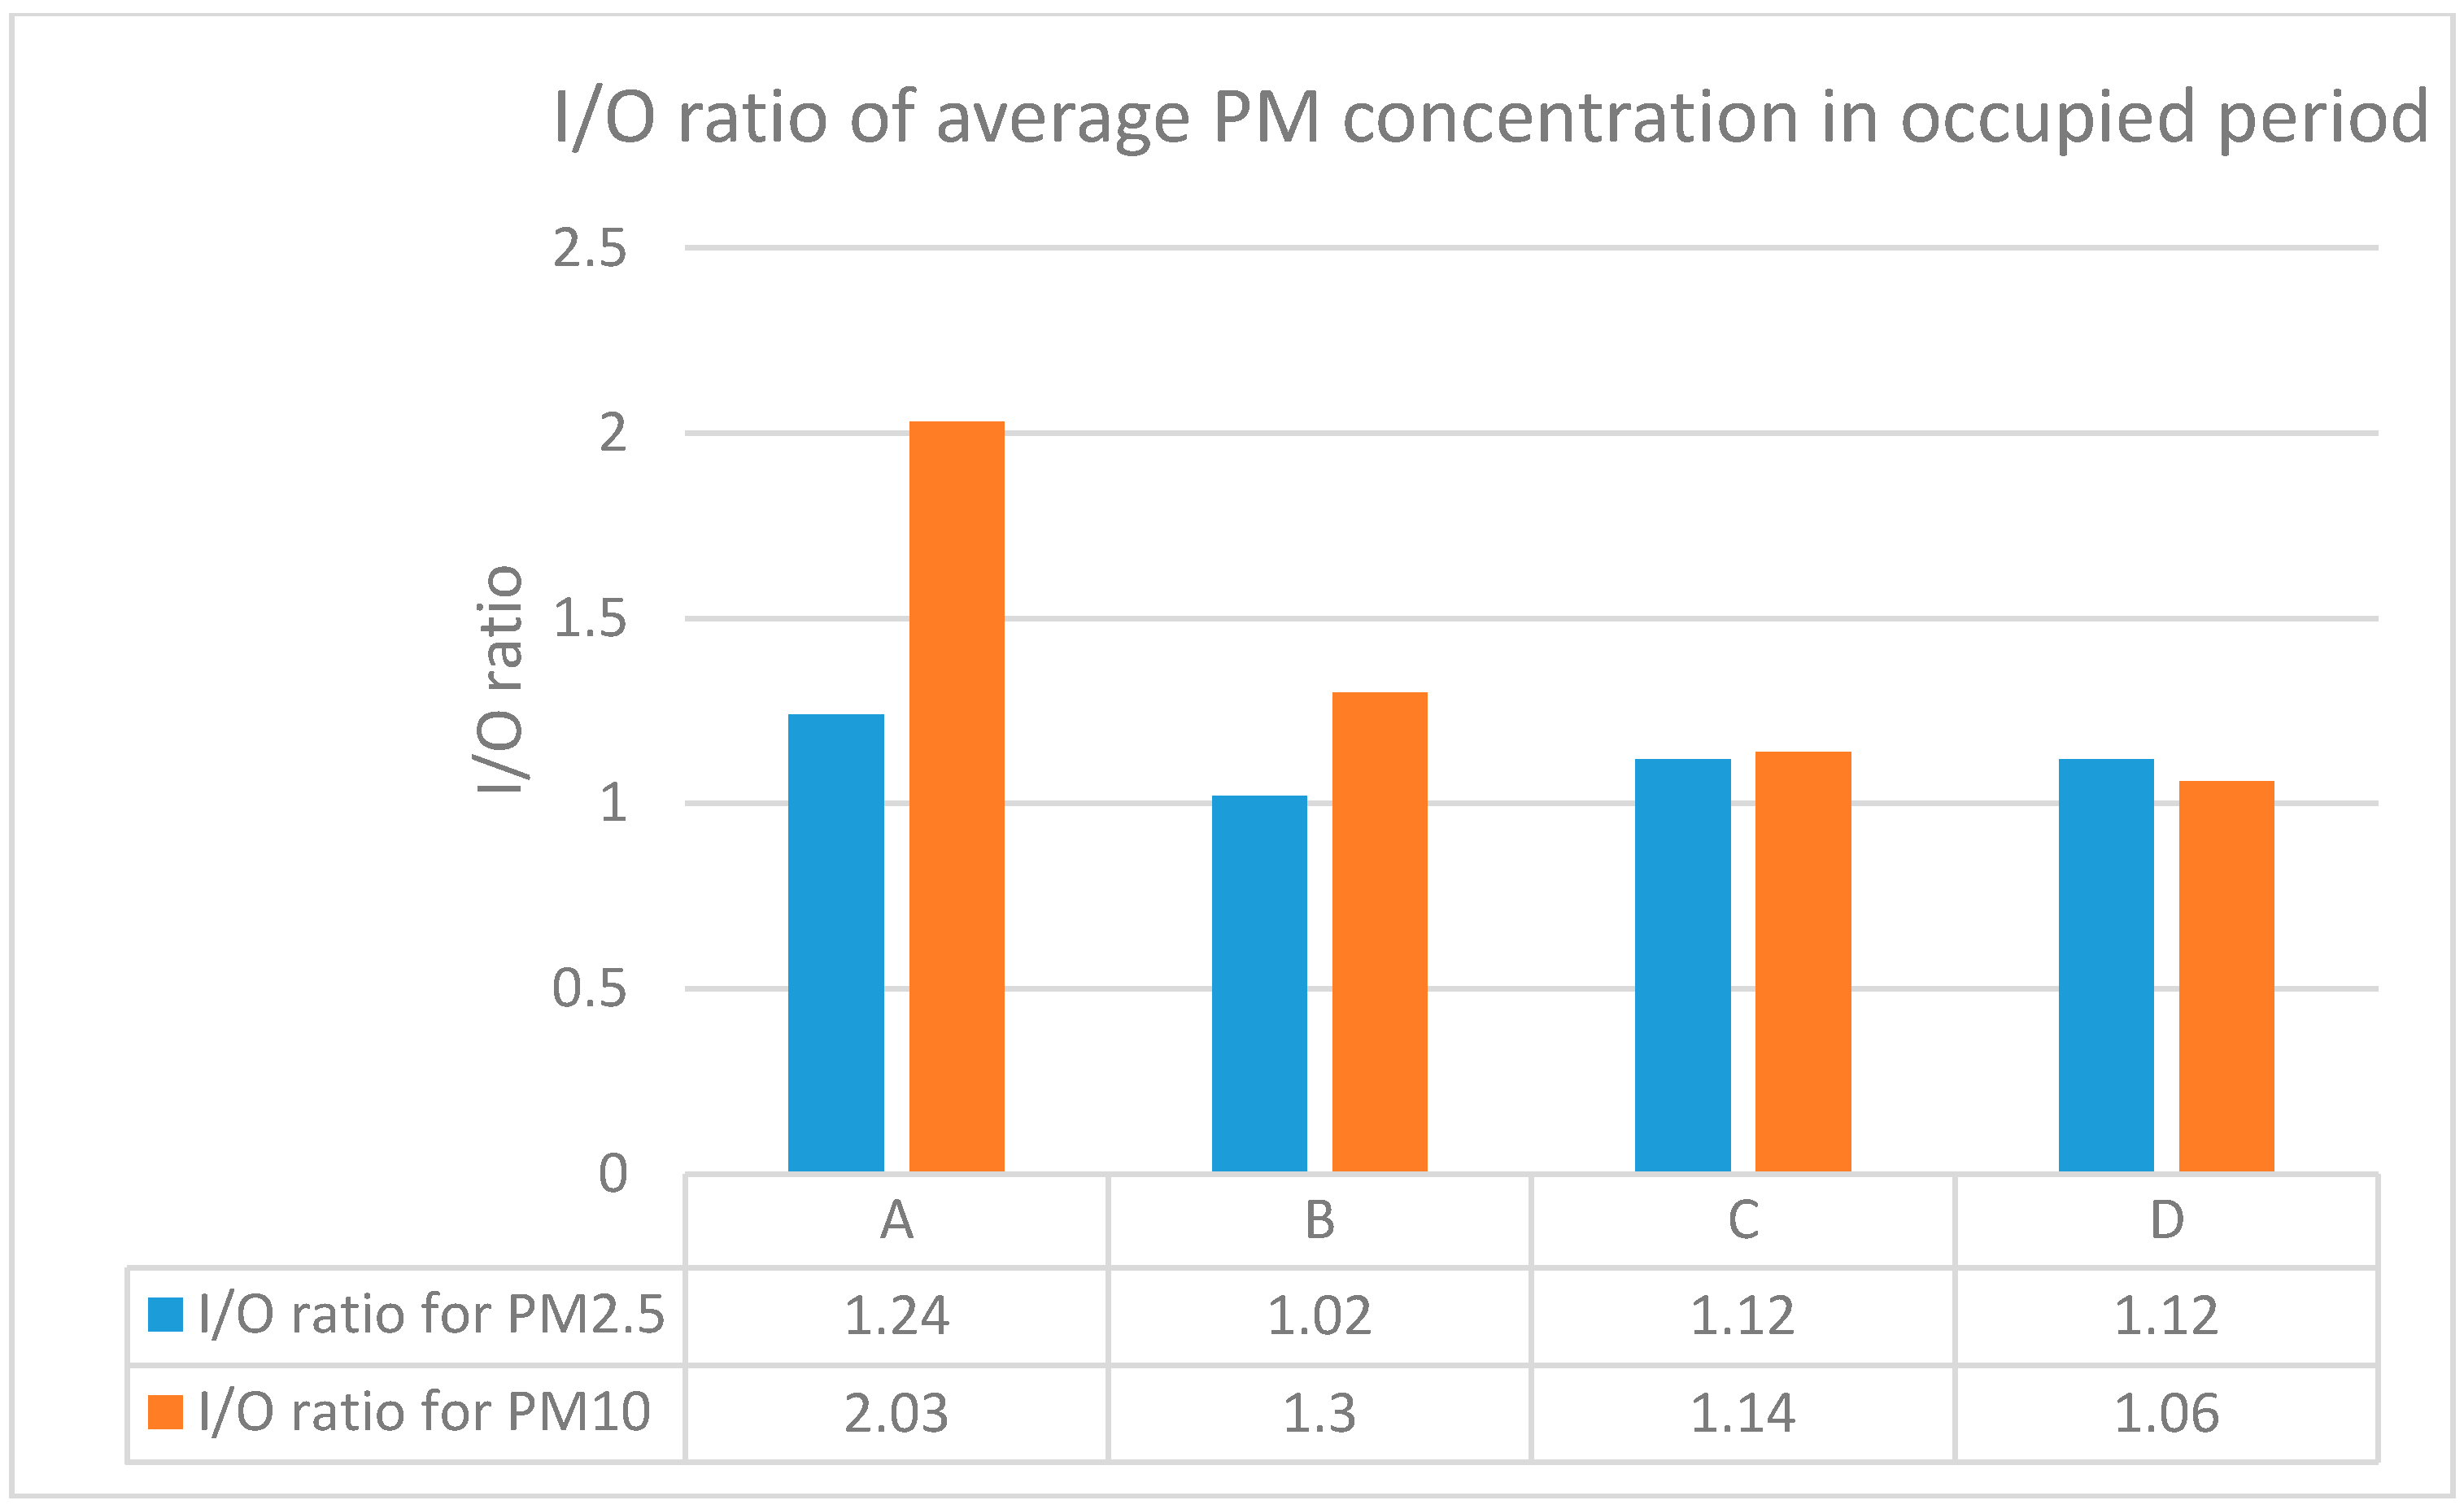
The ratios between the indoor and outdoor mean PM concentrations revealed that there was a higher concentration of PM indoors, when a classroom was occupied (Figure 8). This was caused by students’ activities, such as walking, running, and cleaning the blackboard, which increased the resuspension of particulate matter. Moreover, chalk was commonly used for teaching in the schools, and the chalk dust particles were generated when the blackboard was cleaned using an eraser at the end of a teaching session. Figure 9 shows the accumulation of chalk dust in one classroom.
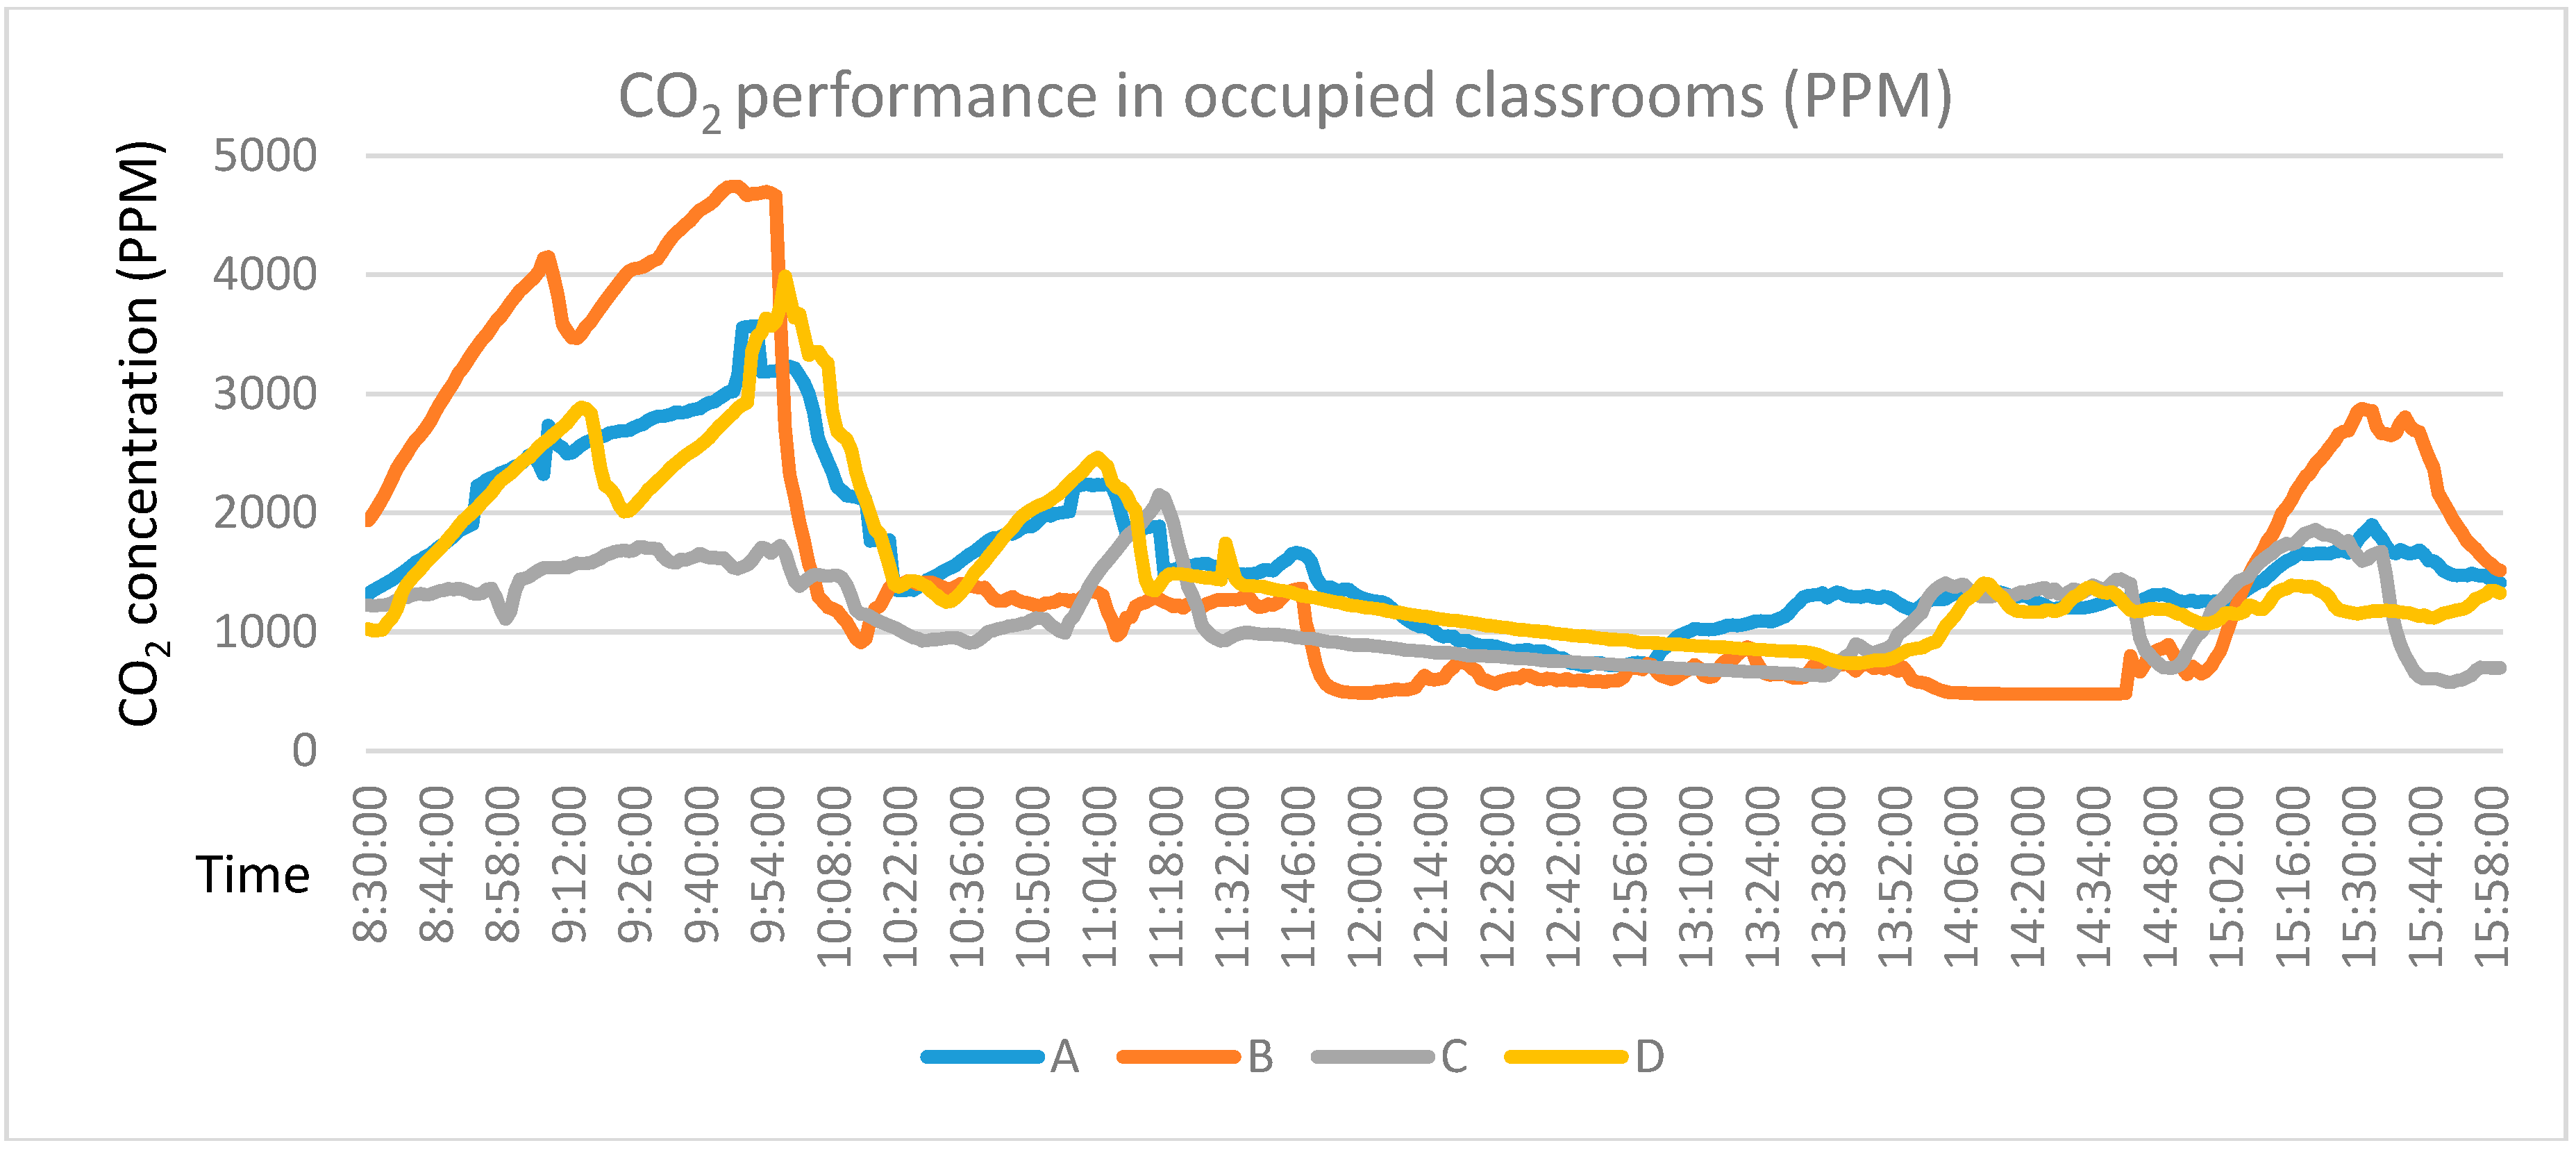
It can be seen from Figure 10 that there was a rapid increase in CO2 level at the beginning of a school day, because the half-hour morning reading session between 8:30–9:00 congregated all of the students before the first teaching session would resume. This led to more carbon dioxide being exhaled. During the lunch break, the CO2 concentrations decreased significantly to around 500–700 ppm. After that period, the CO2 levels went up when the classrooms were again occupied. Overall, the CO2 level was very high and exceeded 1000 ppm on average. This was largely attributed to the closing of windows and doors to keep the inside environment at reasonable levels of thermal comfort.
5. Conclusions, Limitations, and Future Research Directions
5.1. Conclusions
In this study, indoor air quality was measured in the four case studies of primary schools in Tai’an city, North of China. Four parameters have been measured and analyzed. The correlations between the indoor air quality and the ambient air pollution, building defects, and internal activities also have been identified and discussed. The results indicated that none of the case studies for primary schools satisfy the indoor air quality standards.
A building’s air tightness and its occupants’ internal activities have a significant impact on indoor PM concentrations in naturally ventilated school buildings. A “tighter” building tends to reduce outdoor air pollutants’ penetration and ensure a higher indoor temperature in winter. Teaching and learning activities also affected the indoor air quality. When the outdoor PM concentration is high, it has been suggested that the windows and doors should be closed to keep particle matters out. However, this might lead to an increase of CO2 concentration due to an inadequate fresh air supply.
Since ambient air pollution is a regional environmental problem, it cannot be solved only by building designers, builders, and school managers. However, it is possible to provide better indoor air quality to primary school students by removing building defects. Some suggestions from this study are listed below.
- The current building air tightness requirements are not adequate. This study indicates that around 50% of particles originate from the ambient air even in a school building which has met the highest air tightness level required in China. Thus, the current building air tightness requirement should be improved.
- Retrofits are needed to improve the indoor air quality in naturally ventilated school buildings. Cracks and gaps in the envelope can be sealed. For example, the cracks in a masonry-concrete structure and timber frame structure can be removed by gypsum plaster and flake board, respectively.
- On the other hand, improved air tightness may cause the increase of CO2 concentration in a naturally ventilated school building, particularly in winter when the doors and windows are closed to maintain reasonable levels of thermal comfort. Therefore, mechanical ventilation systems should be employed in winter to remove the products of respiration, such as CO2 and H2O.
- During heavy air polluted days, for example, when the Air Quality Index (AQI) (An air quality index (AQI) is a number used by government to communicate to the public how polluted the air currently is or how polluted it is forecast to become. In China AQI larger than 100 means air is heavy polluted.) is reported 100 or above, it is suggested that a mechanical ventilation system with an air purification function should be installed to ventilate the building with clean air. For days with good ambient air quality, natural ventilation still is the first option for saving the energy consumed by mechanical ventilation systems.
- In addition, it is also important to remove particles generated by class activities. For example, chalk should be replaced by using a projector for teaching if possible, or simply substituting chalk by whiteboard markers and the appropriate boards. Moreover, classrooms should be cleaned frequently to reduce the resuspension of particulate matter.
In summary, this empirical research has demonstrated that in naturally ventilated school buildings, improving air tightness might be a way to reduce the penetration of outdoor air pollutants. Mechanical ventilation with an air purification function also could be an option on some severely polluted days.
5.2. Limitations and Future Research Directions
Due to the limited time and resources, four primary schools were selected and the investigations were carried out over three weeks. These four case studies can represent the vast majority of primary schools at a local context, since primary schools are a part of the public educational system, and they therefore have standardized plans and design. They are always designed based on the same building regulations (Code for design of school-GB50099) (Code for design of school-GB50099 is a series of school building regulations which is implemented by the Ministry of Construction China. It defines many common features of primary school buildings, such as the size of classroom, number of students and building orientation, etc.), therefore they have similar features, such as the size of classrooms, the number of students, the number of floors, orientation, positioning of windows and sizing, and the same materials specifications. The biggest differences of primary school buildings are the air-tightness levels and added thermal characteristics, since the China Public Building Energy Saving Standard (GB50189) has been going through updates during the last decades. Several future directions arising from this research have been recognized. First, more school buildings should be investigated in order to extend the number of samples. Second, the seasonal effects on indoor air quality should be further identified. Third, the penetrability of different sizes of particles should be studied, and the effects of the distribution of cracks in the building fabric’s envelope should be investigated.
Author Contributions
Zhen Peng designed the research, conducted the measurements, completed the data analysis, created the tables and figures, and finished the writing of the paper; Wu Deng and Rosangela Tenorio contributed valuable opinions and suggestions during the manuscript writing. All authors read and approved the final manuscript.
Conflicts of Interest
The authors declare no conflict of interest.
References
- Ministry of Environment Protection of the People’s Republic of China. National Environmental Protection 10th Five-Year Plan, (2002). Available online: http://www.zhb.gov.cn/gzfw_13107/ghjh/wngh/ (accessed on 3 July 2017).
- Ministry of Environment Protection of the People’s Republic of China. National Environmental Protection 11th Five-Year Plan, (2007). Available online: http://www.zhb.gov.cn/gzfw_13107/ghjh/wngh/ (accessed on 3 July 2017).
- Ministry of Environment Protection of the People’s Republic of China. National Environmental Protection 12th Five-Year Plan, (2011). Available online: http://www.zhb.gov.cn/gzfw_13107/ghjh/wngh/ (accessed on 3 July 2017).
- Lin, B. China Energy Development Report 2012; Press of Peking University: Beijing, China, 2012. [Google Scholar]
- Gao, J.; Yuan, Z.; Liu, X.; Xia, X.; Huang, X.; Dong, Z. Improving air pollution control policy in China—A perspective based on cost–benefit analysis. Sci. Total Environ. 2016, 543, 307–314. [Google Scholar] [CrossRef] [PubMed]
- Zhang, Q.; Crooks, R. Toward an Environmentally Sustainable Future: Country Environmental Analysis of the People’s Republic of China; Asian Development Bank: Mandaluyong City, Philippines, 2012. [Google Scholar]
- Logue, J.M.; Price, P.N.; Sherman, M.H.; Singer, B.C. A method to estimate the chronic health impact of air pollutants in US residences. Environ. Health Perspect. 2012, 120, 216. [Google Scholar] [CrossRef] [PubMed]
- Sundell, J.; Levin, H.; Nazaroff, W.W.; Cain, W.S.; Fisk, W.J.; Grimsrud, D.T.; Samet, J.M. Ventilation rates and health: Multidisciplinary review of the scientific literature. Indoor Air 2011, 21, 191–204. [Google Scholar] [CrossRef] [PubMed]
- Huang, H.; Lee, S.C.; Cao, J.J.; Zou, C.W.; Chen, X.G.; Fan, S.J. Characteristics of indoor/outdoor PM2.5 and elemental components in generic urban, roadside and industrial plant areas of Guangzhou City, China. J. Environ. Sci. 2007, 19, 35–43. [Google Scholar] [CrossRef]
- Riley, W.J.; McKone, T.E.; Lai, A.C.; Nazaroff, W.W. Indoor particulate matter of outdoor origin: Importance of size-dependent removal mechanisms. Environ. Sci. Technol. 2002, 36, 200–207. [Google Scholar] [CrossRef] [PubMed]
- Tian, L.; Zhang, G.; Lin, Y.; Yu, J.; Zhou, J.; Zhang, Q. Mathematical model of particle penetration through smooth/rough building envelop leakages. Build. Environ. 2009, 44, 1144–1149. [Google Scholar] [CrossRef]
- Abt, E.; Suh, H.H.; Catalano, P.; Koutrakis, P. Relative contribution of outdoor and indoor particle sources to indoor concentrations. Environ. Sci. Technol. 2000, 34, 3579–3587. [Google Scholar] [CrossRef]
- Long, C.M.; Suh, H.H.; Koutrakis, P. Characterization of indoor particle sources using continuous mass and size monitors. J. Air Waste Manag. Assoc. 2000, 50, 1236–1250. [Google Scholar] [CrossRef] [PubMed]
- Seppänen, O.A.; Fisk, W.J.; Mendell, M.J. Association of ventilation rates and CO2 concentrations with health andother responses in commercial and institutional buildings. Indoor Air 1999, 9, 226–252. [Google Scholar] [CrossRef] [PubMed]
- Fang, L.; Wyon, D.P.; Clausen, G.; Fanger, P.O. Impact of indoor air temperature and humidity in an office on perceived air quality, SBS symptoms and performance. Indoor Air 2004, 14, 74–81. [Google Scholar] [CrossRef] [PubMed]
- Landrigan, P.J. Environmental hazards for children in USA. Int. J. Occup. Med. Environ. Health 1997, 11, 189–194. [Google Scholar]
- Faustman, E.M.; Silbernagel, S.M.; Fenske, R.A.; Burbacher, T.M.; Ponce, R.A. Mechanisms underlying Children’s susceptibility to environmental toxicants. Environ. Health Perspect. 2000, 108 (Suppl. 1), 13. [Google Scholar] [CrossRef] [PubMed]
- Bakó-Biró, Z.; Wargocki, P.; Weschler, C.J.; Fanger, P.O. Effects of pollution from personal computers on perceived air quality, SBS symptoms and productivity in offices. Indoor Air 2004, 14, 178–187. [Google Scholar] [CrossRef] [PubMed]
- Shaughnessy, R.J.; Haverinen-Shaughnessy, U.; Nevalainen, A.; Moschandreas, D. A preliminary study on the association between ventilation rates in classrooms and student performance. Indoor Air 2006, 16, 465–468. [Google Scholar] [CrossRef] [PubMed]
- Haverinen-Shaughnessy, U.; Moschandreas, D.J.; Shaughnessy, R.J. Association between substandard classroom ventilation rates and students’ academic achievement. Indoor Air 2011, 21, 121–131. [Google Scholar] [CrossRef] [PubMed]
- Canha, N.; Mandin, C.; Ramalho, O.; Wyart, G.; Ribéron, J.; Dassonville, C.; Hänninen, O.; Almeida, S.M.; Derbez, M. Assessment of ventilation and indoor air pollutants in nursery and elementary schools in France. Indoor Air 2015, 26, 350–365. [Google Scholar] [CrossRef] [PubMed]
- Daisey, J.M.; Angell, W.J.; Apte, M.G. Indoor air quality, ventilation and health symptoms in schools: An analysis of existing information. Indoor Air 2003, 13, 53–64. [Google Scholar] [CrossRef] [PubMed]
- De Gennaro, G.; Farella, G.; Marzocca, A.; Mazzone, A.; Tutino, M. Indoor and outdoor monitoring of volatile organic compounds in school buildings: Indicators based on health risk assessment to single out critical issues. Int. J. Environ. Res. Public Health 2013, 10, 6273–6291. [Google Scholar] [CrossRef] [PubMed]
- Razali, N.Y.Y.; Latif, M.T.; Dominick, D.; Mohamad, N.; Sulaiman, F.R.; Srithawirat, T. Concentration of particulate matter, CO and CO2 in selected schools in Malaysia. Build. Environ. 2015, 87, 108–116. [Google Scholar] [CrossRef]
- Zwoździak, A.; Sówka, I.; Krupińska, B.; Zwoździak, J.; Nych, A. Infiltration or indoor sources as determinants of the elemental composition of particulate matter inside a school in Wrocław, Poland. Build. Environ. 2013, 66, 173–180. [Google Scholar] [CrossRef]
- Amato, F.; Rivas, I.; Viana, M.; Moreno, T.; Bouso, L.; Reche, C.; Àlvarez-Pedrerol, M.; Alastuey, A.; Sunyer, J.; Querol, X. Sources of indoor and outdoor PM2.5 concentrations in primary schools. Sci. Total Environ. 2014, 490, 757–765. [Google Scholar] [CrossRef] [PubMed]
- Janssen, N.A.; Brunekreef, B.; van Vliet, P.; Aarts, F.; Meliefste, K.; Harssema, H.; Fischer, P. The relationship between air pollution from heavy traffic and allergic sensitization, bronchial hyperresponsiveness, and respiratory symptoms in Dutch schoolchildren. Environ. Health Perspect. 2003, 111, 1512. [Google Scholar] [CrossRef] [PubMed]
- Yang, W.; Sohn, J.; Kim, J.; Son, B.; Park, J. Indoor air quality investigation according to age of the school buildings in Korea. J. Environ. Manag. 2009, 90, 348–354. [Google Scholar] [CrossRef] [PubMed]
- Mullen, N.A.; Bhangar, S.; Hering, S.V.; Kreisberg, N.M.; Nazaroff, W.W. Ultrafine particle concentrations and exposures in six elementary school classrooms in northern California. Indoor Air 2011, 21, 77–87. [Google Scholar] [CrossRef] [PubMed]
- Lefcoe, N.M.; Inculet, I.I. Particulates in Domestic Premises: II. Ambient Levels and Indoor-Outdoor Relationships. Arch. Environ. Health Int. J. 1975, 30, 565–570. [Google Scholar] [CrossRef]
- Raunemaa, T.; Kulmala, M.; Saari, H.; Olin, M.; Kulmala, M.H. Indoor air aerosol model: Transport indoors and deposition of fine and coarse particles. Aerosol Sci. Technol. 1989, 11, 11–25. [Google Scholar] [CrossRef]
- Majumdar, D.; Gajghate, D.G.; Pipalatkar, P.; Chalapati Rao, C.V. Assessment of airborne fine particulate matter and particle size distribution in settled chalk dust during writing and dusting exercises in a classroom. Indoor Built Environ. 2012, 21, 541–551. [Google Scholar] [CrossRef]
- Griffiths, M.; Eftekhari, M. Control of CO2 in a naturally ventilated classroom. Energy Build. 2008, 40, 556–560. [Google Scholar] [CrossRef]
- Ramalho, O.; Mandin, C.; Ribéron, J.; Wyart, G. Air stuffiness and air exchange rate in French schools and day-care centres. Int. J. Vent. 2013, 12, 175–180. [Google Scholar] [CrossRef]
- Ministry of Housing and Urban-Rural Development of the People’s Republic of China. China Public Building Energy Saving Standard (GB50189-2005) (2005). Available online: http://www.mohurd.gov.cn/wjfb/index.html (accessed on 3 July 2017).
Figure 1.
Location of selected primary schools in Tai’an City.

Figure 2.
Daily mean particulate matter (PM) concentrations during the measurement period. Source: Online Analysis Platform for China Ambient Air Quality (https://www.aqistudy.cn/).
Figure 2.
Daily mean particulate matter (PM) concentrations during the measurement period. Source: Online Analysis Platform for China Ambient Air Quality (https://www.aqistudy.cn/).

Figure 3.
Indoor/outdoor (I/O) ratio on average for unoccupied classrooms.

Figure 4.
Air cracks in school buildings.

Figure 5.
Indoor and outdoor PM2.5 levels in School D during the unoccupied period.

Figure 6.
Indoor and outdoor PM10 levels in School D during the unoccupied period.

Figure 7.
Hourly average temperature in the occupied classrooms during the measured days.

Figure 8.
Indoor PM concentration/Outdoor PM concentration (I/O ratio) in average during an occupied period.
Figure 8.
Indoor PM concentration/Outdoor PM concentration (I/O ratio) in average during an occupied period.

Figure 9.
Chalk dust in classrooms.

Figure 10.
CO2 performance in occupied classrooms.


Table 1.
Characteristics of selected schools.
| A | B | C | D | |
|---|---|---|---|---|
| Size of classroom | 70.56 m2 | 70 m2 | 65 m2 | 72 m2 |
| Number of students | 40 | 40 | 40 | 40 |
| Height of classrooms | 3.6 m | 3.3 m | 3.4 m | 3.6 m |
| Constructed year | Refurbished in 2005 | 2015 | 2003 | 2005 |
| Wall-U value | 0.6 W/(m2K) | 0.38 W/(m2K) | 0.6 W/(m2K) | |
| Roof-U value | 0.55 W/(m2K) | 0.28 W/(m2K) | 0.55 W/(m2K) | |
| Window type | Double glazed | Triple glazed | Single glazed | Double glazed |
| Window U value | 2.3 W/(m2K) | 1.9 W/(m2K) | - | 2.3 W/(m2K) |
| Air tightness | 4 (2.5 ≥ Q > 2.0) | 6(1.5 ≥ Q > 1.0) | ≤3(Q ≥3.0) | 4(2.5 ≥ Q > 2.0) |
Note: (1) before 2005, no thermal requirements were set for public buildings, therefore public buildings constructed before 2005 have no insulation, and the windows were single glazed. Also, the air tightness level was below 4. (2) Q is defined as the air volume flow rate per meter in length of cracks per hour (m3/m·h). (3) Air tightness for windows and doors were divided into five levels in 2002 based on the building regulation of GB/T7106-2002. In 2008, the new building regulation of GB/T7106-2008 divided the air tightness into eight levels, where the higher the level the better the air tightness. (4) The earliest air tightness requirement of windows and doors was from the China Public Building Energy Saving Standard GB50189-2005, and 4 was set as the minimum air tightness level in 2005. Now the number has been replaced by 6 according to the latest China Public Building Energy Saving Standard GB50189-2015.
Table 2.
Guideline values for air quality pollutants from WHO, CIBSE, and China.
| Substance | Averaging Time | WHO Guideline Value | China Standard GB T18883-2002 | CIBSE Guide A |
|---|---|---|---|---|
| PM2.5 | Annual mean | 10 μg/m3 | 15 μg/m3 | |
| 24-h mean | 25 μg/m3 | 35 μg/m3 | ||
| PM10 | Annual mean | 20 μg/m3 | 40 μg/m3 | |
| 24-h mean | 50 μg/m3 | 50 μg/m3 | ||
| CO2 | Occupied period | <600 ppm (acceptable) | 1000 ppm | |
| 600–1300 ppm (complains) | ||||
| 1300 ppm (very bad) | ||||
| Indoor air temperature | Occupied period | 21–23 °C for summer | ||
| 19–21 °C for winter |
Table 3.
Readings of PM2.5 and PM10 in occupied classrooms.
| PM2.5 Concentration (μg/m3) (Measured in the Morning School Hours) | PM10 Concentration (μg/m3) (Measured in the Afternoon School Hours) | |||||
|---|---|---|---|---|---|---|
| Highest | Mean | Lowest | Highest | Mean | Lowest | |
| A | 202 | 149 | 126 | 228 | 138 | 80 |
| B | 246 | 190 | 147 | 202 | 143 | 104 |
| C | 249 | 175 | 118 | 267 | 177 | 126 |
| D | 274 | 199 | 158 | 251 | 205 | 179 |
Table 4.
Readings of PM2.5 and PM10 in unoccupied classrooms.
| PM2.5 Concentration (μg/m3) (Measured in the Morning of Weekend) | PM10 Concentration (μg/m3) (Measured in the Afternoon of Weekend) | |||||
|---|---|---|---|---|---|---|
| Highest | Mean | Lowest | Highest | Mean | Lowest | |
| A | 88 | 59 | 42 | 49 | 45 | 37 |
| B | 68 | 49 | 32 | 46 | 41 | 33 |
| C | 122 | 93 | 69 | 124 | 99 | 81 |
| D | 221 | 172 | 130 | 191 | 156 | 133 |
Table 5.
Indoor air temperature performance.
| Indoor Air Temperature (°C) | Outdoor Air Temperature (°C) | |||
|---|---|---|---|---|
| Highest | Mean | Lowest | ||
| A | 17.4 | 12.7 | 11 | −2–10 |
| B | 23 | 19.4 | 16.1 | −3–11 |
| C | 13.3 | 11.5 | 9 | −3–12 |
| D | 16 | 14 | 13.2 | −1–11 |
Note 4: Outdoor air temperature was obtained from local weather forecast stations.
Table 6.
Readings of carbon dioxide in occupied classrooms.
| CO2 Concentration (ppm) | |||
|---|---|---|---|
| Highest | Mean | Lowest | |
| A | 3506 | 1363 | 476 |
| B | 4692 | 1932 | 492 |
| C | 2258 | 1237 | 662 |
| D | 3986 | 1497 | 477 |
© 2017 by the authors. Licensee MDPI, Basel, Switzerland. This article is an open access article distributed under the terms and conditions of the Creative Commons Attribution (CC BY) license (http://creativecommons.org/licenses/by/4.0/).
Share and Cite
MDPI and ACS Style
Peng, Z.; Deng, W.; Tenorio, R. Investigation of Indoor Air Quality and the Identification of Influential Factors at Primary Schools in the North of China. Sustainability 2017, 9, 1180. https://0-doi-org.brum.beds.ac.uk/10.3390/su9071180
AMA Style
Peng Z, Deng W, Tenorio R. Investigation of Indoor Air Quality and the Identification of Influential Factors at Primary Schools in the North of China. Sustainability. 2017; 9(7):1180. https://0-doi-org.brum.beds.ac.uk/10.3390/su9071180
Chicago/Turabian StylePeng, Zhen, Wu Deng, and Rosangela Tenorio. 2017. "Investigation of Indoor Air Quality and the Identification of Influential Factors at Primary Schools in the North of China" Sustainability 9, no. 7: 1180. https://0-doi-org.brum.beds.ac.uk/10.3390/su9071180
Note that from the first issue of 2016, this journal uses article numbers instead of page numbers. See further details here.