Correlations between Socioeconomic Drivers and Indicators of Urban Expansion: Evidence from the Heavily Urbanised Shanghai Metropolitan Area, China

Abstract
:1. Introduction
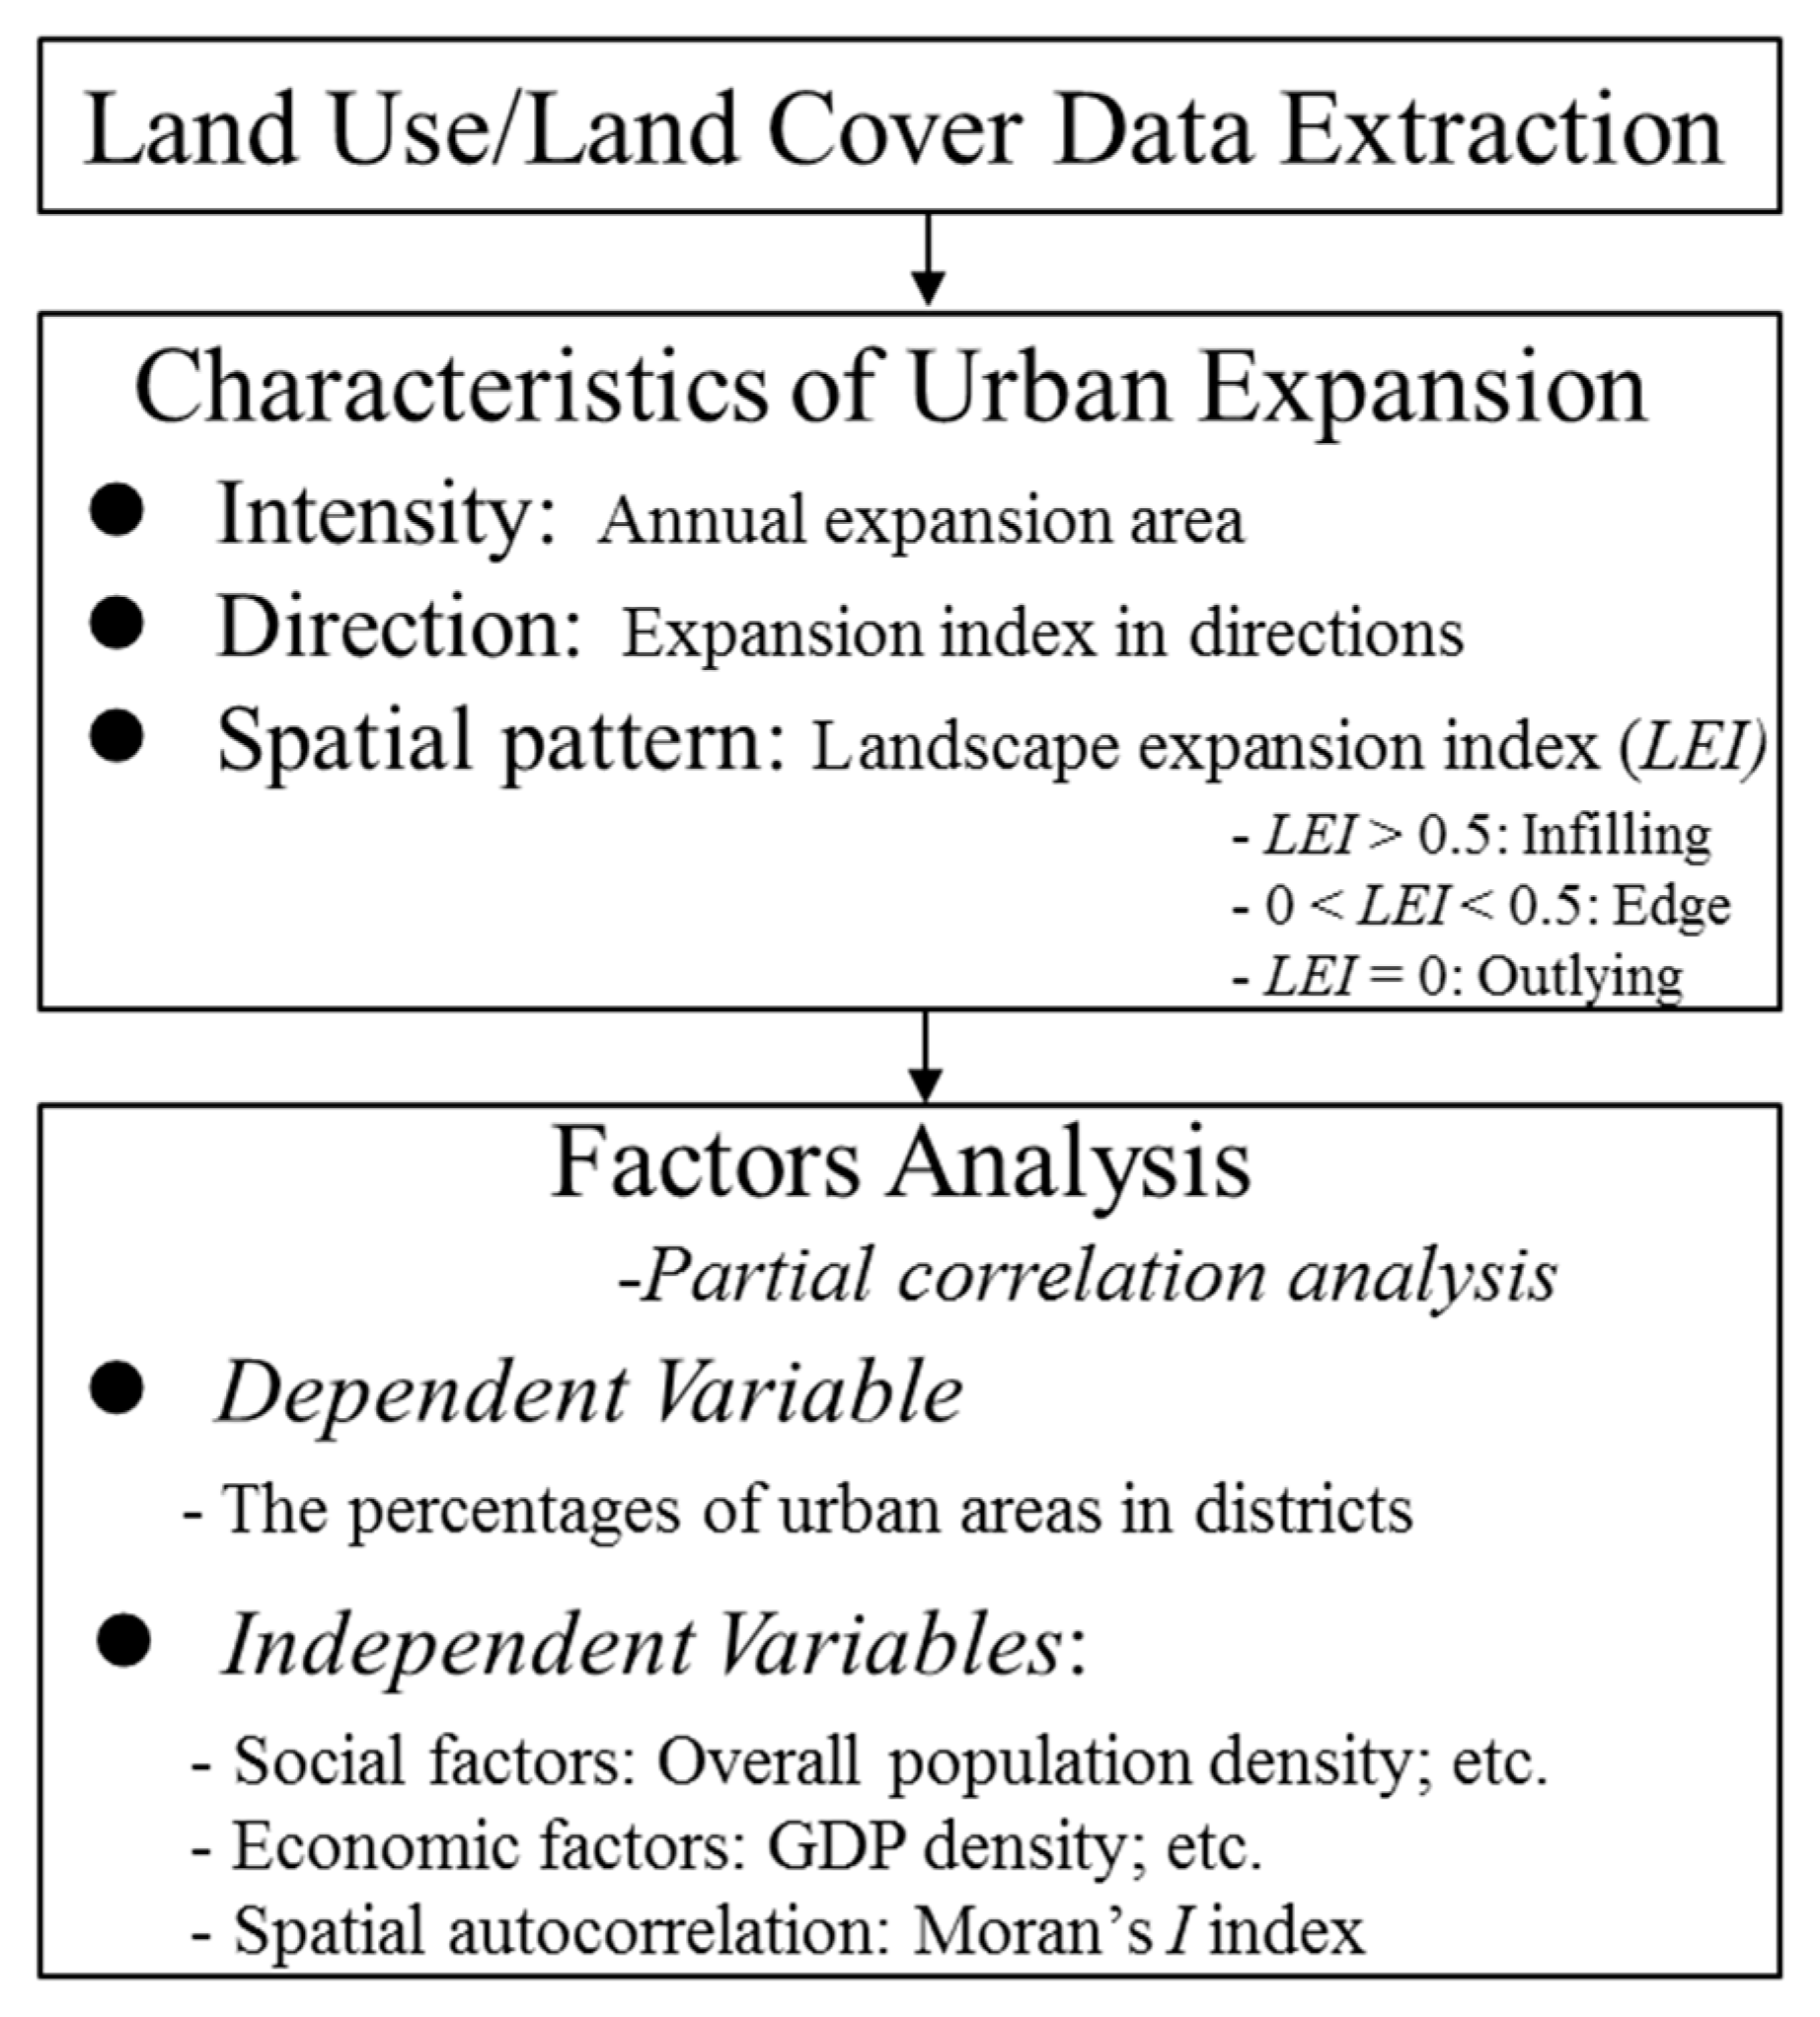
2. Method
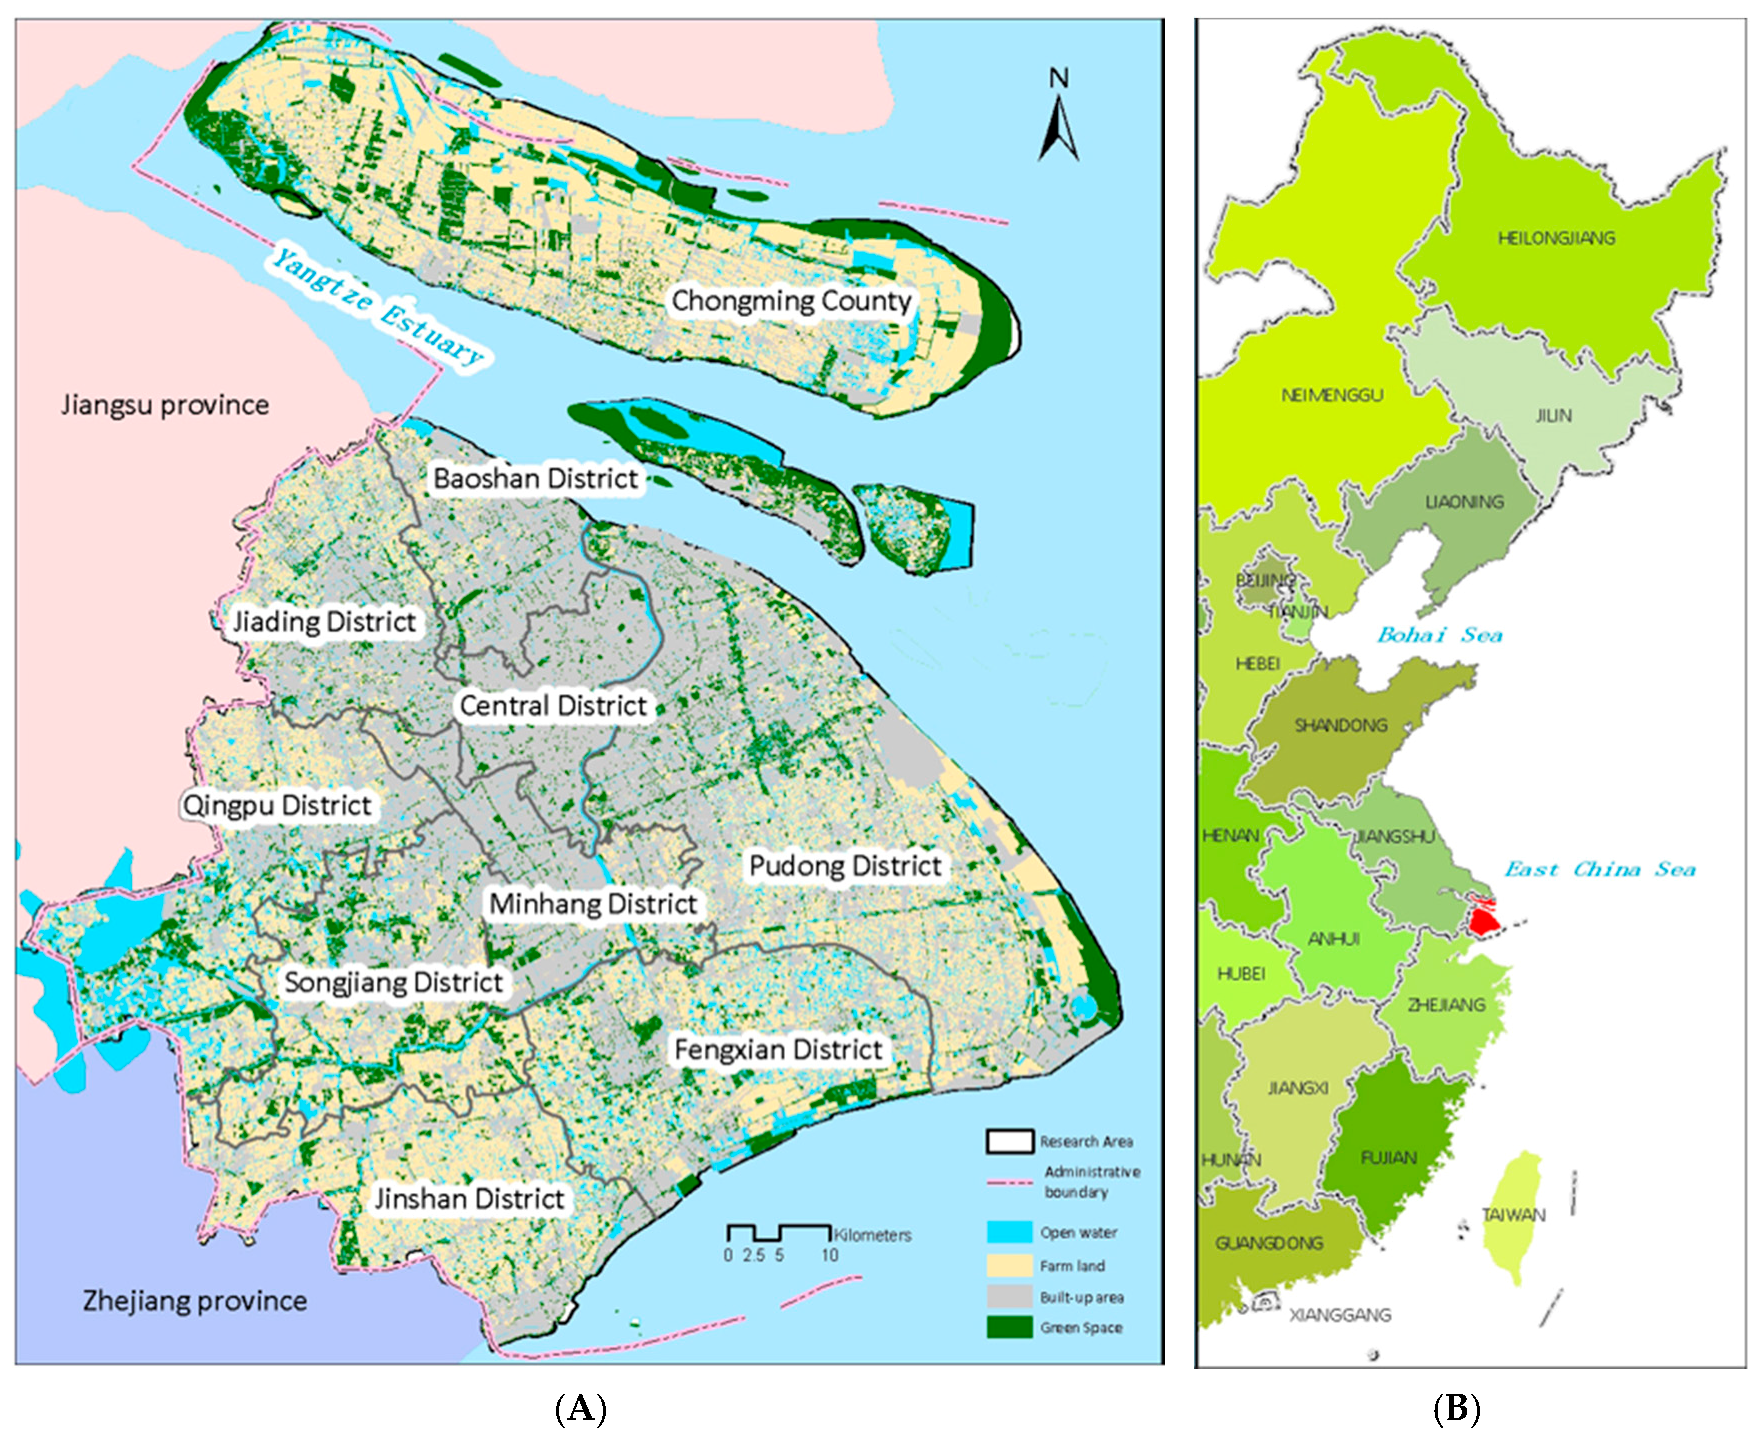
2.1. Study Area
2.2. Land Use/Land Cover (LULC) Data Extraction
2.3. Quantifying the Intensity, Direction and Spatial Pattern of Urban Expansion
2.4. Socioeconomic Indicator Selection
2.5. Spatial Autocorrelation
2.6. Factor Analysis
3. Results
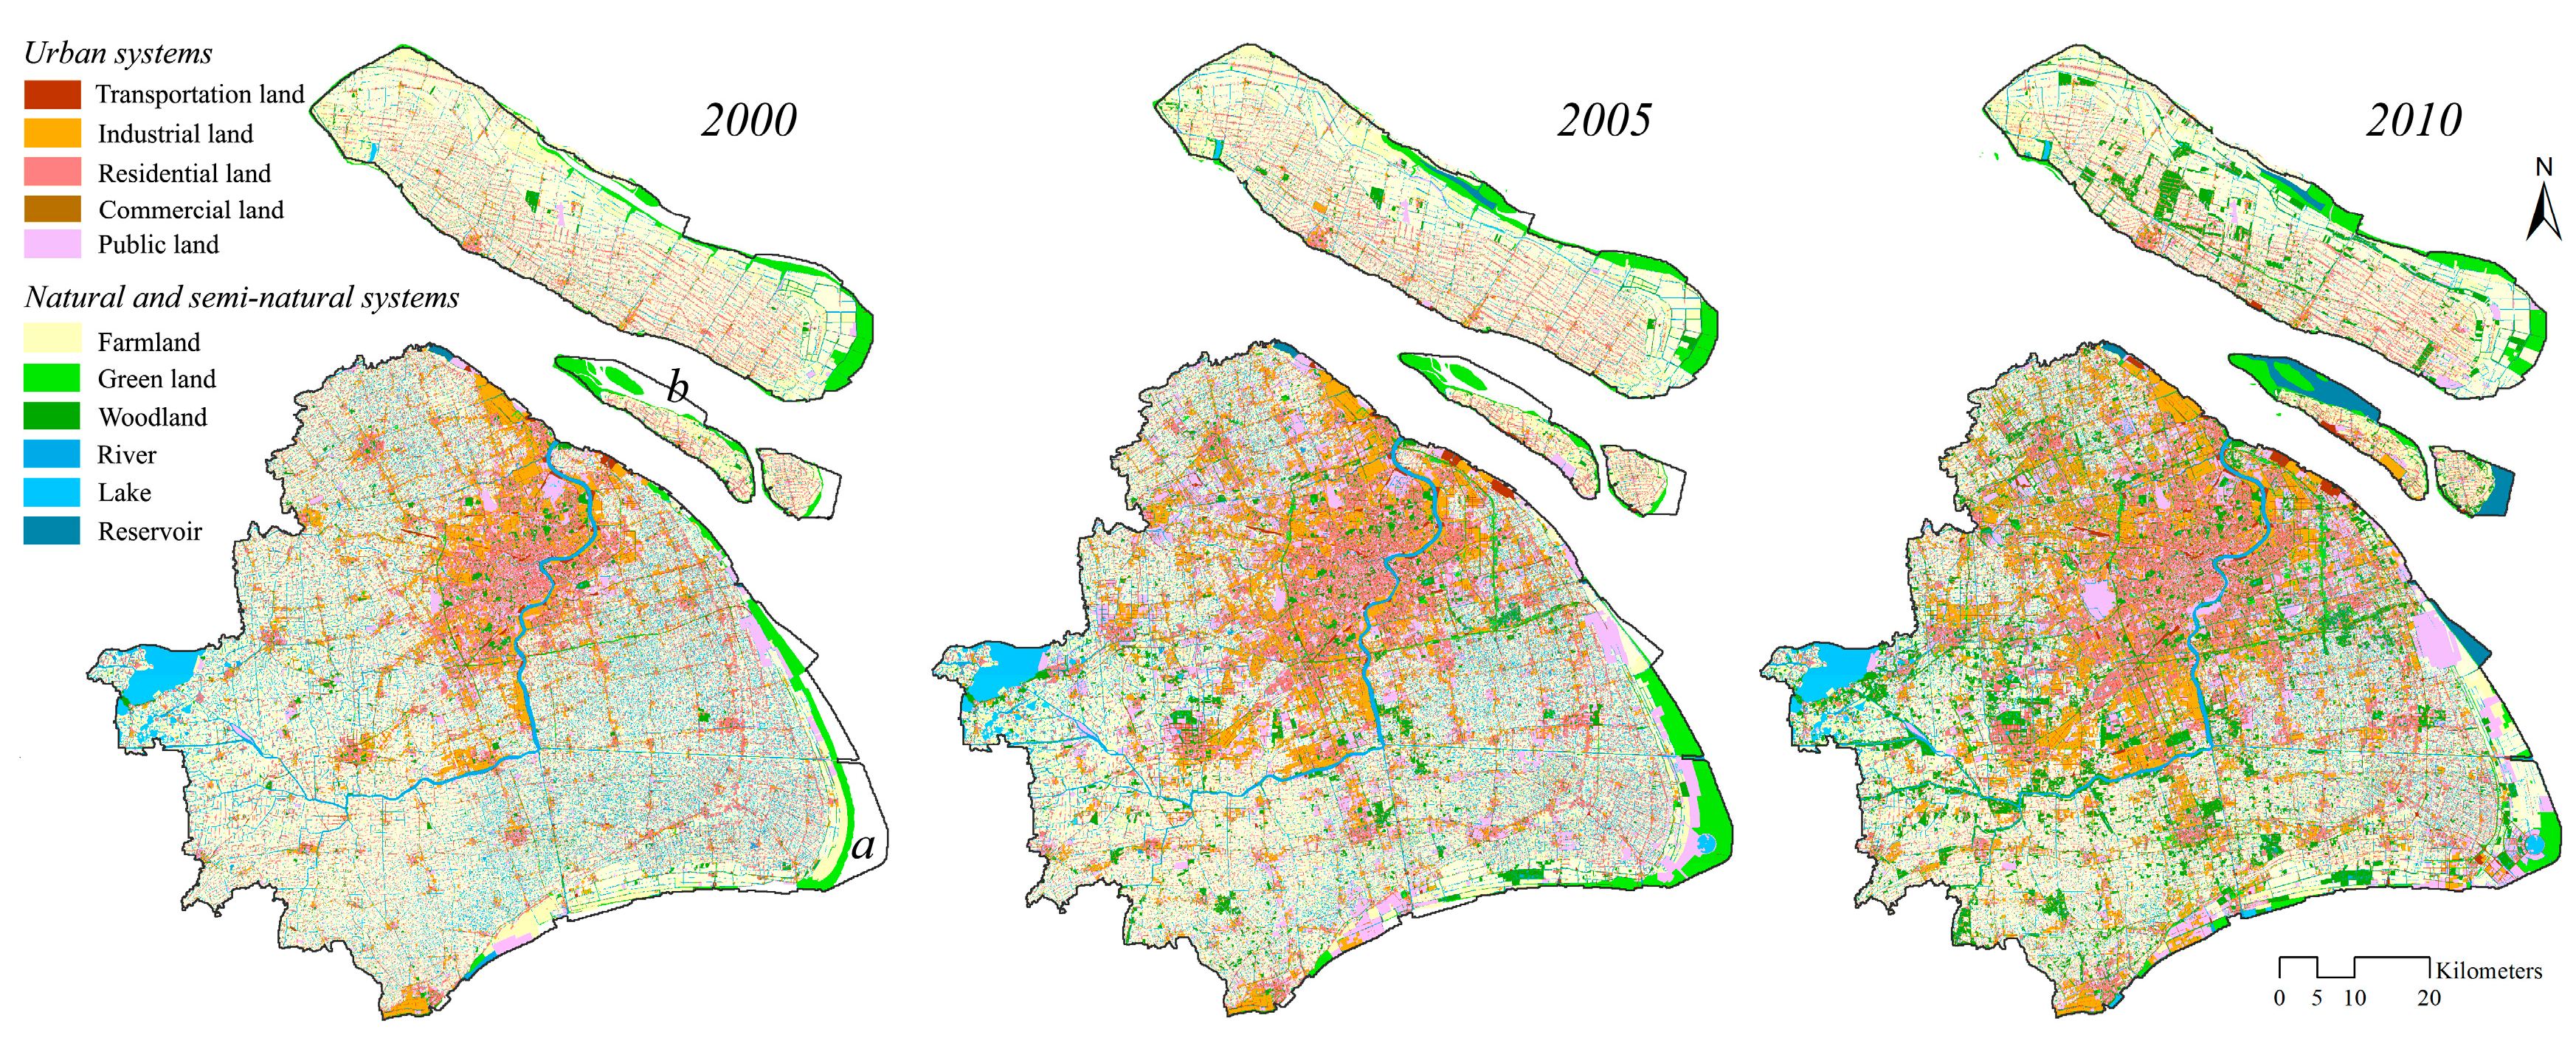
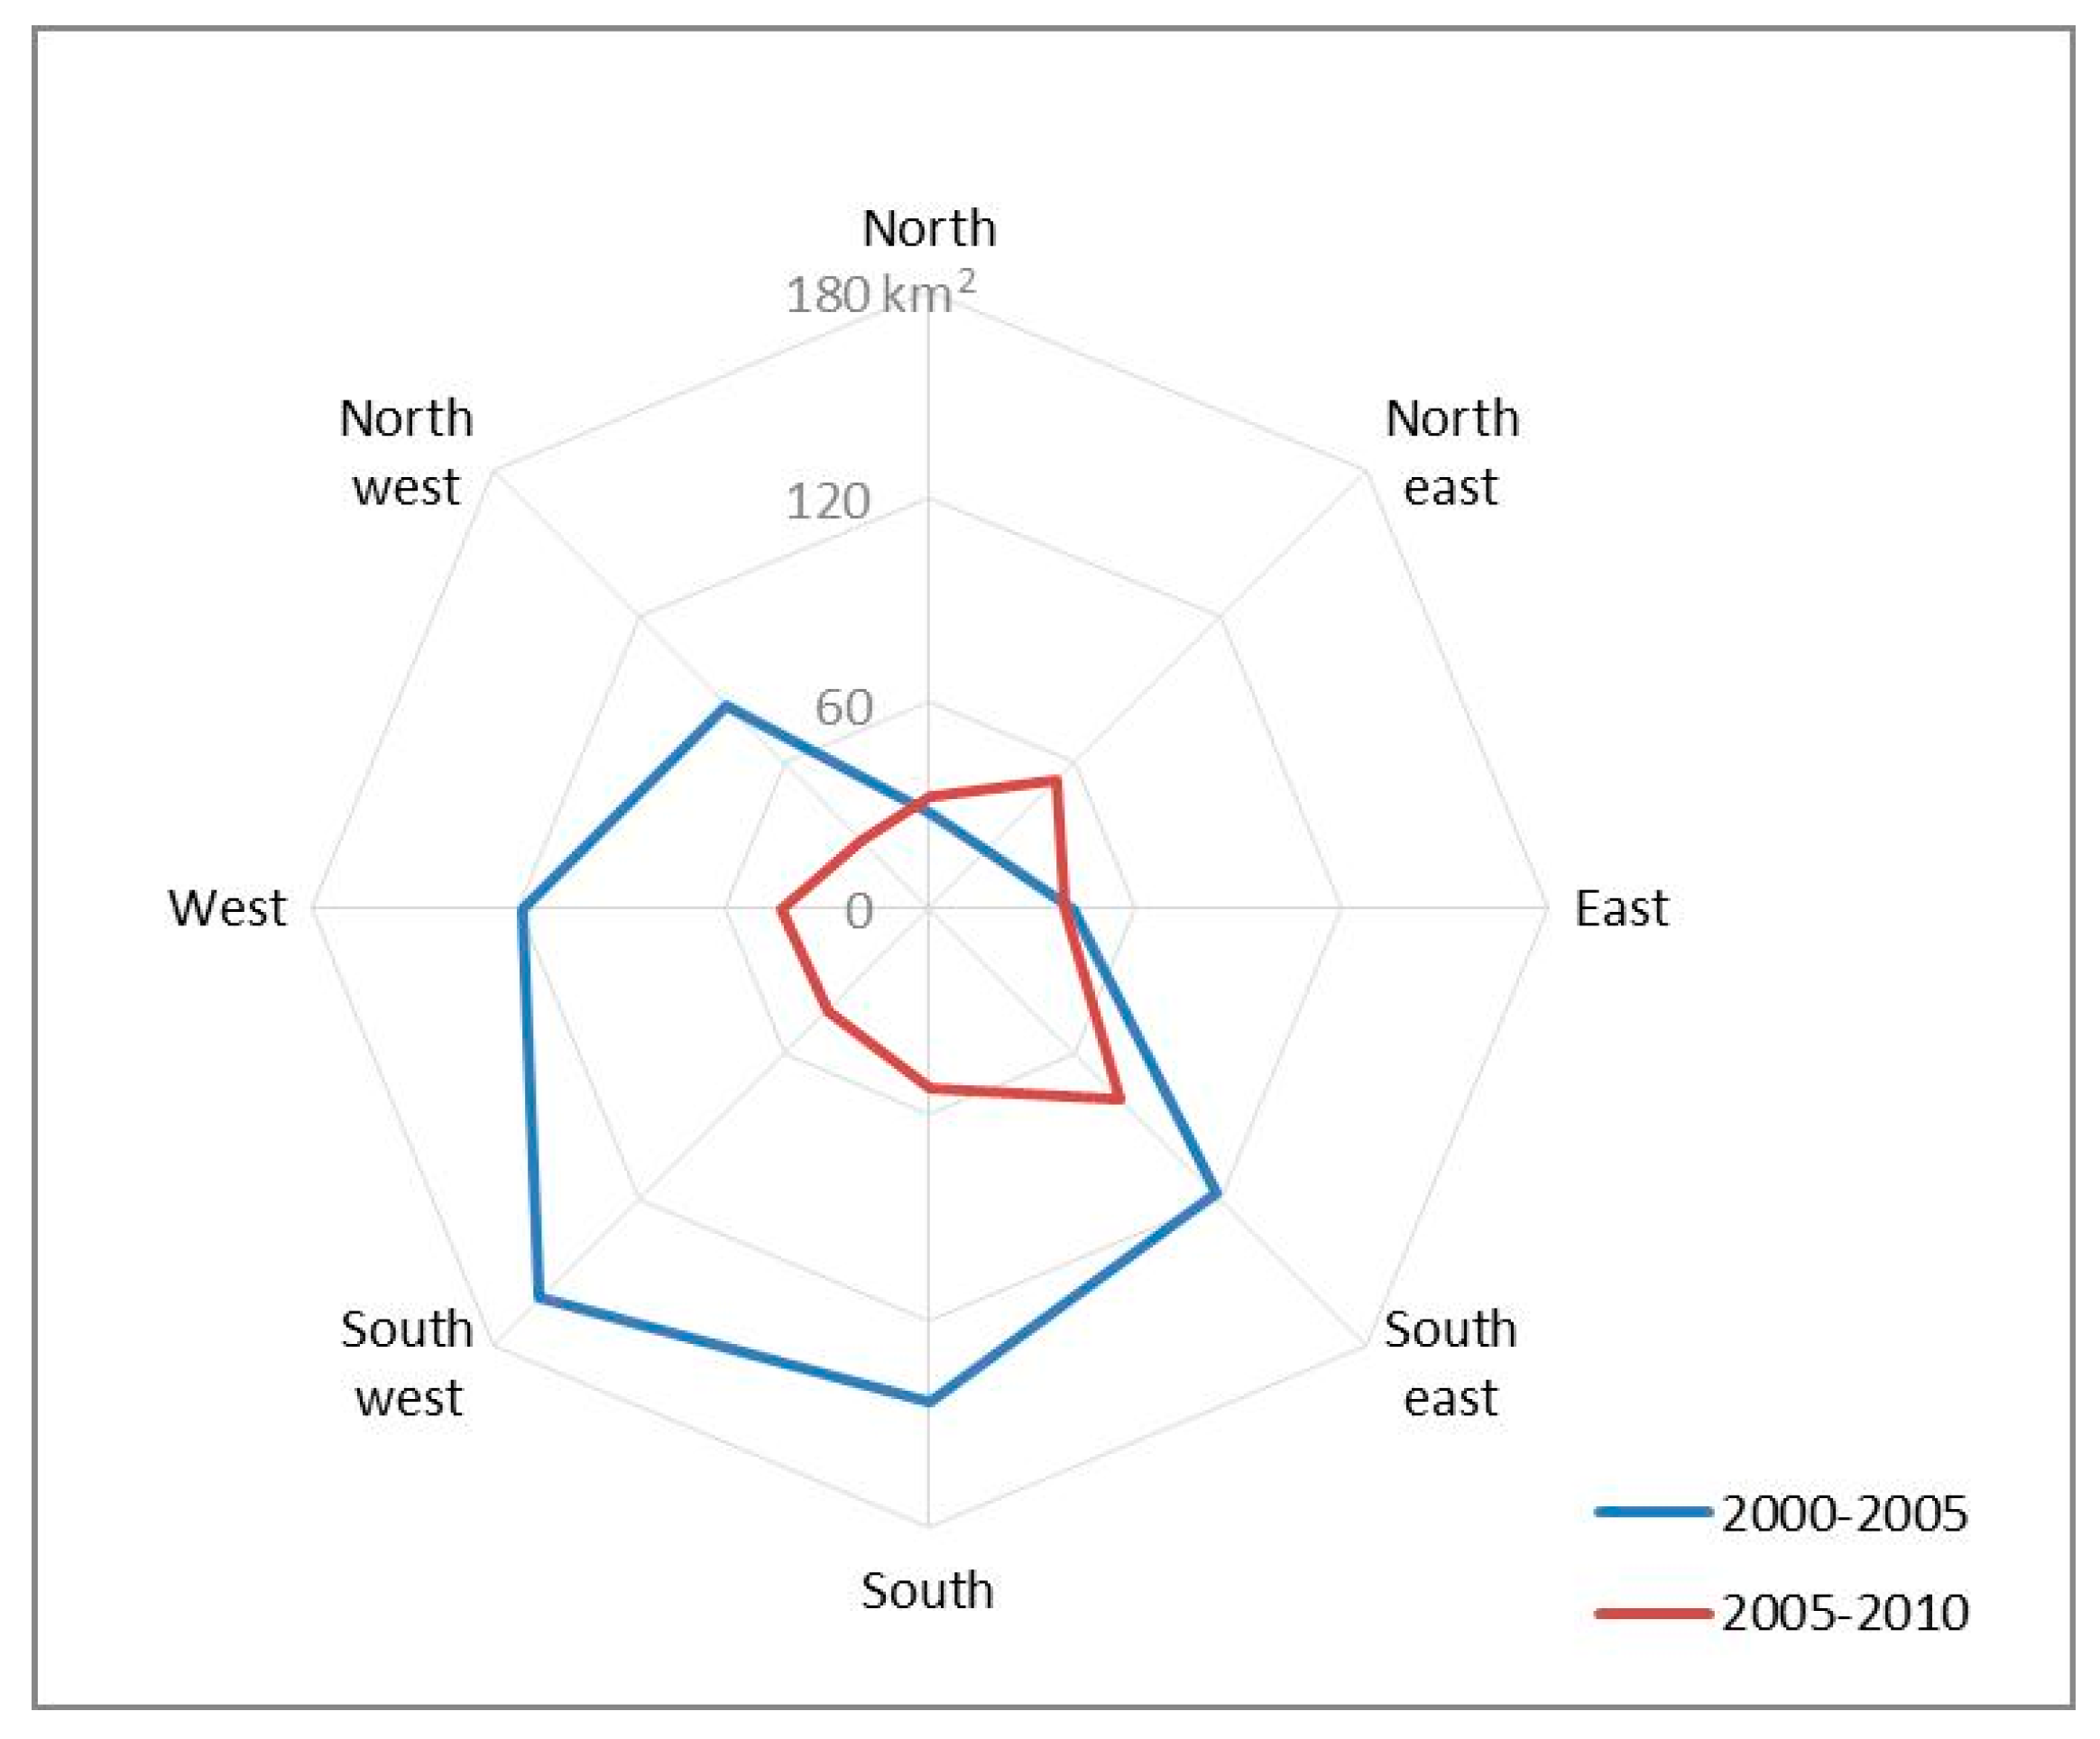
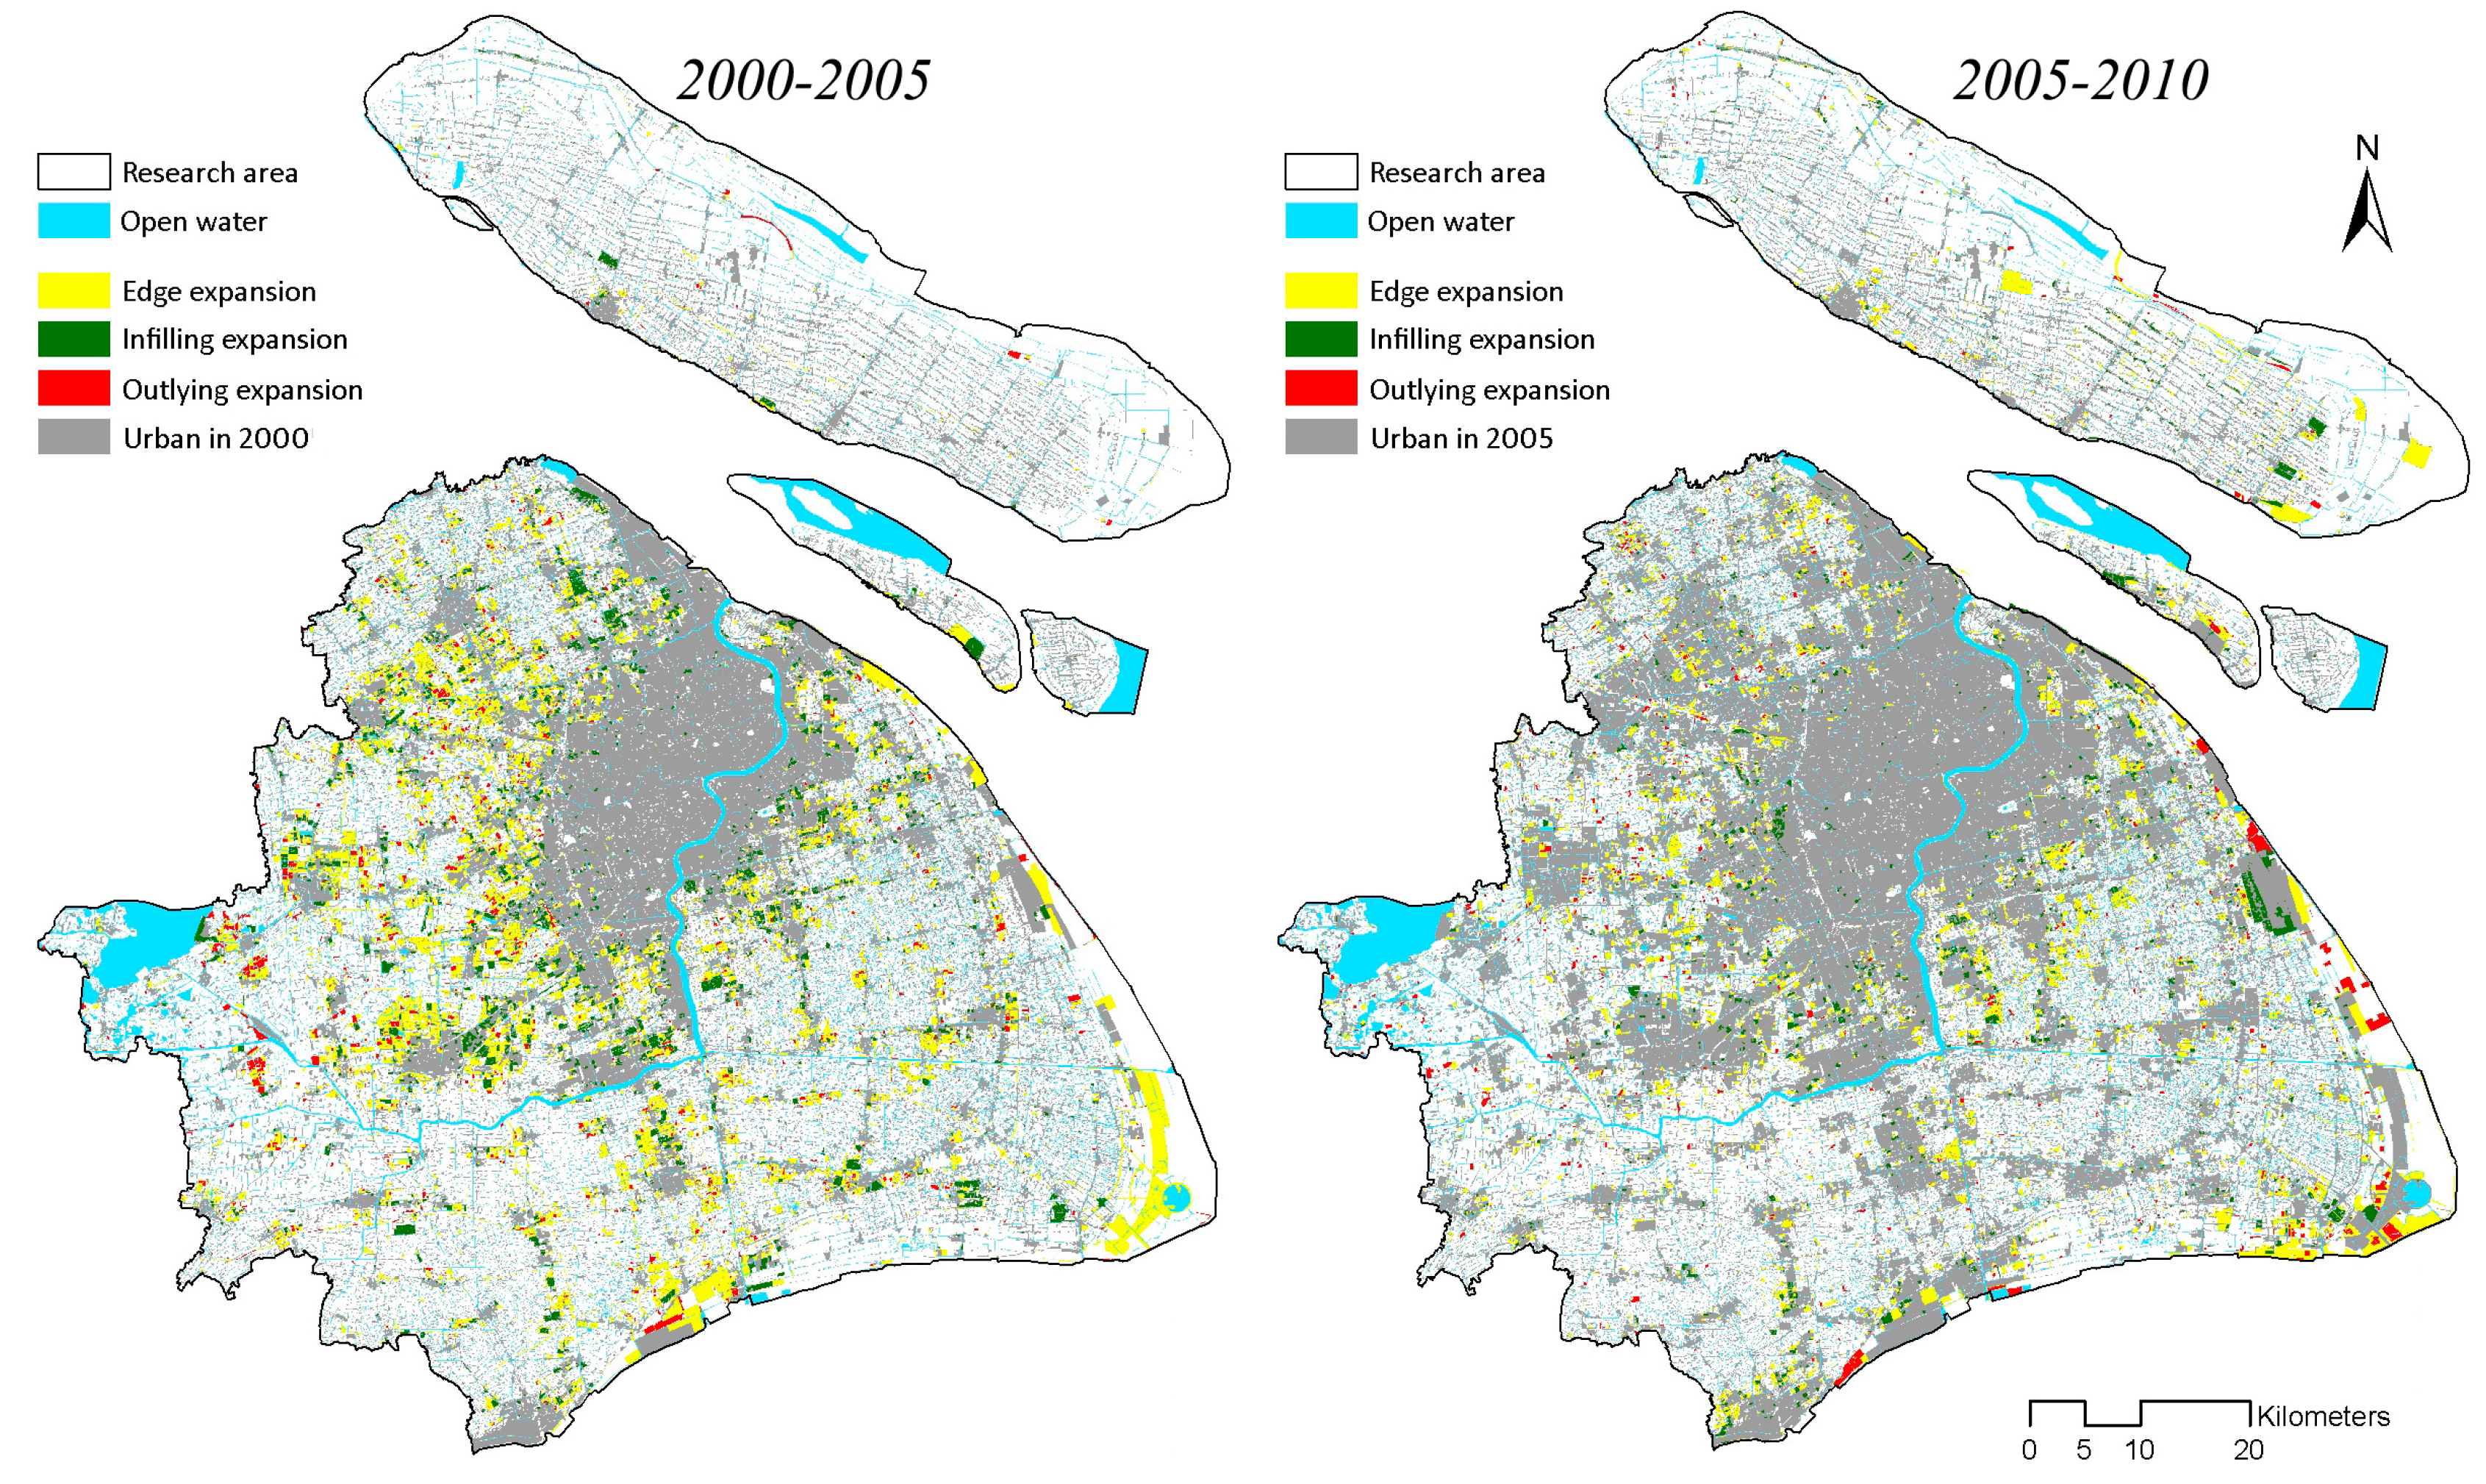
3.1. Urban Expansion Characteristics
3.2. Urban Expansion Factor Analysis
4. Discussion
5. Conclusions
Supplementary Materials
Acknowledgments
Author Contributions
Conflicts of Interest
References
- United Nations. World Urbanization Prospects: The 2011 Revision; United Nations Population Division: New York, NY, USA, 2011. [Google Scholar]
- National Bureau of Statistics of China (NBSC). China Statistical Yearbook; China Statistics Press: Beijing, China, 2011. (In Chinese)
- Grimm, N.B.; Faeth, S.H.; Golubiewski, N.E.; Redman, C.L.; Wu, J.G.; Bai, X.M.; Briggs, J.M. Global change and the ecology of cities. Science 2008, 319, 756–760. [Google Scholar] [CrossRef] [PubMed]
- United Nations. World Urbanization Prospects: The 2014 Revision, Highlights; (ST/ESA/SER.A/352); United Nations Population Division: New York, NY, USA, 2014. [Google Scholar]
- Qureshi, S.; Haase, D. Compact, eco-, hybrid or teleconnected? Novel aspects of urban ecological research seeking compatible solutions to socio-ecological complexities. Ecol. Indic. 2014, 42, 1–5. [Google Scholar] [CrossRef]
- Larondelle, N.; Lauf, S. Balancing demand and supply of multiple urban ecosystem services on Different spatial scales. Ecosyst. Serv. 2016, 22, 18–31. [Google Scholar] [CrossRef]
- Haase, D.; Larondelle, N.; Andersson, E.; Artmann, M.; Borgström, S.; Breuste, J.; Gomez-Baggethun, E.; Gren, A.; Hamstead, Z.; Hansen, R.; et al. A quantitative review of urban ecosystem services assessment: Concepts, models and implementation. Ambio 2014, 43, 413–433. [Google Scholar] [CrossRef] [PubMed]
- Wu, G.J. Landscape Ecology: Pattern, Process, Scale and Hierarchy; Higher Education Press: Beijing, China, 2007. [Google Scholar]
- Yang, G.; Bowling, L.C.; Cherkauer, K.A.; Pijanowski, B.C. The impact of urban development on hydrologic regime from catchment to basin scales. Landsc. Urban Plan. 2011, 103, 237–247. [Google Scholar] [CrossRef]
- Li, X.M.; Zhou, W.Q.; Ouyang, Z.Y. Forty years of urban expansion in Beijing: What is the relative importance of physical, socioeconomic, and neighborhood factors? Appl. Geogr. 2013, 38, 1–10. [Google Scholar] [CrossRef]
- Seto, K.C.; Fragkias, M.; Güneralp, B.; Reilly, M.K. A meta-analysis of global urban land expansion. Available online: http://journals.plos.org/plosone/article?id=10.1371/journal.pone.0023777 (accessed on 6 July 2017).
- Alavipanah, S.; Haase, D.; Lakes, T.; Qureshi, S. Integrating the third dimension into the concept of urban ecosystem services: A review. Ecol. Indic. 2017, 72, 374–398. [Google Scholar] [CrossRef]
- Xu, L.H.; Yue, W.Z.; Cao, Y. Spatial scale effect of urban land use landscape pattern in Shanghai City. Chin. J. Appl. Ecol. 2007, 18, 2827–2834. [Google Scholar]
- Arsanjani, J.J.; Helbich, M.; Kainz, W.; Boloorani, A.D. Integration of logistic regression, Markov chain and cellular automata models to simulate urban expansion. Int. J. Appl. Earth Obs. Geoinform. 2013, 21, 265–275. [Google Scholar] [CrossRef]
- Tavares, A.O.; Pato, R.L.; Magalhães, M.C. Spatial and temporal land use change and occupation over the last half century in a peri-urban area. Appl. Geogr. 2012, 34, 432–444. [Google Scholar] [CrossRef]
- Thapa, R.B.; Murayama, Y. Drivers of urban growth in the Kathmandu valley, Nepal: Examining the efficacy of the analytic hierarchy process. Appl. Geogr. 2010, 30, 70–83. [Google Scholar] [CrossRef]
- Kuang, W.; Chi, W.; Lu, D.; Dou, Y. A comparative analysis of megacity expansions in China and the US: Patterns, rates and driving forces. Landsc. Urban Plan. 2014, 132, 121–135. [Google Scholar] [CrossRef]
- Zhu, H.; Li, Y.; Liu, Z.; Fu, B. Estimating the population distribution in a county area in China based on impervious surfaces. Photogramm. Eng. Remote Sens. 2015, 81, 155–163. [Google Scholar] [CrossRef]
- Ma, Q.; He, C.Y.; Wu, J.G. Behind the rapid expansion of urban impervious surfaces in China: Major influencing factors revealed by a hierarchical multiscale analysis. Land Use Policy 2016, 59, 434–445. [Google Scholar] [CrossRef]
- Deng, J.S.; Wang, K.; Hong, Y.; Qi, J.G. Spatio-temporal dynamics and evolution of land use change and landscape pattern in response to rapid urbanization. Landsc. Urban Plan. 2009, 92, 187–198. [Google Scholar] [CrossRef]
- Weng, Y.C. Spatiotemporal changes of landscape pattern in response to urbanization? Landsc. Urban Plan. 2007, 81, 341–353. [Google Scholar] [CrossRef]
- Li, C.; Zhao, J.; Xu, Y. Examining spatiotemporally varying effects of urban expansion and the underlying driving factors. Sustain. Cities Soc. 2017, 28, 307–320. [Google Scholar] [CrossRef]
- Zhou, X.; Chen, L.; Xiang, W.N. Quantitative analysis of the built-up area expansion in Su-Xi-Chang region, China. Chin. J. Appl. Ecol. 2014, 25, 1422–1430. [Google Scholar]
- Ma, Y.L.; Xu, R.S. Remote sensing monitoring and driving force analysis of urban expansion in Guangzhou City, China. Habitat Int. 2010, 34, 228–235. [Google Scholar] [CrossRef]
- Hegetschweiler, K.T.; Vries, S.D.; Arnberger, A.; Bell, S.; Brennan, M.; Siter, N.; Olafsson, A.S.; Voigt, A.; Hunziker, M. Linking demand and supply factors in identifying cultural ecosystem services of urban green infrastructures: A review of European studies. Urban For. Urban Green. 2017, 21, 48–59. [Google Scholar] [CrossRef]
- Chen, J.L.; Gao, J.L.; Chen, W. Urban land expansion and the transitional mechanisms in Nanjing, China. Habitat Int. 2016, 53, 274–283. [Google Scholar] [CrossRef]
- Wei, Y.D. Zone fever, project fever: Economic transition, development policy, and urban expansion in China. Geogr. Rev. 2015, 105, 156–177. [Google Scholar] [CrossRef]
- Huang, Z.; Wei, Y.D.; He, C.; Li, H. Urban land expansion under economic transition in China: A multi-level modeling analysis. Habitat Int. 2015, 47, 69–82. [Google Scholar] [CrossRef]
- Xiong, L.X.; Huang, J.M. The review and prospect of Shanghai comprehensive plan in the opening-up and reform era. Urban Plan. Forum 2012, 2, 97–100. [Google Scholar]
- Müller, K.; Steinmeier, C.; Küchler, M. Urban growth along motorways in Switzerland. Landsc. Urban Plan. 2010, 98, 3–12. [Google Scholar] [CrossRef]
- Liu, X.P.; Li, X.; Chen, Y.M.; Tan, Z.Z.; Li, S.Y.; Ai, B. A new landscape index for quantifying urban expansion using multi-temporal remotely sensed data. Landsc. Ecol. 2010, 25, 671–682. [Google Scholar] [CrossRef]
- Wei, Y.D.; Li, H.; Yue, W.Z. Urban land expansion and regional inequality in transitional China. Landsc. Urban Plan. 2017, 163, 17–31. [Google Scholar] [CrossRef]
- Jiang, L.; Deng, X.; Seto, K.C. Multi-level modeling of urban expansion and cultivated land conversion for urban hotspot counties in China. Landsc. Urban Plan. 2012, 108, 131–139. [Google Scholar] [CrossRef]
- Zeng, C.; Yang, L.D.; Dong, J.N. Management of urban land expansion in China through intensity assessment: A big data perspective. J. Clean. Prod. 2017, 153, 637–647. [Google Scholar] [CrossRef]
- Yue, W.Z.; Wang, R.L.; Fan, P.L. Spatial patterns analysis of urban expansion in Hangzhou city. J. Zhejiang Univ. Sci. Ed. 2013, 40, 595–605. [Google Scholar]
- Kuang, W.H.; Liu, J.Y.; Shao, Q.Q.; Sun, C.Y. Spatio-temporal Patterns and Driving Forces of Urban Expansion in Beijing Central City Since 1932. J. Geo Inform. Sci. 2009, 11, 428–435. [Google Scholar] [CrossRef]
- Masucci, A.P.; Stanilov, K.; Batty, M. Limited Urban Growth: London’s Street Network Dynamics since the 18th Century. PLoS ONE 2013, 8, e69469. [Google Scholar] [CrossRef] [PubMed]
- André, S. Subcentres and Satellite Cities: Tokyo’s 20th Century Experience of Planned Polycentrism. Int. Plan. Stud. 2001, 6, 9–32. [Google Scholar]
- Outline of Shanghai Mater Plan (OSMP). Leading Group Office of Shanghai Master Plan (2015–2040); Shanghai, 2015; Available online: http://2040.shgtj.net (accessed on 6 July 2017). (In Chinese)
- Bai, Y.; Zhuang, C.W.; Ouyang, Z.Y.; Zheng, H.; Jiang, B. Spatial characteristics between biodiversity and ecosystem services in a human-dominated watershed. Ecol. Complex. 2011, 8, 177–183. [Google Scholar] [CrossRef]
- Hutchison, L.; Montagna, P.; Yoskowitz, D.; Scholz, D.; Tunnell, J. Stakeholder Perceptions of Coastal Habitat Ecosystem Services. Estuar. Coasts 2015, 38, 67–80. [Google Scholar] [CrossRef]
- Wu, K.; Zhang, H. Land use dynamics, built-up land expansion patterns, and driving forces analysis of the fast-growing Hangzhou metropolitan area, eastern China (1978–2008). Appl. Geogr. 2012, 34, 137–145. [Google Scholar] [CrossRef]
- Liang, P.; Ding, Y.H.; He, J.H.; Tang, X. Study of relationship between urbanization speed and change of spatial distribution of rainfall over Shanghai. J. Trop. Meteorol. 2011, 27, 475–483. [Google Scholar]
- Cao, A.L.; Zhang, H.; Zhang, Y.; Ma, W.C. Decadal changes of air temperature in Shanghai in recent 50 years and its relation to urbanization. Chin. J. Geophys. 2008, 51, 1663–1669. [Google Scholar]
- Wang, M.; Meng, H.; Bai, Y.; Su, J.H.; Sha, C.Y.; Zhang, M. Relationships between landscapes spatial pattern and land surface temperature in Shanghai. Ecol. Environ. Sci. 2013, 22, 343–350. [Google Scholar]
- Lu, C.; Wang, Y.W.; Cui, X.Z. Urban population density and urban sustainable land use—A case study of Guangdong province. China Civ. Eng. J. 2015, 45, 231–235. [Google Scholar]
- Alavipanah, S.S.; Wegmann, M.; Qureshi, S.; Weng, Q.; Koellner, T. The role of vegetation in mitigating urban land surface temperatures: A case study of Munich, Germany during the warm season. Sustainability 2015, 7, 4689–4706. [Google Scholar] [CrossRef]


| Factors | Rep Reported/Applied by | Definitions | Data Source | |
|---|---|---|---|---|
| Social factors | Overall population density | [19,32] | Total population divided by the total area in a given research site, including urban population and rural population, person/km2 | Shanghai statistical yearbook 2000, 2005, and 2010 |
| Urban population density | [19] | Urban population divided by the total area in a given research site, person/km2 | ||
| Economic factors | Gross domestic product (GDP) density | [19,32,33] | Gross domestic product divided by the total area in a given research site, million RMB/km2 | |
| Primary industry added value density | [19] | Primary industry added value divided by the total area in a given research site, thousand RMB/km2 | ||
| Secondary industry added value density | [19,34] | Secondary industry added value divided by the total area in a given research site, thousand RMB/km2 | ||
| Tertiary industry added value density | [19,34] | Tertiary industry added value divided by the total area in a given research site, thousand RMB/km2 | ||
| 2000 | 2005 | 2010 | |
|---|---|---|---|
| Max | 1892.66 | 3428.83 | 2820.63 |
| Min | 0 | 0 | 0 |
| Mean | 1.86 | 2.61 | 2.87 |
| S.D. | 9.98 | 18.42 | 15.33 |
| Moran’s I | 0.013 | 0.006 | 0.009 |
| Z score | 33.38 | 20.81 | 29.18 |
| p value | <0.01 | <0.01 | <0.01 |
| Edge | Infilling | Outlying | ||
|---|---|---|---|---|
| 2000–2005 | Max | 3187.18 | 236.20 | 92.48 |
| Min | 0 | 0 | 0 | |
| Mean | 7.97 | 7.88 | 5.89 | |
| S.D. | 44.21 | 13.13 | 7.19 | |
| Total Expansion | 48,912.80 | 15,784.16 | 6863.14 | |
| 2005–2010 | Max | 577.93 | 635.12 | 184.24 |
| Min | 0 | 0 | 0 | |
| Mean | 6.80 | 6.96 | 6.53 | |
| S.D. | 17.73 | 21.43 | 12.54 | |
| Total Expansion | 25,333.48 | 6967.35 | 4647.17 | |
| Population Density | Urban Population Density | GDP Density | Primary Industry Added Value Density | Secondary Industry Added Value Density | Tertiary Industry Added Value Density | Moran’s I Index | |
|---|---|---|---|---|---|---|---|
| 2000 | 0.941 ** | 0.867 ** | 0.765 * | 0.543 | 0.781 * | 0.755 * | 0.574 |
| 2005 | 0.982 ** | 0.979 ** | 0.944 ** | −0.773 * | 0.319 | 0.978 ** | 0.699 * |
| 2010 | 0.976 ** | 0.926 ** | 0.761 * | −0.582 | 0.734 * | 0.612 | 0.714 * |
© 2017 by the authors. Licensee MDPI, Basel, Switzerland. This article is an open access article distributed under the terms and conditions of the Creative Commons Attribution (CC BY) license (http://creativecommons.org/licenses/by/4.0/).
Share and Cite
Li, J.; Fang, W.; Wang, T.; Qureshi, S.; Alatalo, J.M.; Bai, Y. Correlations between Socioeconomic Drivers and Indicators of Urban Expansion: Evidence from the Heavily Urbanised Shanghai Metropolitan Area, China. Sustainability 2017, 9, 1199. https://0-doi-org.brum.beds.ac.uk/10.3390/su9071199
Li J, Fang W, Wang T, Qureshi S, Alatalo JM, Bai Y. Correlations between Socioeconomic Drivers and Indicators of Urban Expansion: Evidence from the Heavily Urbanised Shanghai Metropolitan Area, China. Sustainability. 2017; 9(7):1199. https://0-doi-org.brum.beds.ac.uk/10.3390/su9071199
Chicago/Turabian StyleLi, Jinghui, Wei Fang, Tao Wang, Salman Qureshi, Juha M. Alatalo, and Yang Bai. 2017. "Correlations between Socioeconomic Drivers and Indicators of Urban Expansion: Evidence from the Heavily Urbanised Shanghai Metropolitan Area, China" Sustainability 9, no. 7: 1199. https://0-doi-org.brum.beds.ac.uk/10.3390/su9071199