1. Introduction
The sustainable urban mobility plan (SUMP) is widely used as a tool by transport authorities and planners for the sustainable development of the urban area. The SUMP is used as a manual to promote the transfer to more sustainable transport modes and provide safe, clean, and environmentally friendly solutions [
1]. A policy proposed in the SUMPs method is the use of the Park and Ride (P&R) system to solve the negative consequences of private vehicles in cities. Using this system, private vehicle users can travel to a central business district (CBD), and have a portion of the trip made in a private vehicle, before parking the vehicle to transfer to public transportation to complete their journeys [
2,
3,
4]. Hence, the P&R system is seen as a transport mode that encourages an intermodal shift towards a more sustainable transport mode in the urban area [
5,
6]. Therefore, its location requires a detailed study to be carried out in order to be beneficial to the success of the system [
7].
The main factor to be studied in the P&R system is its location, and the concept is that the facility should be close to public transportation stations (e.g., Light Rail Line (LRT), subway, bus), which could lead to the P&R system having a facility at each station. Therefore, a set of criteria must be taken into account that further extends the concept mentioned above. In some cases, researchers and transport planners have designated the location based on the conception that the P&R system allows the reduction of trips to the CBD [
8], in other cases the P&R system is considered as a transport mode, and a criterion that has been included in some studies is the distance between the origin and the facility, as well as between the facility and the destination. Among the most known criteria is the costs to use and implement the P&R system [
9]. In recent research, environmental criteria have been included, which has established the P&R system as a tool that enables the reduction of vehicle emissions [
10]. As mentioned, it is also the point of connection to public transport; thus, an accessibility criterion needs to be evaluated. All of the previous criteria lead to a sophisticated analysis of the location of the P&R system facilities. In the case of emerging countries, a few studies regarding the P&R system in Ecuador and South American countries have been carried out. This study is the result of a project in which the authors are working regarding the study of the P&R system, where other publications have already been made [
11,
12]. Therefore, transport experts have begun to use multicriteria decision-making (MCDM) applications to solve problems and improve citizens’ quality through transport projects. According to the literature reviewed by the authors, no articles were found that have developed an analysis of park-and-ride facilities’ location by the fuzzy analytic hierarchy process (FAHP) model in an emergent country and included an elaborate set of criteria.
The study is composed as follows:
Section 2 provides the scientific information used to research the facilities’ location in the P&R system and MCDM methods.
Section 3 details the methodology developed in our study.
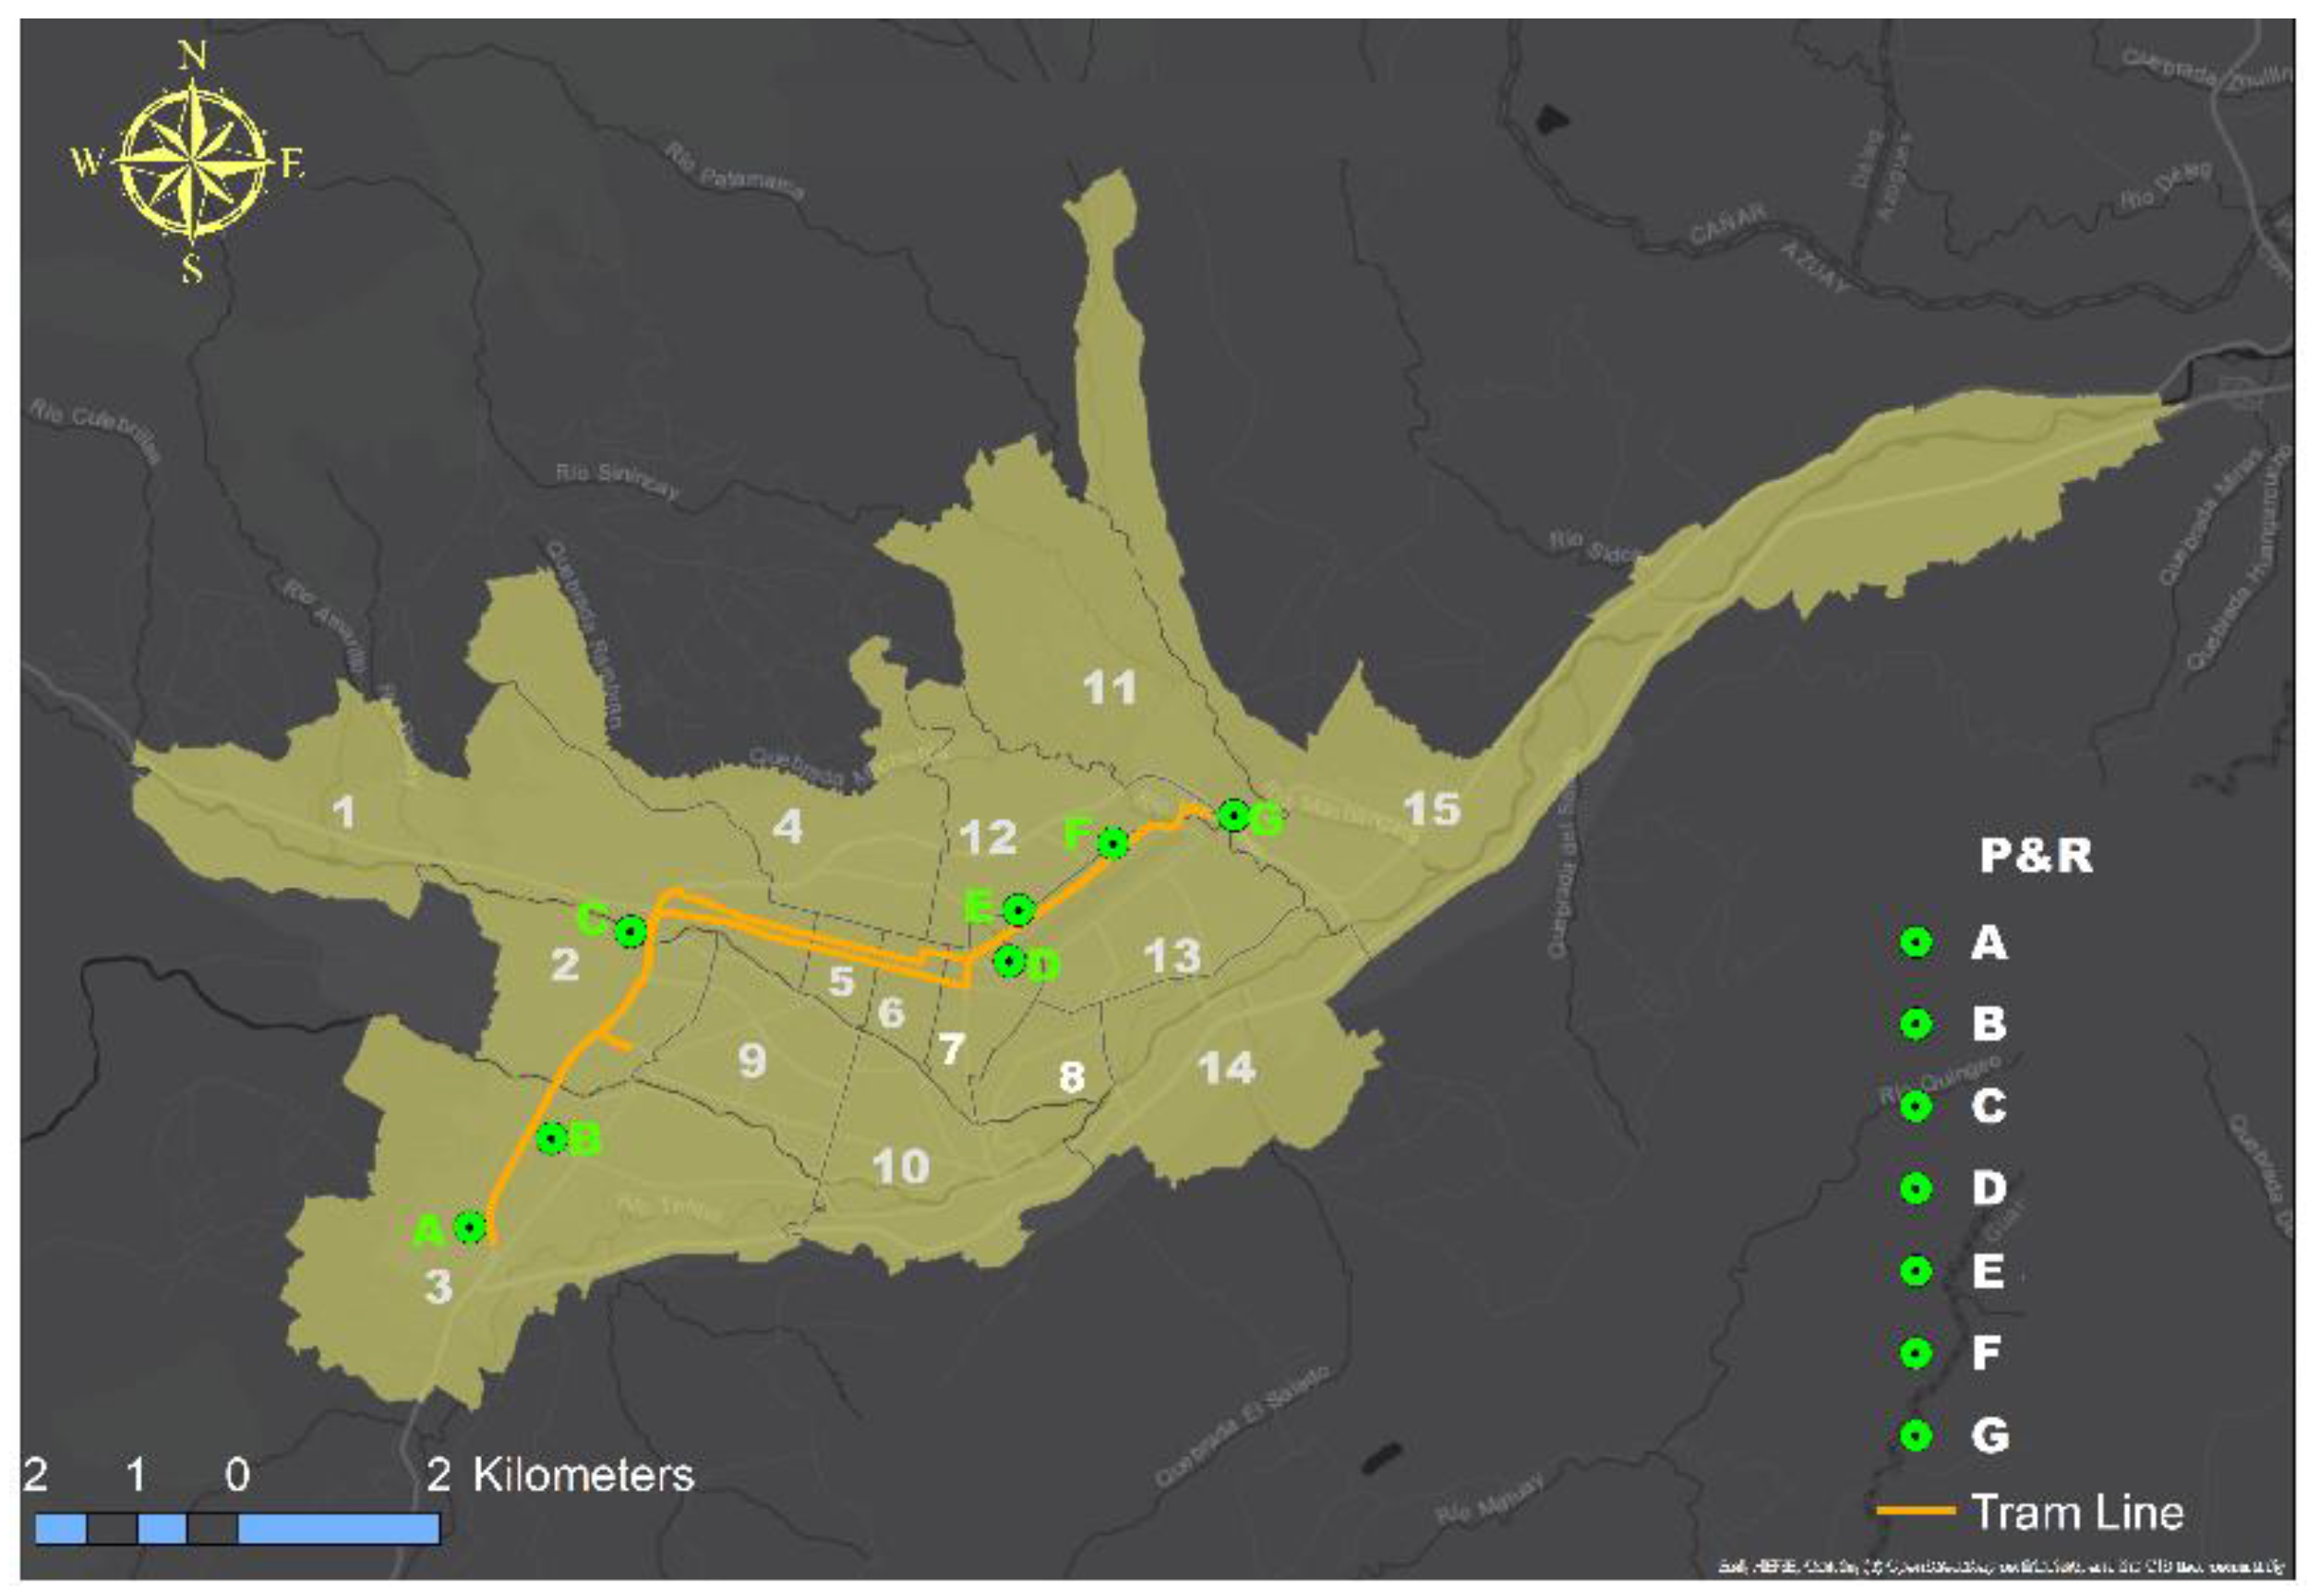
Section 4 describes our case study, Cuenca-Ecuador. In
Section 5, we apply the methodology that was designed for our case study.
Section 6 analyzes and discusses the results provided by applying our methodology. Finally, the contributions are presented in the conclusions section.
2. Literature Review
This section presents the main results of the research according to the P&R location and the descriptions of the multicriteria method regarding the particular AHP method that is used in the methodology section. A number of studies have included the two approaches mentioned above.
Traffic saturation and pollution in cities caused by private vehicles have become commonplace in modern times. In order to mitigate these problems, some studies have proposed transport alternatives (e.g., pedestrian, bicycle, public transport, P&R) [
13,
14,
15,
16,
17,
18,
19]. The alternative that has been poorly studied is the P&R system, in which one of the factors that requires comprehensive expertise is its location, which, through methods and methodologies, has allowed which parameters are considered to be determined. Regarding the analysis of the P&R location, several variables can be analyzed from different methods and methodologies. Transport planners tend to locate facilities close to public transport stations; however, according to this approach, a scenario arises where the number of facilities in the P&R system should be the same as the number of public transport stations. Therefore, we describe a set of variables that have been studied by researchers about the P&R system’s location. Song et al. [
20] suggested a model for the location of P&R system facilities, in which the capacity of each facility is estimated; this model is known as an integrated planning framework. In addition, in recent years, interesting research has been carried out to combine other transport modes with the P&R system, among which the most interesting ones are those that combine autonomous vehicles [
21]. Thus, Chen and Kim [
22] studied the possibility of establishing a model for the P&R system that combines the railway system, which is based on the promotion of the use of public transport through the establishment of an environmental restriction that combines traffic assignment and modal split. Using a geographic information system (GIS), each facility’s catchment area was determined, which is the potential demand [
23]. Du [
24] and Ni [
25] studied the potential to optimize existing P&R locations through an equilibrium multimodal choice that included three types of transport mode. Additionally, Cavadas and Antunes [
26,
27] extended the model of Aros-Veras et al. [
28] and Holguin Veras et al. [
29,
30] to develop a discrete choice model to study transport alternatives, such as P&R, private vehicles, and buses. Farhan and Murray [
31,
32] developed an optimization model to calculate the potential number of users of each P&R facility, taking into account the following aspects: Covering as many users as possible, incorporating new P&R facilities, and establishing P&R facilities near public transport stations.
In order to analyze most of the variables mentioned about the location of facilities in the P&R system, multicriteria decision-making models (MCDMs) are studied. These models have provided the creation of solutions to various problems in the area of transport, and even the models developed have solved a large number of problems concerning transport planning in the city’s urban area. This model has started to be studied in detail by researchers around the world by linking the mobility components with the MCDM models [
33,
34,
35,
36]. A relevant multicriteria model is the so-called AHP method, based on the estimation and knowledge of decision-makers who, based on specific criteria, can make appropriate decisions regarding the resolution of a complex problem. In fact, it helps decision-makers find the solution that best addresses their requirements and judgment of the problem. The AHP method is subjective and is considered an assessment of expert knowledge; thus, it is unnecessary to involve a large sample in the analysis [
37]. However, the AHP method has certain limitations, such as the decision criteria that the defendant has since the answer can be considered at a certain level as an argument related to a personal statement. The AHP method is a little imprecise because the criterion of perception, evaluation, correction, and choice is based on the decision-makers’ preference, which has a significant influence on the results. In addition, dependencies between AHP variables often lead to some inconsistency in the weighting of criteria and create results contrary to reality [
38]. Duleba and Moslem [
39] examined the Pareto optimization of AHP weight vectors. Thus, the pairwise comparison matrices were used in a real case study; the authors achieved a modification of the weight of AHP vectors. The authors demonstrated through the results that their study of the AHP method could be optimized by adding it to the use of the analytic network process (ANP) modeling and simulation-based sensitivity evaluation [
40,
41]. The benefit of the model applied in addition to AHP varies according to the scenario used for this method and the type of study that it is most appropriate for. Thus, several mathematical and optimization methods have been employed in order to be able to analyze and improve the AHP results in terms of the precision of the outcome. Statistical considerations of the sensitivity analysis and innovation have been integrated into the AHP method using Monte Carlo Simulation [
42,
43]. Meena et al. [
44] employed the well-known frequency ratio (FR) together with the AHP method, with the result being a hybrid spatial multicriteria assessment (SMCE) model, and obtained more accurate results in the multicriteria models. Both the SMCE and the FR require a set of data in the form of an inventory to prepare the model, and this is the major factor for achieving more precise results from the corresponding integrated model. However, such a set of inventory data is often not available for many of the decision-making problems. In another integration model, Ha et al. [
45] used the AHP method to integrate it with fuzzy- Technique for Order of Preference by Similarity to Ideal Solution (TOPSIS ) to prioritize the performance of their methodology. Fuzzy theory is included in most of the instruments available in the MCDM since it is possible to interpret imprecise measurements within the mathematical operators for decision-making in the fuzzy domain. The fuzzy theory has been combined with AHP to develop several studies from its results [
46,
47,
48,
49]. The ANP is the advanced version that is most suited to complex decision problems.
The ANP is also combined with fuzzy theory in order to minimize possible errors and uncertainty inherent in the decision-making system [
50,
51,
52], which is a more realistic approach given that several experts, who have very varied preferences and interests, are involved [
53]. Few investigations have combined the MCDM methods and P&R system to explore the criteria concerning their location; for instance, Szymon Fierek et al. [
54] developed research that uses multiple criteria to evaluate the location of P&R lots. The authors considered a case study of a city where 15 P&R facilities were planned and then used the VISUM simulation tool to model the locations. The result is that the final ranking was obtained. In the same research line, an interesting investigation was developed that includes aspects, such as economic, social, urban, and environmental, to determine the location of the facilities. The authors used evaluation based on the distance from average solution (EDAS) in order to determine the decision regarding the location of a park-and-ride (P&R) facility [
55].
Based on the literature review concerning the P&R location and MCDM, a research gap can be clearly indicated on the topic proposed in this article. In particular, there is a lack of evidence concerning the use of advanced models of MCDM in the planning of facilities for the P&R system. This document aimed to introduce a combined model to support consensus decisions on P&R system facilities’ location. The current study is part of a research project called, “An Integrated study of Park-and-Ride Facilities for Sustainable Urban Mobility,” where a number of scientific publications have been published.
3. Methodology
This section describes in detail how our methodology is being developed and then applied to our case study. The AHP is a well-proven decision-making methodology, which was developed by Saaty [
56] to simplify complex decision problems. AHP is based on an additive weighting process, in which various relevant criteria are represented through their relative importance. The AHP approach was widely used by academics and professionals in many fields and problems, mainly in engineering fields like transport engineering field [
39,
57,
58,
59,
60] in the construction engineering field [
61], in architecture [
62,
63], and many different engineering fields. However, AHP has some restrictions, and to overcome these limitations, many researchers integrate fuzzy theories with AHP for providing more reliable and robust results [
47,
64,
65]. Vinogradova et al. [
66] adopted the AHP approach in a fuzzy environment to obtain the weight of criteria related to distant courses taught for students.
FAHP was conducted in this study to prioritize and classify the criteria for the location of facilities in the P&R system in the city of Cuenca city, Ecuador. Consequently, the scale of fuzzy numbers and their linguistic scale were utilized for estimating the pairwise comparisons (PCs).
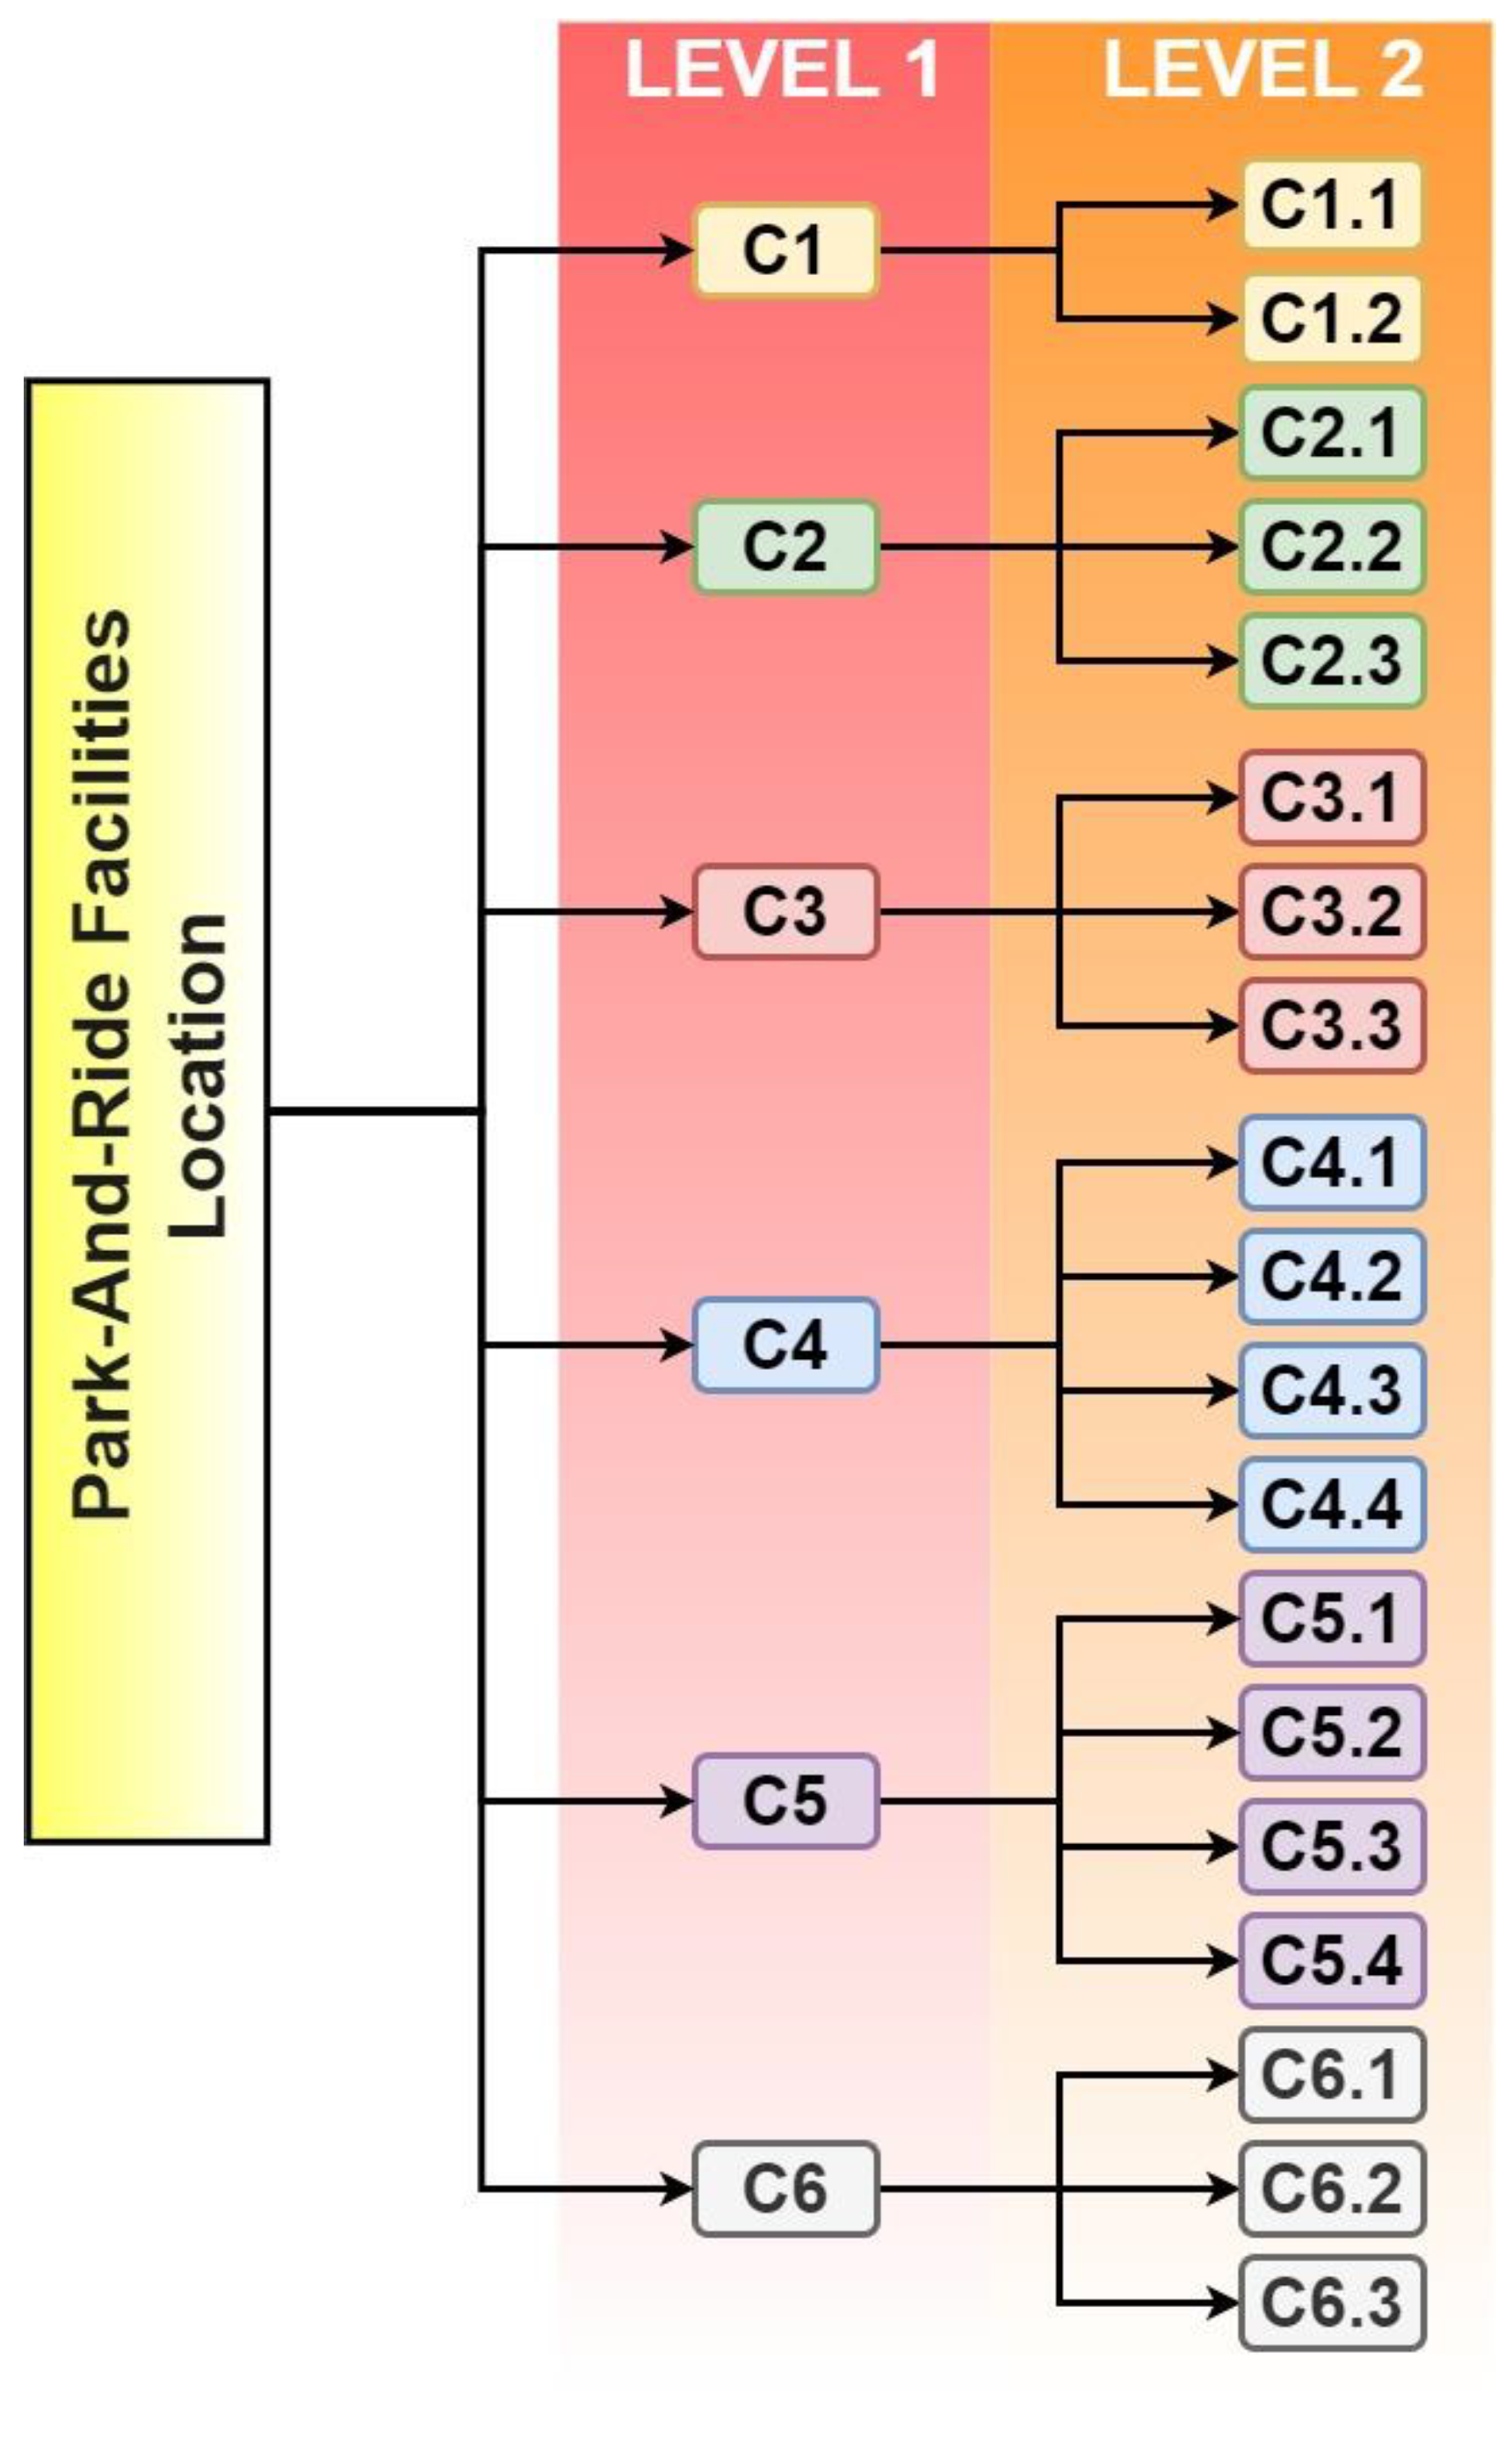
The hierarchy structure for the P&R system for Cuenca city was constructed based on experts’ opinions and the literature. The structure contains 6 main criteria in the first level and 19 sub-criteria in the second level.
The geometric mean approach was used to aggregate the evaluators’ responses, and the final scores were calculated and prioritized. In order to ensure the quality and authenticity of the data collected, consistency tests were carried out. The mathematic notion for the FAHP evaluation was adopted from [
67]. The author conducted a fuzzy logic technique by developing a questionnaire survey with triangular fuzzy number scales. The following formulas are merely applications in our research for the newly created integrative decision model. We introduce the formulas in detail in order to give insight into the computational process.
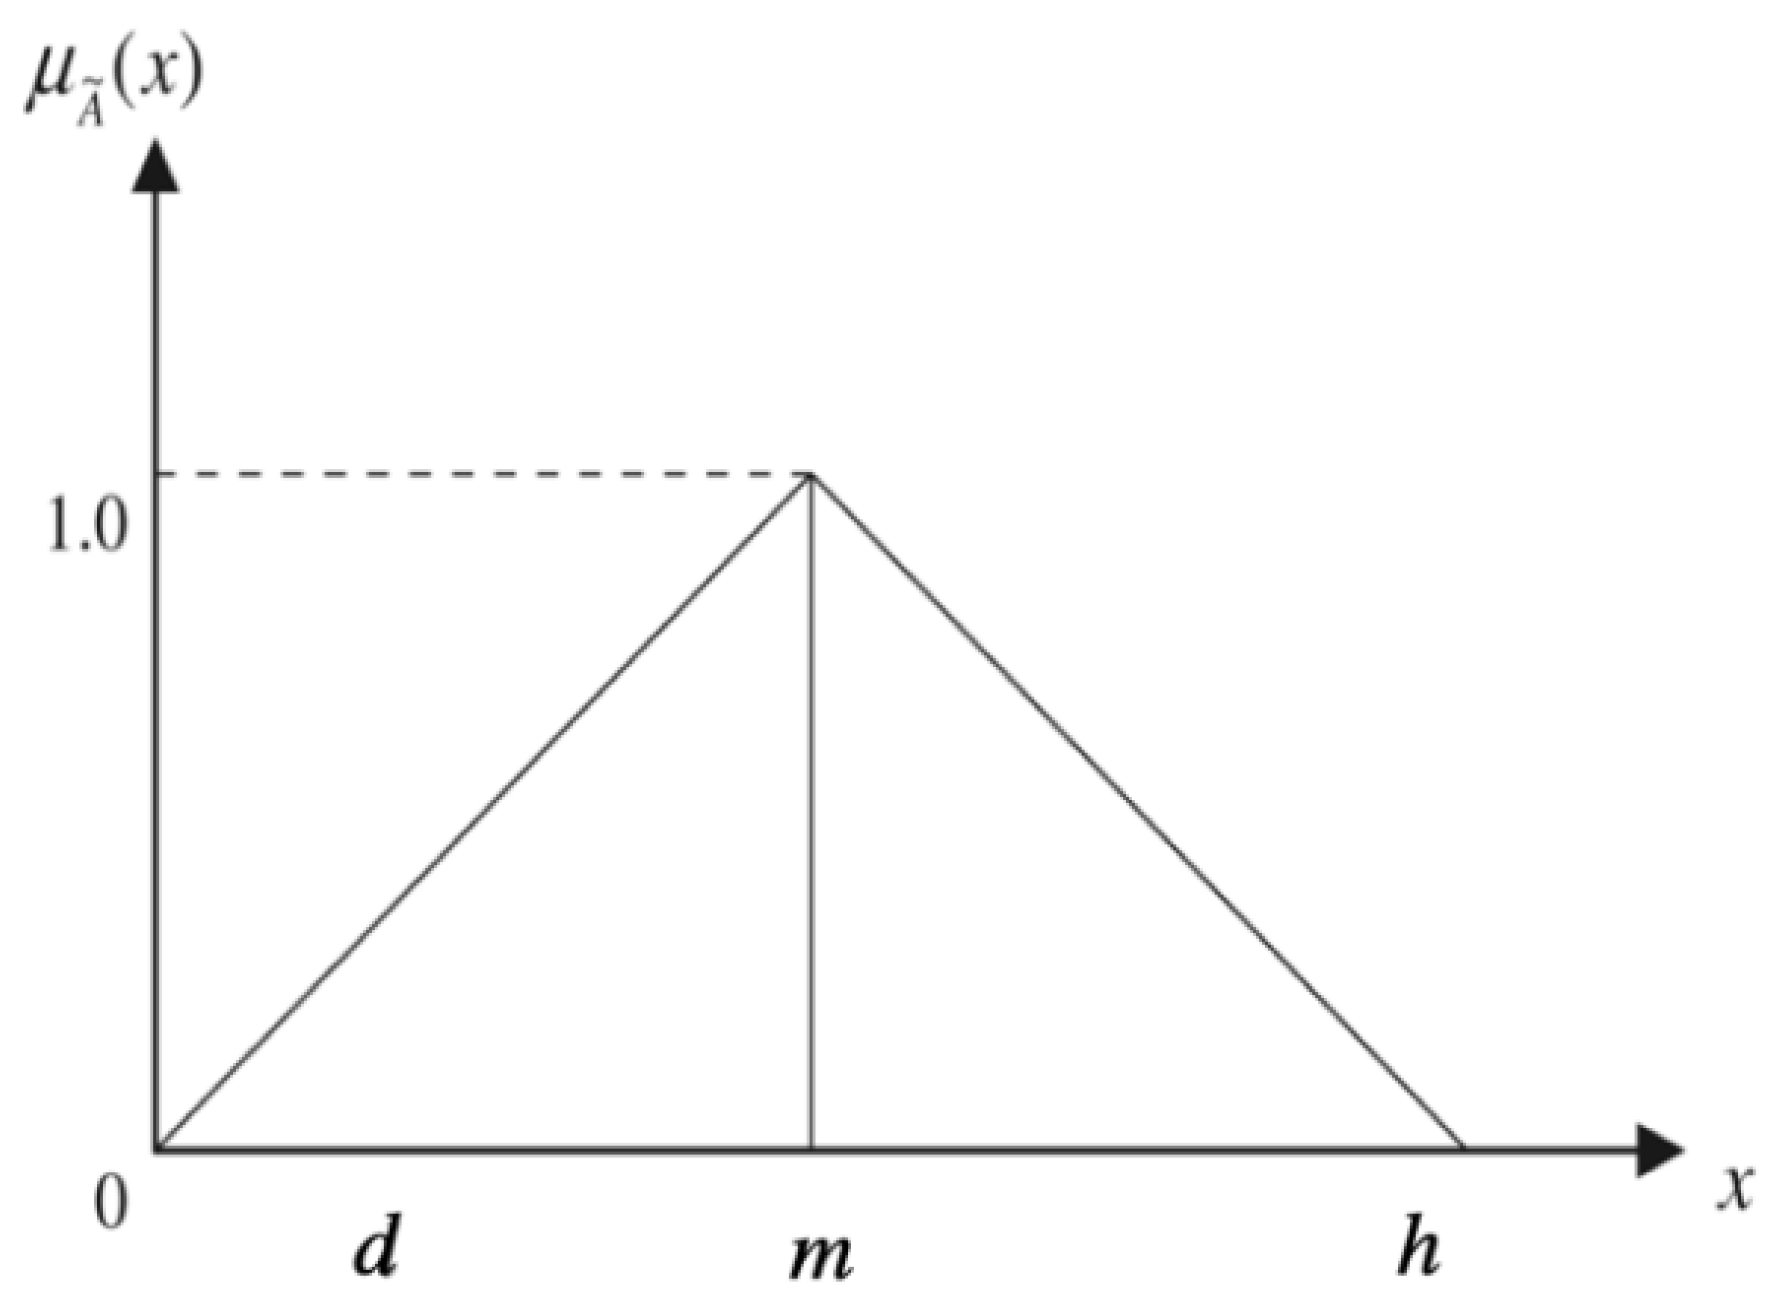
A fuzzy number
on
is a triangular fuzzy number if its membership function
is equal to the consequential Formula (1):
From Equation (1),
and
are the inferior and superior bounds of the fuzzy number
, and
is the modal value for
(see
Figure 1). The triangular fuzzy number can be exhibited by
.
The operational laws of the triangular fuzzy number and are blazon as consecutive formulas as the addition (2), multiplication (4), division (5), and reciprocal (6) of the fuzzy numbers. In our computational procedure, all formulas were applied.
The following equation shows the addition of the fuzzy number
:
The following equation shows the multiplication of the fuzzy number
:
The following equation shows the division of the fuzzy number
:
The following equation shows the reciprocal of the fuzzy number:
In the incumbent research, the computational technique was based on the sequent fuzzy numbers that are defined in
Table 1 [
67,
68].
The employed PC matrices were constructed based on the hierarchical structure of criteria, as shown in figure on page 9. Linguistic terms were assigned to the PCs by asking which criteria are more treasured than the other with respect to the main goal. As
is the biggest matrix (5
5) in the second level as an example in (6), we demonstrate the fuzzification of the scale values for this case:
where:
To accumulate the fuzzy weights for each rater group, the fuzzy geometric mean technique was implemented [
69]:
where
is the fuzzy comparison value of dimension
to criterion
j, thus
is a geometric mean technique of the fuzzy comparison value of criterion
to each criterion, and
is the fuzzy weight of the
-th criterion, which is illustrated by a triangular fuzzy number,
. The
emblematize the upper, middle, and lower values of the fuzzy weight of the
-th dimension.
The consistency ratio (CR) for all pairwise comparison matrices was smaller than 0.1, which is acceptable to complete the FAHP analysis, as Saaty suggested [
56]. The final scores of the proper eigenvectors provide the opportunity to set up a rank order of preferences for the experts of urban transport planning on the system’s issues, by analyzing the weights of the previous levels by using the following equation:
where
j = 1, …, m and
;
> 0 (
j = 1, …, m) describes the associated weight coordinate from the previous level;
> 0 (
i = 1, …,
n) is the eigenvector computed from the matrix in the present level; and
(
i = 1, …,
n) is the calculated weight score of the present level’s elements.
Where:
(j = 1, …, m) is the normalized weight of the first level in our case; and
(i = 1, …, n) is the normalized eigenvector-coordinate of the current level.
5. Results
In the research, meetings and discussions were held in order to develop a model that may acquire the criteria of the P&R locations in a simple manner.
Figure 3 and
Table 2 below exhibits the model. Consequently, the questionnaire survey was conducted in May 2020. The sample of the participants was indiscriminately hand-picked from the park-and-ride planners (experts in the transportation field at the university and municipality) as four women with different age layers who participated in the survey, and six men participated as well. The filling time of the survey was 25 to 30 min per expert. Altogether, 25 elements of the park and ride (as depicted in
Table 2) were assessed to examine the elements of the experts’ preferences and attitudes towards P&R facilities.
Further, the P&R location criteria were structured into a hierarchy, on the one hand, due to the better overview of the researchers and participants, and, on the other hand, because of the requirements of the applied FAHP. The hierarchical structure of the criteria determines the survey process, in which PCs are required from the expert evaluators among the criteria situated in the same branch of the decision criteria tree. Participants have to compare, in a pairwise manner, the criteria of the P&R facilities as all possible pairs (
Figure 3).
The typical comparison question is: Compare the relative importance between the “distance-C1” and the “traffic conditions on the route (origin-destination)-C2”, with respect to park and ride facilities.
Having gained all scores from the evaluators, following the fuzzy AHP methodology, fuzzy PCs have to be created for all branches of the decision structure, as demonstrated below (
Table 3,
Table 4,
Table 5,
Table 6,
Table 7,
Table 8 and
Table 9), where the results are aggregated for all evaluators. As shown in the tables below, the fuzzy weight scores of all criteria in all levels express three different scenarios as minimum, medium, and maximum values. A score below 1 indicates real evaluations between zero (expressing a neutral relation between the two decision criteria) and 1, which means a slight superiority of one criterion over another and so forth.
Afterward, the final scores were computed by conducting the eigenvector method of the AHP technique. Deriving eigenvector scores and then computing the weight scores enabled us to determine the importance of each element in the decision structure in the decision, in our case, in the location of the facilities of the P&R system of the respondents. The higher score means the higher importance attached to each element. The order of scores implies a ranking of importance, which is significant support of the P&R location for transport planners. The priority order of different criteria in park-and-ride facilities in terms of their development is presented in
Table 9 and
Table 10.
6. Discussion
The survey conducted on transport planners that work in the municipality and local universities about the location of the facilities in the P&R system allowed evaluating fundamentally what the planners take into account when locating a facility. Using this evaluation, it is possible to determine which criteria they consider most relevant, as well as that the planners agree with the goal of the P&R when it is applied in an urban environment.
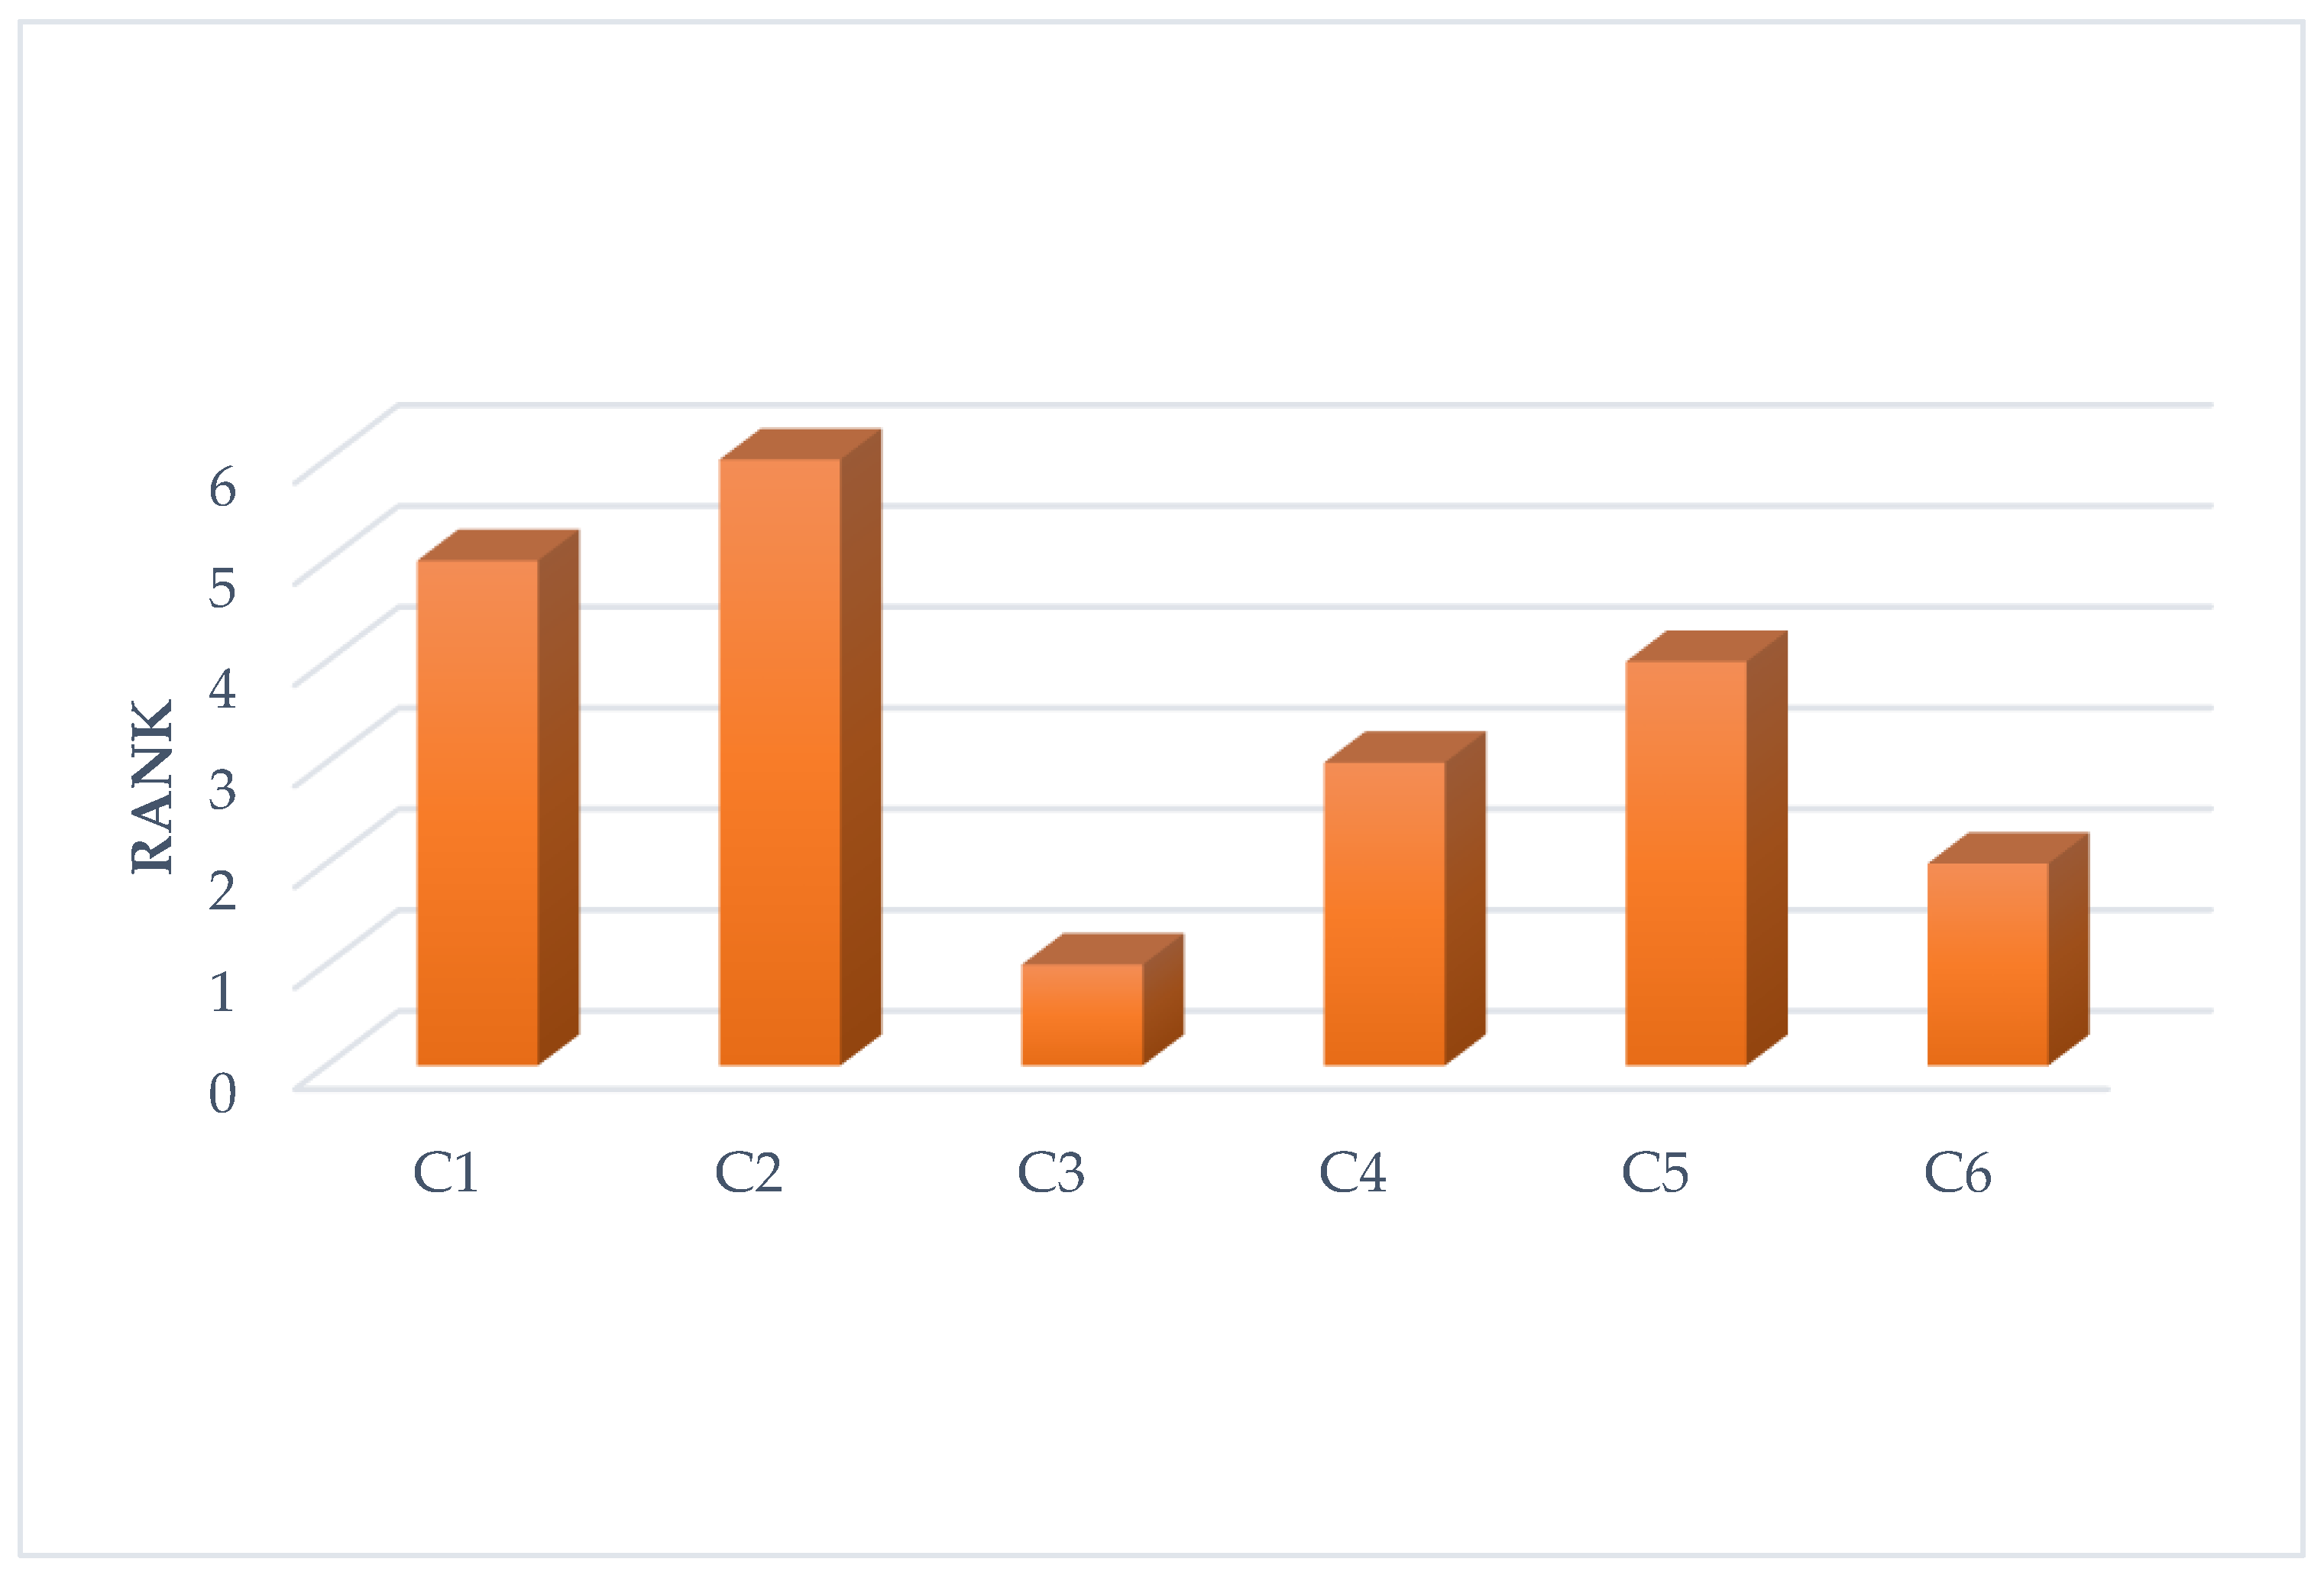
According to the criteria chosen by the transport planners regarding the location of the P&R system’s facilities, the following criterion classification order is presented. The most important element for the location of P&R facilities is C3 “accessibility of public transport” (see
Figure 4), which is interpreted by the planners as a top-ranking criterion since the P&R system in its location concept requires to be located close to public transport stations and therefore its accessibility is already guaranteed. However, the new idea arises to encourage the modal shift from private to public transport in medium-sized Latin American cities in which the P&R system has not been sufficiently promoted as a modal shift location; this criterion must be extended by the planners, making it more relevant to cities that have initiated or wish to implement the P&R system in Cuenca. A less critical criterion for planners is C6 “environmental”, as it is considered that its location could diminish the undesirable effects caused by a private vehicle. However, based on recent research [
76], it is a fact that P&R can reduce such undesirable effects and should be included in environmental policies in mobility plans, which includes reducing pollution. Subsequently, C4 refers to some aspects of transport, in general to categorize the P&R system as a transport mode more related to demand, its capacity, and the interaction with other transport modes, such as public transport. For instance, the number of transport lines connected to the P&R system, which is defined as the accessibility. The C5 “economic” is a mid-range consideration for planners throughout to develop a project not only concerning the P&R system. Its importance is related to the costs of the project and is easily explained because the transportation planners consider the viability of a project in terms of its costs; thus, the location depends highly on the budget, mainly because local authorities develop these projects. Continuing with the lower-rank criterion is the C2 “traffic conditions on the route (origin-destination)”, since, as has been widely mentioned, the main objective of the P&R system is to reduce private vehicle trips to the CBD or in the urban environment of a city. We mentioned that it is the traffic on the P&R route (percentage of trips by private vehicles and a percentage of trips by public transport). This means that transportation planners do not consider the traffic on the P&R route as a problem that affects the location of the facilities. The traffic is not essential in the second part of the trip because the users of the P&R system could use direct or exclusive public transport lines to the CBD. In our case, this is an LRT system that does not circulate along with the city traffic, thus allowing the users of private vehicles to choose the use of a P&R system to arrive at their destination and not to deal with the traffic conditions. The distance C1 is a criterion that transportation planners consider more important than the previous criterion because the distance makes the planned transportation line longer if the P&R system is situated more distant from the CBD.
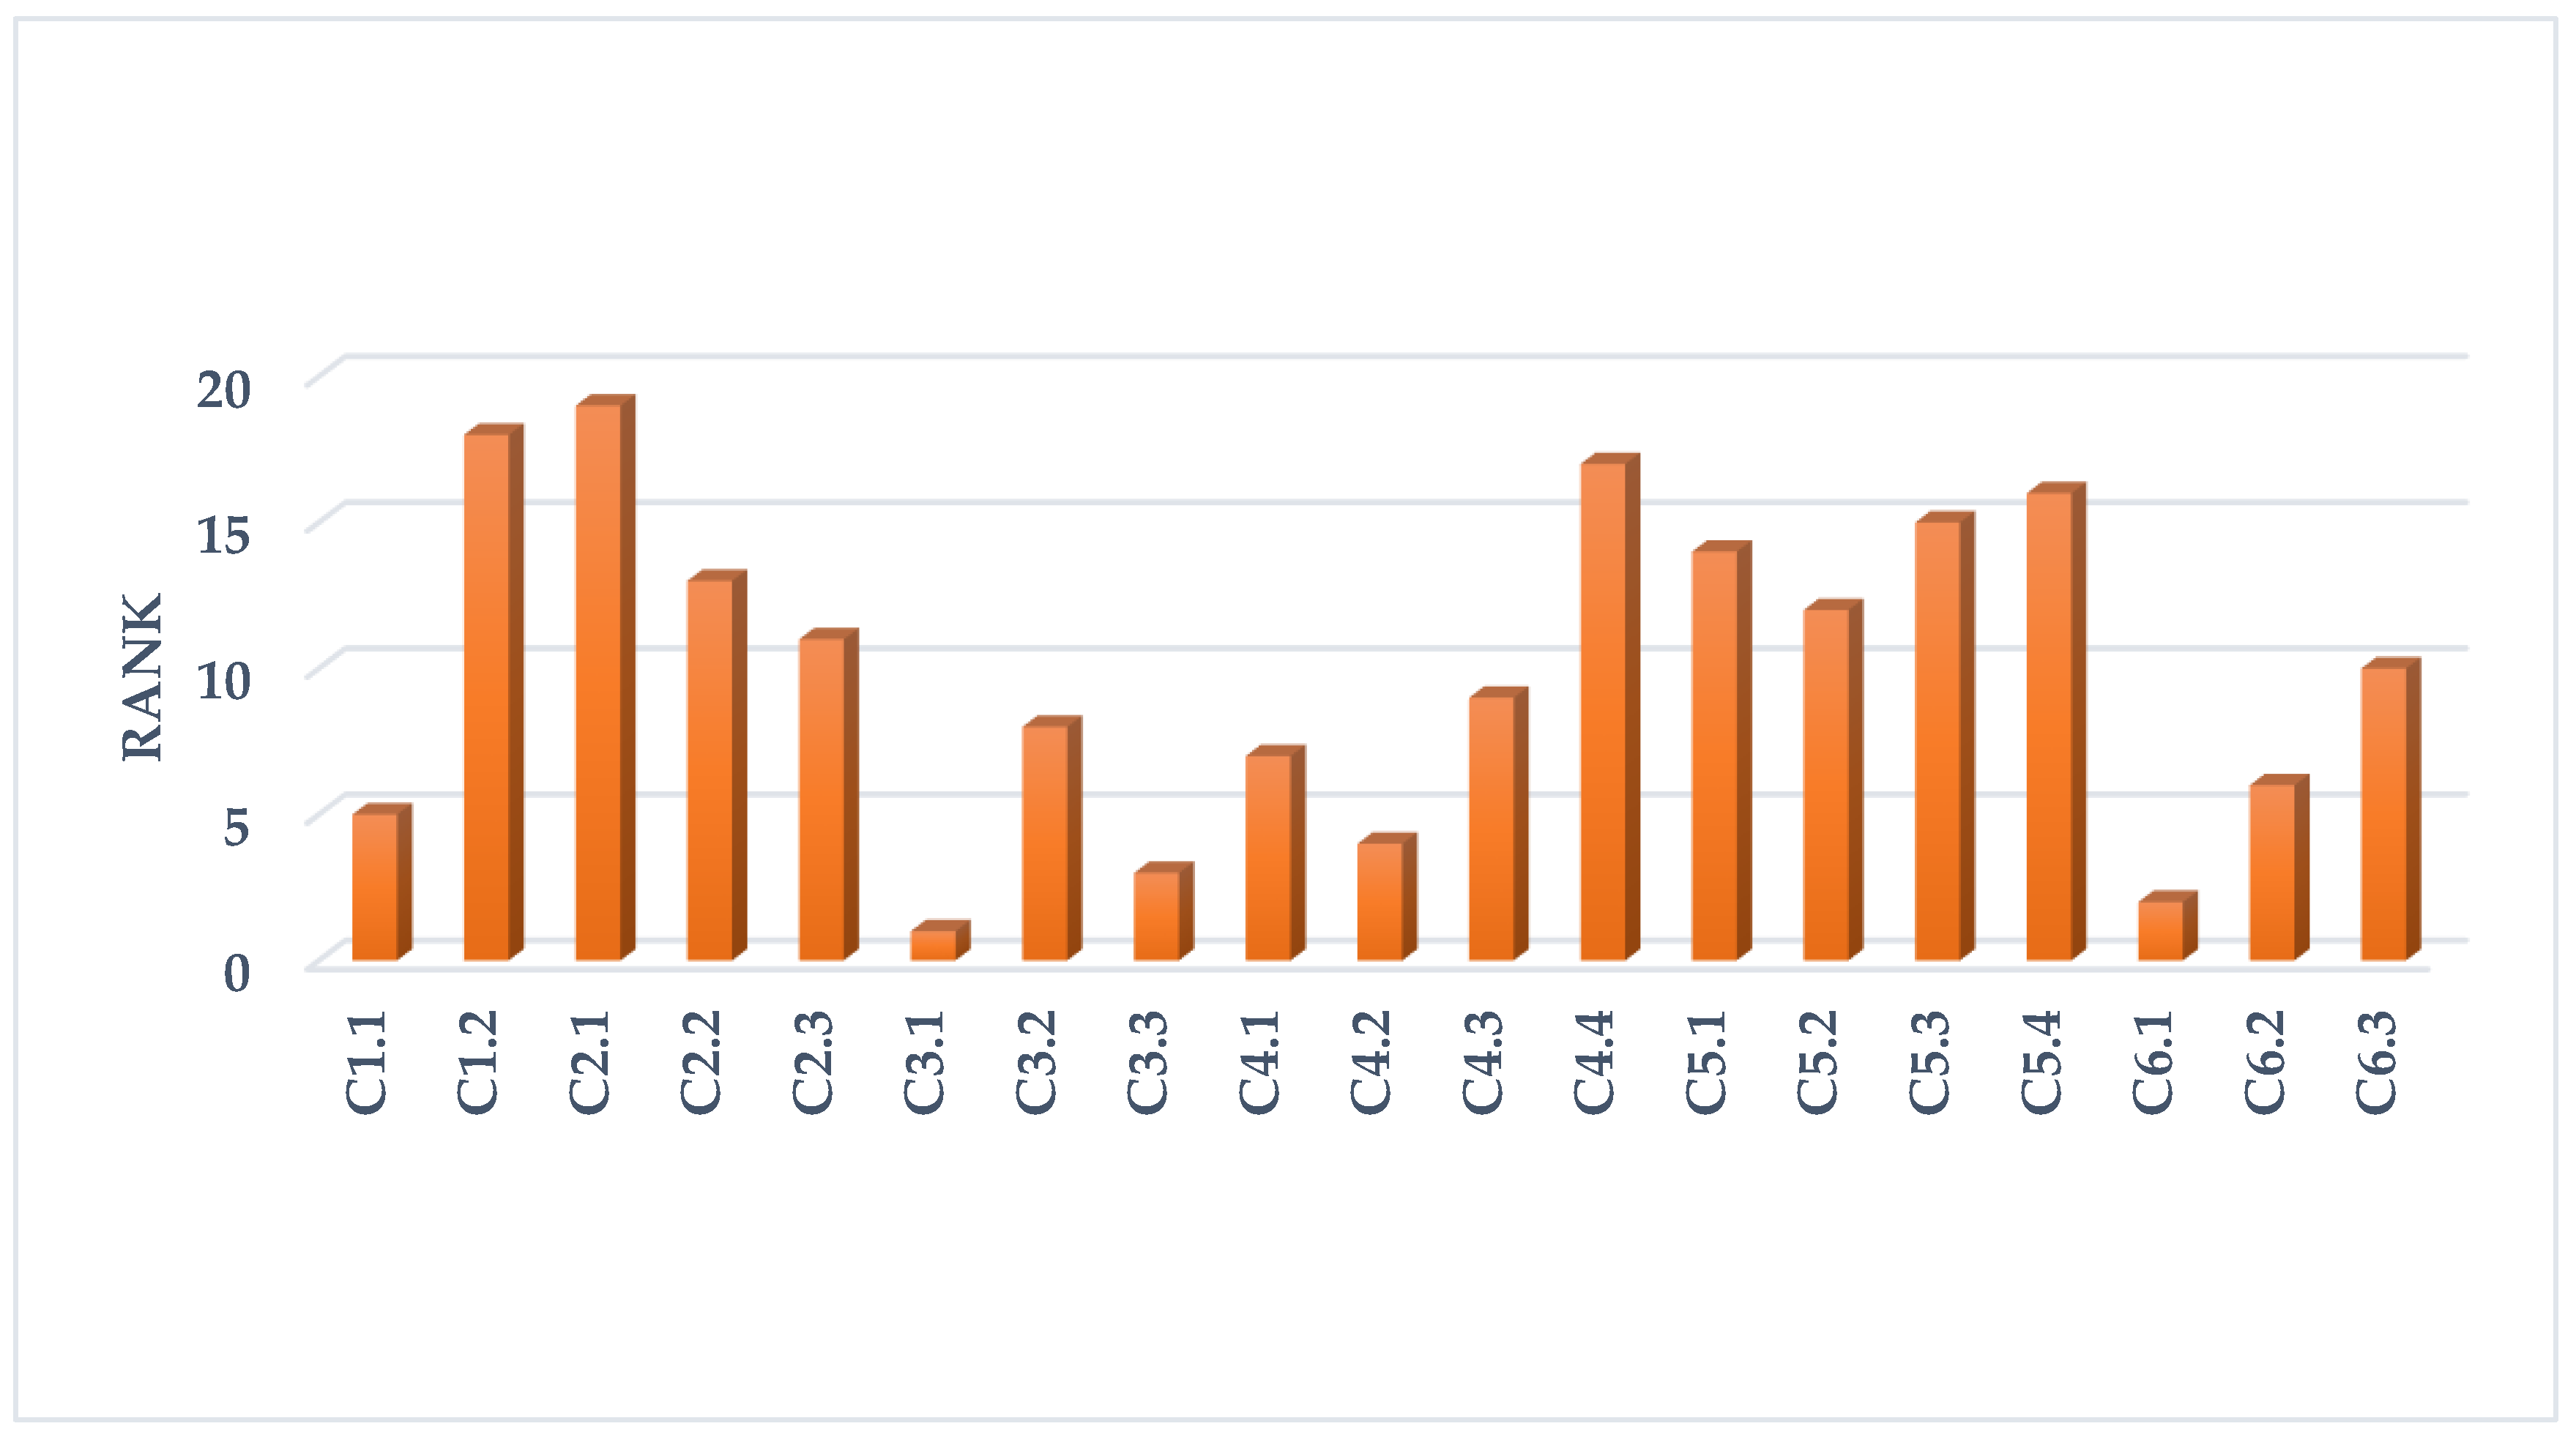
In order to give a more precise explanation of level two and according to the high number of sub-criteria established, a classification of importance was made: Most important, mid-level important, and low-level important, e.g., most important <6, mid-level important 6–12, >12 low-level important. Each principal criterion is described with its sub-criteria in order of classification, and a second part describes all the sub-criteria and their interaction with each other.
For example, the distance criterion C1 and its sub-criteria C1.1 is ranked 5, and C1.2 is ranked 18. This means that for transport planners, the distance traveled by private vehicles is more important than the distance of the second part of the journey, which is by public transport. It is because a potential user who has made most of his/her trip in a private vehicle hardly uses the P&R system to complete his/her trip. Therefore, location becomes crucial to make the journey through a P&R system. According to criterion C2, there is the following order of importance of the sub-criteria chosen by the transport planners: C2.3, C2.2, and C1.1. The reason is that the traffic or total time when using the P&R system is the most relevant because the success of any transport system depends on the traffic conditions or the time that it takes to complete the trip. The criterion C3 and its sub-criteria in order of importance are C3.1, C3.3, and C3.2. Within this main criterion, two of its sub-criteria are relevant for the location of the facilities of a P&R system. For example, the frequency of the public transport system ensures the success of the P&R system. This is particularly important because transport planners determine that the P&R system is strongly linked to public transport. The success or decline of the system depends on the service coverage for the second part of the journey. Distance and travel time are also relevant factors, and the concept of P&R ensures that the P&R system facilities are located close to public transport stations. Criterion C4 and its sub-criteria are classified as follows in order of importance: C4.2, C4.1, C4.3, and C4.4. In other words, the demand produced by the P&R system is covered by a larger number of transport routes.
Consequently, the demand produced by the P&R system is covered by a larger number of transport routes. Besides, the demand for both the public transport system and the P&R system are aspects that must be considered when locating the P&R system facilities. Criterion C5 and its sub-criteria in the range of importance: C5.2, C5.1, C5.3, and C5.4, and the difference between them is not substantial. Transport planners consider the technical criteria related to the P&R system to be more significant than those associated with the cost sub-criteria. The environmental criterion C6 in the order of importance in the sub-criteria is as follows: C6.1, C6.2, and C6.3, since the P&R system has been identified as a tool that allows the reduction of CO2 as a result of the reduction of undesirable trips to the city center caused by the use of private vehicles. However, concerning noise reduction, it is not considered relevant, because currently there is no strong evidence of noise reduction when a P&R system is implemented, and concerning criterion C6.3, using the assumption that green areas can be reduced by implementing the P&R system; although, the P&R system can be developed in combination with green spaces.
For level 2, the most relevant criterion to be taken into account is C3.1, which refers to the frequency of public transport that could be optimized, since this would promote the shift from the private vehicle to public transport. Besides, the use of intelligent transport systems (ITSs) that allow the coordination of the connection between the P&R system and the public transport system implies an improvement in the operation of the system (see
Figure 5). The following criterion, C6.1, as discussed in detail, helps explain the implementation of a P&R system, as it could reduce pollution. Cuenca is considered to be a city that generates a high level of pollution in CBD from private vehicles, and planners consider the P&R system as a tool to reduce pollution. The next criterion is C3.3, which represents what planners already know, in which the location of facilities in a P&R system is close to public transport stations. In addition, the criteria that planners stipulate as relevant when considering the location of the P&R system facilities are the set of criteria C4.2, C1.1, and C6.2, which are criteria based on the traditional P&R system approach, which are relevant to the operation or implementation of the P&R system. At least in Latin American cities, the P&R system is relatively new; therefore, the shift from private to public transport and the distance from urban areas (origin) to the facility system (P&R) has not been extensively studied. Addressing these criteria to cities where the P&R system has already been applied would help us understand the difference between transport planners’ priorities in Latin America and European transport planners. Subsequently, among the 19 sub-criteria, we describe those that planners consider moderate in importance. Thus, the reduction of travel to the CBD represented by criterion C4.1 is for transport planners, which they hope to achieve through various initiatives, such as bicycles. However, the alternative to implement a P&R system is very useful for those who use private vehicles. In Latin American cities, little scientific evidence has been carried out on the P&R system as a mode of transport to reduce the percentage of trips to the CBD. It is essential to determine that percentage; thus, the planners could modify the location of the P&R system facilities to establish which facility reduces most private vehicle trips. Additionally, it is possible to stipulate a set of criteria, C4.3, C6.3, C2.3, and C5.2, as medium importance that involves public transport aspects. These criteria have led to the determination that the P&R system is studied or known as a system that is part of the transport system and not a system that operates separately. However, the criterion that certainly increases in bigger cities is C2.3, since it allows the P&R system to be considered as a transport system, as an alternative to a more friendly transport mode. It has been possible to determine a set of criteria considered to be of lower importance, which is the costs of implementation since as it depends on the facility’s location, the cost varies. Therefore, criterion C5.2 is identified as the costs represented by land-use when implementing the P&R system. However, it is important to note that criterion C2.2, which is the time that public transport takes from the P&R to the CBD, is important for the operation of the system. C5.3 and C5.4 provides a useful approach when transport planners are focused on carrying out a study to implement the P&R system in a Latin American city. C4.4 is one of the criteria that planners consider to be a technical aspect of any transport system, and it is the demand on the system; the demand is directly related to the facility’s location. Besides, criterion C1.2 is one of the less important with C2.1. Both describe the operation of a P&R system in the first part of the trip made in a private vehicle, and the planners consider the second part of the journey, which is through public transport, as more relevant. In our case, it is by LRT.
A sensitivity test was applied to all levels. In fact, the scores for the other criteria were adjusted to maintain a value of one for the total weight scores. In the sensitivity analysis, the ranking level was maintained, and the change in ranking was studied according to the ability of the planners to select a criterion. This means that planners select location criteria based on their experience in implementing a P&R system.
The Cuenca municipality has developed several transport projects, including the implementation of a new transport system, the LRT, which is the most ambitious system presented by the city and is considered a symbolic project. In addition, a mobility plan was developed that considers the parking system in the city.
Our study goes further by considering the P&R system and which criteria are relevant for medium-sized city planners when they implement the P&R system. Using the P&R system, this scientifically proven system reduces trips to the city center and provides incentives for private transport users to switch to more friendly transport modes, such as public transport. One of the most important considerations or criteria is the accessibility of public transport. However, moving to a more critical point from a technical point of view, we can state that it is also necessary to update and inform the authorities of P&R’s purpose, which becomes a fundamental tool within transport planning. This system is relatively new in Latin America. It would be beneficial to apply this same criterion to researchers and local authorities that have already developed the P&R system and to make a comparison between Latin American and European cities.
7. Conclusions
This document aimed to introduce a new approach to determining the criteria of transport planners when establishing a set of P&R system facilities through a multicriteria decision model (MCDM) that integrates the attributes related to the P&R system. Since the current study integrated attributes, such as environment and traffic, the usual AHP methodology was selected. The application of the verified model allowed valuable information to be acquired through a survey and then the AHP method was applied, aimed at transport planning specialists, to find out which parameters are taken into account for location.
The results proved to be realistic, reflecting decisions that are taken into consideration by mathematical studies about the variables considered for the location of the P&R system, such as the cost of implementing a transport project, and the accessibility of public transport. This approach also showed that the P&R system is relatively new in certain Latin American cities and that certain technical aspects taken into consideration as part of the scientific evidence of the P&R system to reduce traffic are secondary. For example, a new approach would be to apply this system to cities that have already had a P&R system for several years, so that these criteria can be seen to vary.
The presented model can be suitable for the study of different transport problems in cities of any magnitude. However, it should be noted that, given various PCs, the survey process is considerably demanding and needs a considerable amount of time and effort on the part of the evaluators; thus, collecting the responses of several interviewed transport planners could be problematic. This is a limitation of the current model, and therefore, for a larger sample size, an alternative may be more convenient than the AHP method.
Furthermore, there are more new types of AHP models listed in the literature, for instance, those called fuzzy models and models combined with other MCDM techniques (e.g., TOPSIS, machine learning, ELECTREE). Besides, in the future, the combination of this model with another large group of models, for example, the optimization, geographical, and mathematical models, for the location of P&R system facilities could lead to a much more efficient study of the criteria that transport planners take as a priority for the location of facilities of the P&R system.


