Energy Conservation with Open Source Ad Blockers


1
Department of Electrical & Computer Engineering and Department of Materials Science & Engineering, Michigan Technological University, Houghton, MI 49931, USA
2
Department of Electronics and Nanoengineering, School of Electrical Engineering, Aalto University, FI-00076 Espoo, Finland
Technologies 2020, 8(2), 18; https://0-doi-org.brum.beds.ac.uk/10.3390/technologies8020018
Submission received: 5 March 2020
/
Revised: 27 March 2020
/
Accepted: 28 March 2020
/
Published: 30 March 2020
(This article belongs to the Section Information and Communication Technologies)
Abstract
:Internet-related electricity consumption is rising rapidly as global Internet users spend more than 6.5 h per day online. Open source ad blockers have the potential to reduce the time and thus electricity spent using computers by eliminating ads during Internet browsing and video streaming. In this study, three open source ad blockers are tested against a no-ad blocker control. Page load time is recorded for browsing a representative selection of the globally most-accessed websites, and the time spent watching ads on videos is quantified for both trending and non-trending content. The results show that page load time dropped 11% with AdBlock+, 22.2% with Privacy Badger, and 28.5% with uBlock Origin. Thus, uBlock Origin has the potential to save the average global Internet user more than 100 h annually. The energy conserved if everyone in the United States used the open source ad blocker would save over 36 Americans lives per year if it were to offset coal-fired electricity generated-based pollution. In the United States, if all Internet users enabled Privacy Badger on their computers, Americans would save more than $91 million annually. Globally, uBlock Origin could save consumers more than $1.8 billion/year. Open source ad blockers are a potentially effective technology for energy conservation.
Keywords:
energy conservation; energy; open source; free and open source software; FOSS; free software; ad blocker; Internet; Internet advertising; advertising; tracker; browser tracking; internet tracking; web tracking; tracker blocker; tracker protection; malware blocking; malware protection; privacy; internet privacy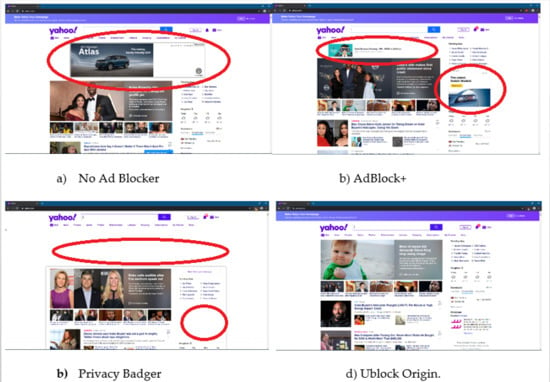
1. Introduction
Americans now spend unprecedented amounts of time online. The Surveying the Digital Future study found that 92% of Americans are Internet users and that, on average, since 2000, the time they spent online more than doubled from 9.4 h to 23.6 h per week [1]. A lot of this Internet time is at home, which has risen more than fivefold from 3.3 to 17.6 h per week [1]. With this rapid growth in Internet use, concern has arisen over the resultant electricity consumption [2]. Concerns stem from the use of fossil fuel combustion to provide electricity generation and its concomitant negative externalities, which have well known negative environmental and health impacts [3]. For example, eliminating coal-fired air pollution alone in the United States would prevent about 52,000 premature American deaths per year [4]. It is estimated that information tech and services accounted for about 5% of total global electricity use and is increasing [5]. Hence, in America, information technology electricity use is roughly responsible for the premature deaths of 2600 Americans annually from coal-related air pollution alone. Thus, minimizing Internet-related energy use is of great importance.
A lot of this Internet use is funded in some way by ads, as it has been shown that the ad-supported Internet ecosystem is now a major part of the United States economy [6]. In general, online ads are viewed as undesirable by Internet users, and many people attempt to avoid them [7]. Despite significant research on advertising avoidance [8,9,10] (which is generally focused on finding determinants of advertising avoidance of online media to provide insights that may suggest strategic ways to decrease advertising avoidance [10,11,12,13]), Internet users are still attempting to protect their time [14,15,16].
Thus, it is not surprising that some of the most popular plugins for both Firefox [17] and Chrome Internet browsers are for ad blocking software, which have been downloaded tens of millions of times [18]. In addition, an increasing number of advertisers are using consumer data and advanced digital technologies to deliver personalized campaigns. The increasingly intrusive nature of advertising has also raised privacy concerns [19,20,21,22]. Counter to this trend, the open source paradigm can dramatically increase trustworthiness for and autonomy of the user [23]. Open source development methods have motivated many technologists to solve many types of technical problems [24,25,26,27,28,29,30] effectively. Of greatest importance to this study, this has resulted in a number of open source ad blockers becoming available [31].
Open source ad blockers have the potential to reduce the time spent on electricity consuming Internet-tied devices by eliminating ads. In this study, three open source ad blockers were tested against a no-ad blocker control for both web browsing and video watching. The time to load the pages is recorded for browsing, and the time spent watching ads on videos was quantified for both trending and non-trending content. From these values, the potential for open source ad blockers to act as effective energy conservation technologies was estimated. The results are presented and discussed.
2. Materials and Methods
2.1. Ad Blocker Selection
Three open source ad blockers were tested against a no-ad blocker browser for both web browsing and video watching: (1) Adblock plus (https://gitlab.com/eyeo/adblockplus; GPLv3), (2) Privacy Badger (https://github.com/EFForg/privacybadger; GPLv3) and (3) uBlock Origin (https://github.com/gorhill/uBlock/, GPLv3).
Adblock Plus (https://adblockplus.org/) is a traditional ad blocker built as a free browser extension. However, the developers recognize that ads finance many websites and thus offer partial ad blocking using an “Acceptable Ads” initiative [32] with strict criteria that identify nonintrusive ads. Users of Adblock Plus decide through settings the level of ads they view, but the default is to allow “Acceptable Ads”. Another approach is taken by Privacy Badger. Privacy Badger was developed by the Electronic Frontier Foundation (EFF) (https://www.eff.org/privacybadger), which is a leading nonprofit organization focused on defending civil liberties and privacy in the digital world. Privacy Badger is a browser extension that automatically analyzes and blocks any tracker or ad that violates the principle of user consent. It was designed to function without any settings, knowledge, or configuration by the user. Finally, uBlock Origin (It should be noted that uBlock.org, is not affiliated with uBlock Origin. The latter which is owned by AdBlock, uses the same “acceptable ads” method, often for which larger publishers pay a fee to make their ads listed as acceptable.) is a wide-spectrum blocker that blocks ads, trackers, and malware sites using (i) EasyList, (ii) EasyPrivacy, (iii) Peter Lowe’s list of ad, tracking and malware servers, and various lists of malware sites, including built-in filter lists. In a previous informal study [33] of resources and load times on a wide range of ten different ad blockers, uBlock Origin was found to be the most efficient.
2.2. Ad Blocker Testing on Webpages
Testing the ability of an ad blocker to block ads on a specific website is challenging because ads are served by third parties, so page load time is dependent on essentially random external servers. To overcome this challenge, each website listed in Table 1 was tested with no ad blocker and the three ad blockers for ten iterations. There is still error associated with this method, so any major outliers were removed and replaced with another page load. Table 1 includes three web search engines, two of the most used sources of information, three news sites, and two of the top Chinese language websites, according to Alexa [34]. The ten page load times were recorded and averaged for each.
Previous studies comparing ad blockers looked at CPU and memory use [33], to see if this had any discernable impact on energy use. A desktop and laptop were monitored by a multimeter during the tests. No discernable difference was observed on several computers, so these data were not further analyzed. Finally, the effectiveness of the ad blockers was determined for their ability to block ads.
2.3. Ad Blocker Testing of Streaming Video
To test the three ad blockers for their ability to screen out in-video ads on a streaming video site, YouTube (www.youtube.com) was selected because it is the largest video website [35]. Three trending channels were selected that would represent ad-heavy content: (i) House of Highlights (2.29 million subscribers), (ii) Good Mythical Morning (16.2 million subscribers), and (iii) jacksepticeye (23.3 million subscribers). Then three non-trending channels were selected: (i) Max and Tony (13 subscribers), (ii) Keeganchu (1.9 thousand subscribers), and (iii) Glitch (115 thousand subscribers). Three videos were selected in each channel, and the total duration and content duration were recorded for each. The percent ad time was determined for no ad blocker control and the three ad blockers described in Section 2.1.
2.4. Energy Conservation Estimates
Annual energy conservation potential in the United States and the world for open source ad blockers speeding up the use of the web, Ey(USA) and Ey(Globe), can be conservatively estimated by first determining the time spent loading web pages on computers.
The time per year saved per person who uses the web in hours, th/y, for a specific population (pop) is given by:
where pr is the percent of time web users are rapidly clicking through the web, lh is the page loads per hour during this rapid click time, wh/y(pop) is the hours spent per day on the web × 365 days/year, and tl is the average load time per page in seconds, and sblock−x is the percent time savings using ad block x where x is one of the three ad blockers evaluated. Time reports that 55% of Internet use is spent with fewer than 15 s actively on a page [34], so the rapid clicking percent, pr is 0.55, and the page loads per hour, lh is 240. In this study, two populations will be considered: (1) the world and (2) the United States. In the United States, the time spent using the Internet is 6 h and 31 min per day, and the world average is 6 h 42 min per day [35]. Thus, wh/y(U.S.) is 2372.5 h/year and wh/y(Globe) is 2445.5 h/year. This study will provide tl and sblock−x for the three open source ad blockers.
The energy, Ey(pop), used for web users to watch ads on their own devices (Please note that any external or server-based energy conservation, which consumers do not pay for directly, will be left for future work.) can be calculated by:
where fc is the fraction of web devices that are computers, Pc is the power in Watts of the average computer in the population, and Ppop is the total population in the specific population. In 2019, the mobile share of web use was 48%, which means the computer user fraction, Fc, of web use is 0.52 [35]. It was assumed here that Internet use is the same for both types of devices. This use may differ, and the complexities of tracking that across the globe are left for future work. To be conservative, for this estimate for the energy used on mobile phones will be ignored and also left for future work. Lawrence Berkeley National Lab performed a detailed analysis of computer energy use and found the average power draw for a desktop was 66.1 W and a laptop was 32.0 W. The overall average was 58.5 W, which is used for Pc [36]. Finally, the population, Pglobe, for the globe is made up of 4.4 billion Internet users worldwide [35]. The United States has more than 312 million Internet users with over a 95% penetration rate [37].
Web users that use open source ad blockers would thus save the following money, Sy(pop), if everyone used ad blockers:
where re(pop) is the electric rate for the given population. The average electric rate for the globe is 0.14 USD/kWh and for the United States it is 0.1269 USD/kWh [38]. These calculations can be extended in future work by considering the costs of electricity around the world [39].
For non-rapid web clicking, there would also be energy saved with the ad blockers, but it will be far less than during the rapid clicking time. One of the times, however, when people are using the web and not clicking frantically, is when they are watching movies, tv, music videos, etc., via streaming video.
Finally, to get a conservative estimate of the energy consumed for streaming video, calculations are based on YouTube data. YouTube is the second most used website, according to Alexa [40]. The time YouTube watchers globally can save with ad blockers is estimated as:
where tview is the total hours spent watching YouTube by all users globally per day, and pads is the percent of time streaming spent on ads. YouTube has over 2 billion users worldwide, who watch over 1 billion h of streaming videos per day [41], so tview is approximately 1 billion h. The value of pads will be supplied by data from this study using a high and low sensitivity bounded by the more frequently watched trending channels and the less frequently watched non-trending channels.
The energy saving from ad blockers functioning on YouTube, EYouTube, can be estimated for the entire globe only because Alphabet, an ad revenue-based company that owns Google and YouTube, does not make their data public (Alphabet does, however, keep a significant amount of data about their users. Users can access some of this data and possibly stop some of the Google tracking activity following Nielo [42]):
where fc−YouTube is the fraction of web devices that are computers. Seventy percent of YouTube watch time comes from mobile devices [41], so fc−YouTube is set at a conservative 0.25. For this estimate, again, the energy used on mobile phones will be ignored and left for future work.
Finally, the economics savings potential for YouTube users that deploy an effective open source ad blocker can be estimated as:
3. Results and Discussion
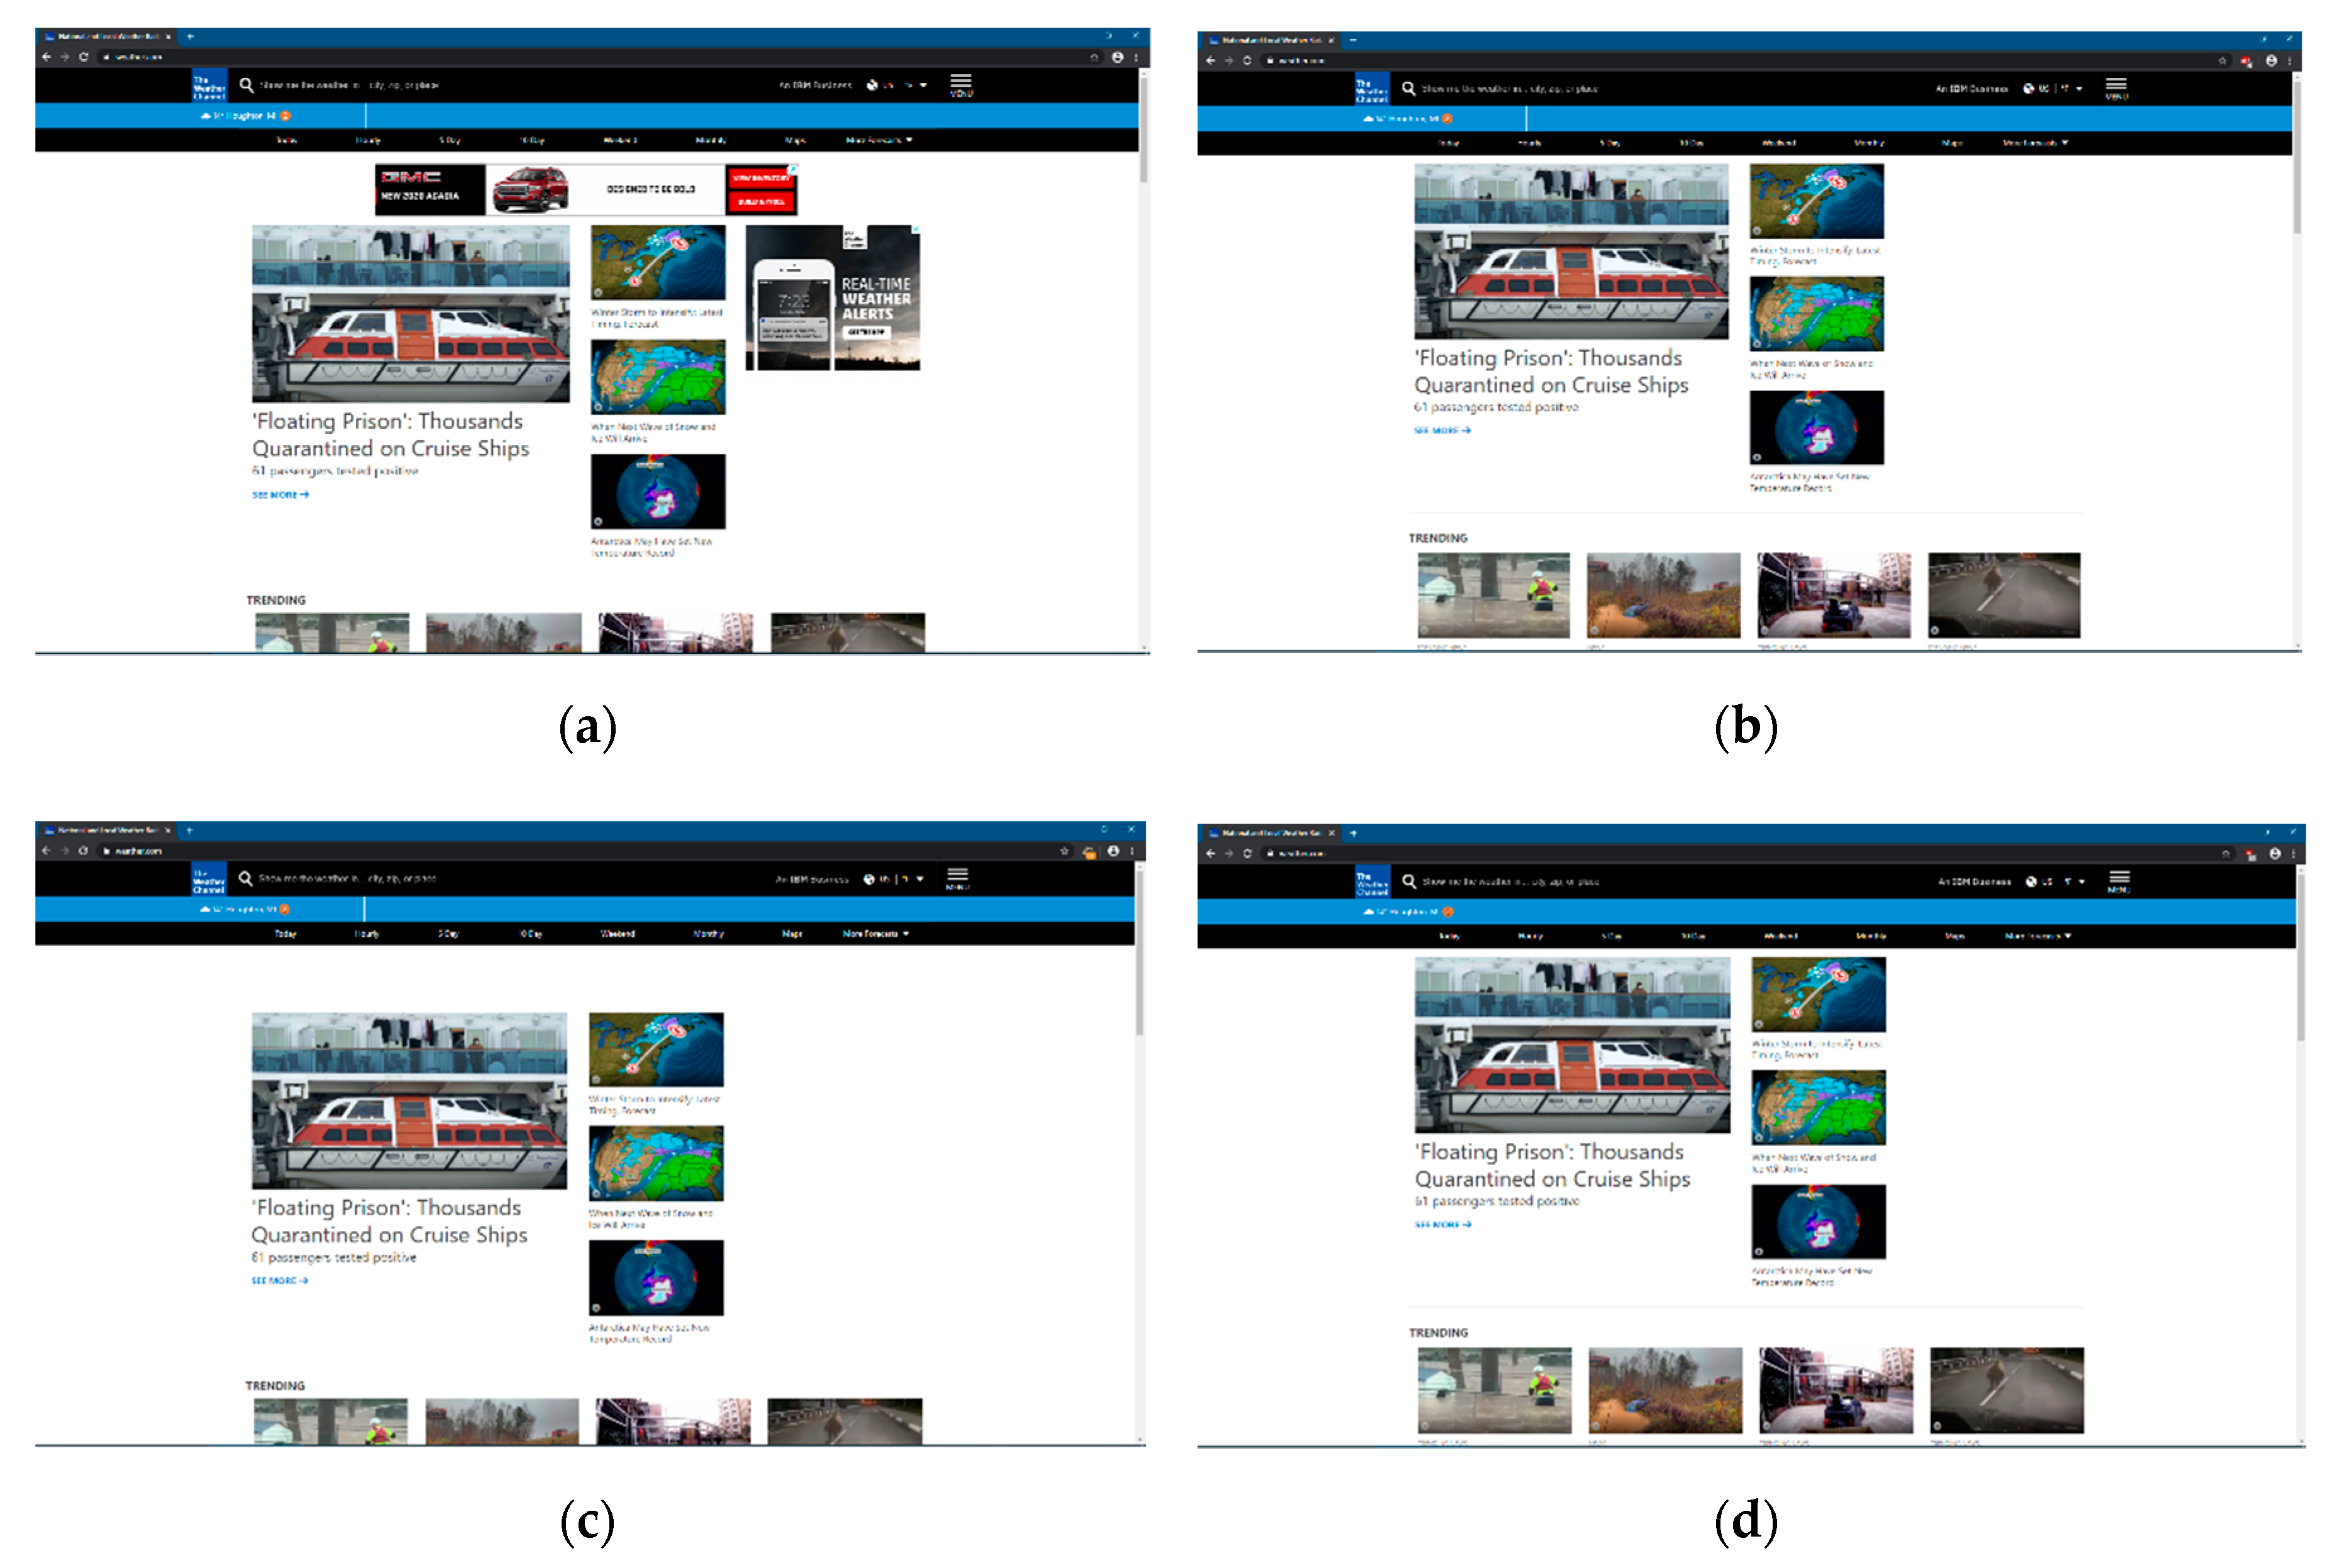
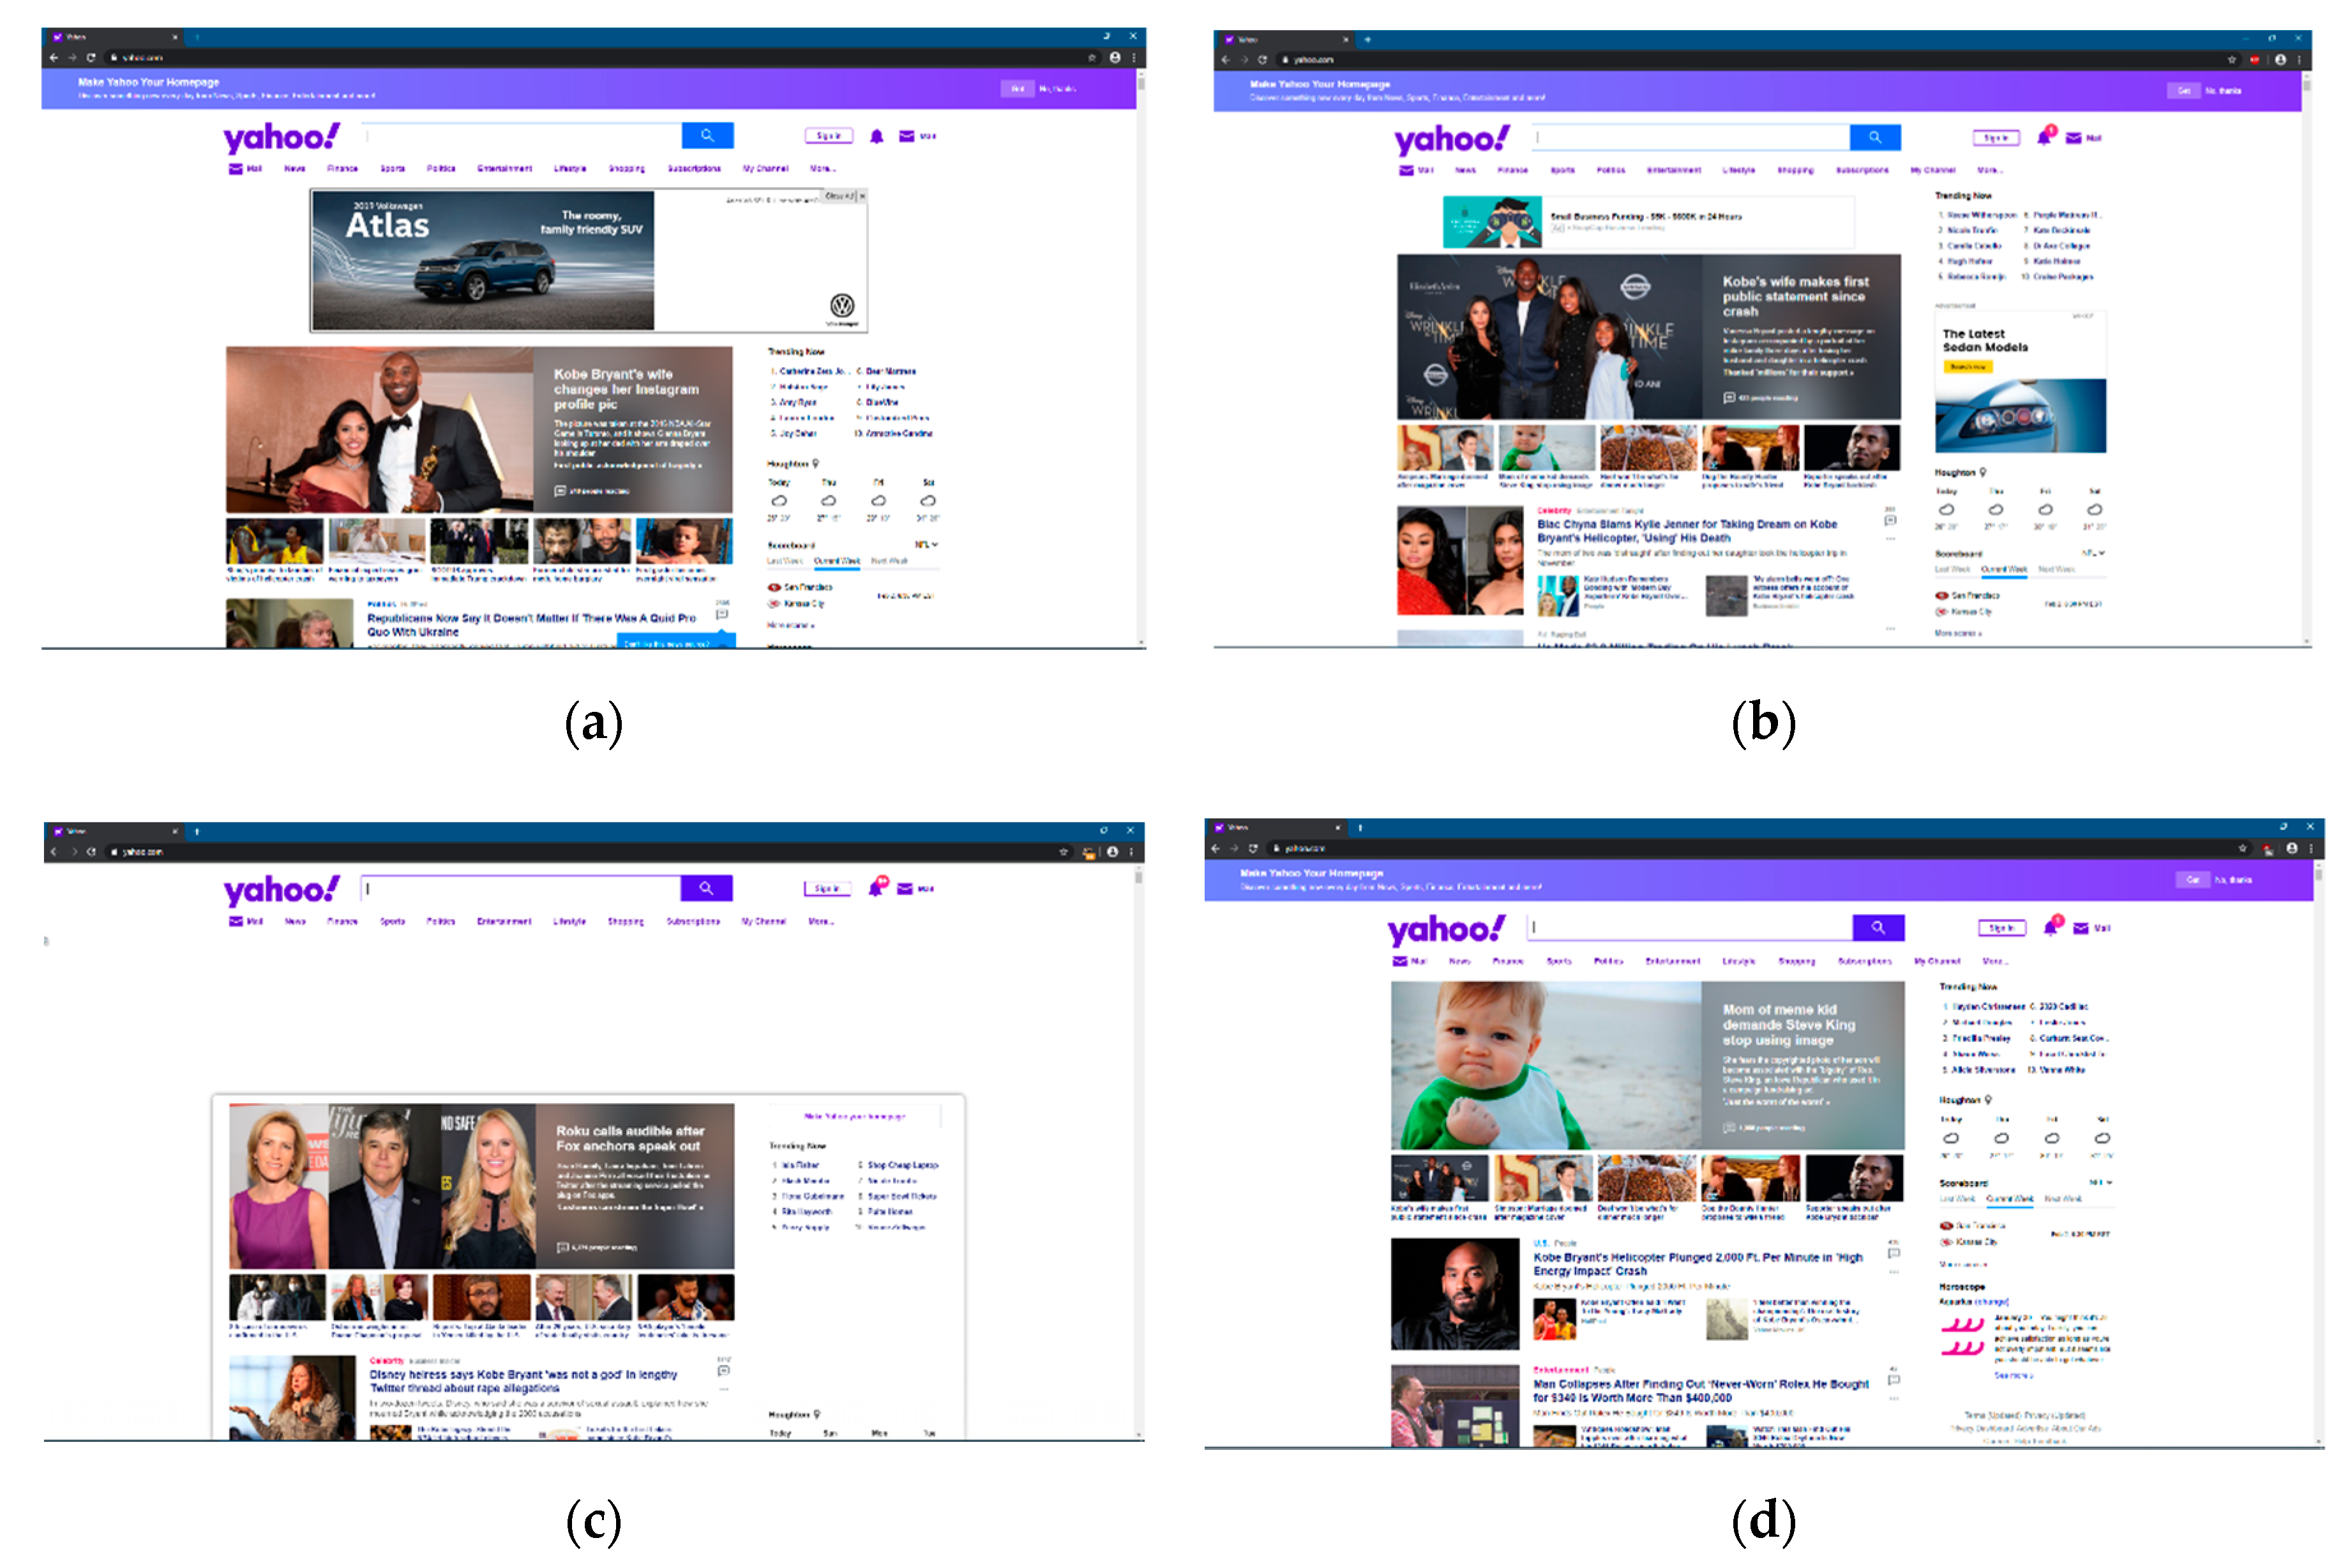
All of the open source ad blockers tested were able to eliminate at least some ads for webpage browsing effectively. This is demonstrated with screenshot data of two representative websites: the Weather Channel website (Figure 1) and the Yahoo website (Figure 2) without ad blockers and the results for AdBlock+, Privacy Badger, and uBlock Origin. With no ad blocker (Figure 1a), the front page of the Weather Channel had two ads showing a horizontal ad at the top and a box ad on the right. These ads took up enough screen area that the trending stories are not completely visible. With AdBlock+ enabled (Figure 1b), both ads were removed, and the page enabled viewing of the trending stories. Privacy Badger, as seen in Figure 1c, also eliminated all ads from the viewer, but did not reformat, so no additional screen area was obtained. Finally, as seen in Figure 1d), uBlock Origin provided identical results to AdBlock+. This, however, was not always the case, as shown in Figure 2.
With no ad blocker (Figure 2a), the front page of Yahoo was dominated by a large horizontal ad taking up roughly a quarter of the pages content area. With AdBlock+ enabled (Figure 2b), this large ad was removed, but a smaller horizontal ad replaced it at the top, and an additional small ad was still visible in the middle right-hand side of the content area. These were presumed to be ‘acceptable ads’ following the AdBlock+ business model and were objectively less intrusive than with no ad blocker. Privacy Badger, on the other hand, as seen in Figure 1c, eliminates all ads from the viewer as before. However, white space was left in the place that ads were located without the ad blocker enabled. Finally, as seen in Figure 1d, uBlock Origin not only eliminated all ads but also eliminated the white space. This effectively provided more content per screen than all of the other options, including those, such as Yahoo, that presumably paid AdBlock+ to be deemed “acceptable”.
The results of the visual results indicated by the screen captures in Figure 1 and Figure 2 agree with the average page load time data, which is summarized in Table 2. For the ten websites analyzed, the average of the average page load time was 3.9 s (tl). Table 2 also shows the percent of saved load time for each open source ad blocker. The page load time dropped 11% with AdBlock+, 22.2% with Privacy Badger, and 28.5% with uBlock Origin, which provides sblock−x. Clearly, uBlock Origin has the greatest potential of the three open source ad blockers tested to save Internet users the most time.
However, there is other interesting information provided by Table 1 that can explain the observations in Figure 1 and Figure 2, AdBlock+, for example, took more time than the no ad blocker case for Yahoo, which could be caused by the reformatting to have different ads and/or the speed of the various servers providing those effective ads. Whereas, for the Weather Channel, all of the open source ad blockers tested cut down the page load time by 33 to 43 percent compared to the no ad blocking case. Due, in large part, to the remarkable click rate of Internet users (240 per day) during rapid browsing, the potential time saved by enabling open source ad blockers is substantial. These values were calculated for all of the open source ad browsers and are summarized in Table 3.
As can be seen in Table 3, the time per year saved per person who uses the web over the entire globe using Equation (1), ranged from 38.9 h for AdBlock+ to over 100 h using uBlock Origin. For the latter, this is equivalent to 2.5 working weeks of productivity lost watching ads per year for the average net citizen. In the United States. because of slightly less Internet usage per day, the results were a few percent less. It again should be pointed out here that this is a conservative estimate as none of the time lost to ad loading times is included for non-rapid web surfing, which makes up nearly half of Internet use.
The electrical energy conserved using the three ad blockers was calculated following Equation (2), and resultant electricity bill savings following Equation (3) are shown in Table 4. Again, this is a conservative estimate as it not only used the conservative times from Table 3 but also only included the energy used on the fraction of computers used and only considered the users’ side of the energy use (e.g., what consumers would pay for in their utility bills). Despite these conservative assumptions, both the energy conservation potential of the various open source ad blockers as well as the economic savings for consumers is remarkable. So, for example, the 1.35 × 10¹⁰ kWh saved globally for using uBlock Origin is equivalent to more than 1.0% of the electricity generated per year from coal in the United States, which is responsible for the premature deaths of about 52,000 American every year from air pollution [43,44]. The energy savings potential in the United States from using uBlock Origin was a much smaller 0.07%. However, if we assume that the electricity used to power the computers to watch ads came from coal, the reduced coal-fired pollution from using uBlock Origin could save over 36 American lives per year. Although far more pollution could be cut by converting to renewable energy and nearly all the lives could be saved [4,45], 36 lives are still considerable as it is more than the number of people murdered in the 2007 Virginia Tech shooting rampage [46] (It has previously been questioned why the coal industry is allowed to continue profiting from the deaths of Americans when there are ample and lower-cost alternative sources of electricity [47]).
Significant future work is needed to determine the energy conservation potential on the server side. Data servers use a substantial and growing amount of energy, and there is considerable effort to reduce that energy use [48,49,50] using both thermal management [51,52,53,54], electrical management [55], configuration [56], and smart systems [57]. The concept of green data centers [58,59] is growing. Facebook open sourced their designs [60], and there is even open hardware that could be used to help monitor and improve them [61]. Despite this effort, the results of this study indicate some of the lowest-hanging fruit is simply to eliminate the need for some servers by expanding the deployment of open source ad blockers. Future work should consider policies to encourage this deployment for energy conservation alone, although there are clearly arguments for saving Internet users’ time as well as consumers’ money.
Economically the savings for the use of open source ad blockers are potentially easier to understand. For example, in the United States, if all Internet users enabled Privacy Badger on their computers, they would expect to save more than 91 million dollars annually. Globally, if all Internet users used uBlock Origin, they would collectively save more than 1.8 billion U.S. dollars a year.
These savings (Table 4) only considered the rapid page loading portion of Internet users’ time spent on the web. Much of the remainder of the time is spent streaming videos in general and YouTube in particular. Due to the lack of data on what ratio of YouTube ad time is spent on trending and non-trending content, a sensitivity between the two resulted in a minimum estimated ad time of 0.06% up to 21%. Time spent watching YouTube ads determined using Equation (4) ranges from 600,000 h/day 210 billion h/day globally. EYouTube from Equation (5) ranges from 3.6 million to 1.13 billion kWh/year, and the economic savings from using uBlock Origin would range from just under half a million dollars to $158 million per year globally. This obviously is an enormous range due to the uncertainty of YouTube viewer habits and the ad algorithms. The YouTube analysis can be treated as a preliminary study just to determine if future work is warranted. It appears to be the case as that if the majority of YouTube viewing is for trending or popular videos that have substantial ads, both the energy used and money spent watching them on electricity could be on the order of 8% of the expenditures for rapid web browsing from Table 4.
Although this study had clear limitations on both the size and scope (e.g., number of open source ad blockers analyzed as well as websites analyzed), elasticity of Internet use (e.g., consumers may not reduce their Internet use by the time saved from not having to allow ads to load), and access to information (e.g., YouTube ad algorithms and users’ statistics), the preliminary results were enough to provide interesting insights into the use of open source software for energy conservation. Historically the use of free and open source software aimed at energy conservation could be grouped into broad categories of software for green computing and manufacturing [62,63], simulation [64], energy conservation education and knowledge dissemination [65,66,67], or energy conservation controls [68,69]. Now those that fund energy conservation efforts, such as the Department of Energy in the United States, may want to look closely at the return on investment for investing directly in open source development of software and hardware that consumers have an incentive to use to maximize returns on public funding [70,71,72,73,74]. Providing increased economic motivation for free and open source software development to maintain the virtual arms race with well-funded advertising-based companies may be needed [75,76,77]. As Malloy et al. pointed out, “ad blockers are a formidable threat” to online advertising [78], and efforts to thwart their effectiveness are underway [77,79]. Overall, the evaluations in this study agreed with the effectiveness of ad blockers seen before [80], and as ads annoy users [81], ad blocker use can be expected to continue to expand [82]. To accelerate the pace of this expansion, further work is needed in both informing Internet users about the costs of advertising (both in Internet users’ time as well as energy and environmental impact) as well as the technical development of ad blockers to win the “virtual arms race” with advertisers. For countries looking for easy and low-cost energy conservation measures, opportunities to implement policies to encourage the development and deployment of open source ad blockers are clear from the results of this study.
4. Conclusions
This study, although preliminary, clearly showed enormous potential for open source ad blockers to reduce consumer time waiting for Internet ads to load as well as the electricity needed to run their computers (and other electronic technologies) during that time. In addition, the externalities (including premature fatalities) associated with fossil-fuel-based electricity spent using computers by eliminating ads during Internet browsing and video streaming would be reduced. The results show that page load time was reduced for all open source ad blockers: 11% with AdBlock+, 22.2% with Privacy Badger, and 28.5% with uBlock Origin. Strikingly, uBlock Origin has the potential to save the average global Internet user more than 100 h annually. The energy conserved if everyone in the United States used an open source ad blocker would save over 36 Americans lives per year if it were to offset coal-fired electricity generated-based pollution. Similarly, in the United States, if all American Internet users enabled Privacy Badger on their computers, Americans would save more than $91 million annually. Globally, the results with the most efficient open source ad blocker tested, uBlock Origin, would be even more substantial: ad blocking would save consumers more than $1.8 billion/year. It is clear from this study that open source ad blockers are an effective technology for energy conservation.
Funding
This research was funded by the Witte Endowment.
Acknowledgments
The author would like to acknowledge technical assistance and helpful discussions with E. Garvey.
Conflicts of Interest
The author declares no conflict of interest.
References
- Cole, J.I.; Suman, M.; Schramm, P.; Zhou, L. Surveying the Digital Future. 2017. Available online: http://www.digitalcenter.org/wp-content/uploads/2013/10/2017-Digital-Future-Report.pdf (accessed on 29 March 2020).
- Aslan, J.; Mayers, K.; Koomey, J.G.; France, C. Electricity Intensity of Internet Data Transmission: Untangling the Estimates. J. Ind. Ecol. 2018, 22, 785–798. [Google Scholar] [CrossRef]
- Epstein, P.; Buonocore, J.; Eckerle, K.; Hendryx, M.; Stout, B.; Heinberg, R.; Clapp, R.; May, B.; Reinhart, N.; Ahern, M.; et al. Full cost accounting for the life cycle of coal. Ann. N. Y. Acad. Sci. 2011, 1219, 73–98. [Google Scholar] [CrossRef] [PubMed]
- Prehoda, E.W.; Pearce, J.M. Potential lives saved by replacing coal with solar photovoltaic electricity production in the U.S. Renew. Sustain. Energy Rev. 2017, 80, 710–715. [Google Scholar] [CrossRef] [Green Version]
- Van Heddeghem, W.; Lambert, S.; Lannoo, B.; Colle, D.; Pickavet, M.; Demeester, P. Trends in worldwide ICT electricity consumption from 2007 to 2012. Comput. Commun. 2014, 50, 64–76. [Google Scholar] [CrossRef] [Green Version]
- Deighton, J.; Kornfeld, L.; Gerra, M. Economic Value of the Advertising-Supported Internet Ecosystem. 2017. Available online: https://www.iab.com/wp-content/uploads/2017/03/Economic-Value-Study-2017-FINAL2.pdf (accessed on 29 March 2020).
- Li, W.; Huang, Z. The Research of Influence Factors of Online Behavioral Advertising Avoidance. Am. J. Ind. Bus. Manag. 2016, 6, 947. [Google Scholar] [CrossRef]
- Smith, R.E.; Swinyard, W.R. Information Response Models: An Integrated Approach. J. Mark. 1982, 46, 81–93. [Google Scholar] [CrossRef]
- Malhotra, N.K.; King, T. Don’t negate the whole field. Mark. Res. 2003, 15, 43. [Google Scholar]
- Pasadeos, Y. Perceived Informativeness of and Irritation with Local Advertising. J. Mass Commun. Q. 2016, 67, 35–39. [Google Scholar] [CrossRef]
- Rodgers, S.; Wang, Y.; Ruth, R.; Frank, A. The Web Motivation Inventory: Replication, Extension, and Application to Internet Advertising. Int. J. Advert. 2007, 26, 447–476. [Google Scholar] [CrossRef]
- White, T.B.; Zahay, D.L.; Thorbjørnsen, H.; Shavitt, S. Getting too personal: Reactance to highly personalized email solicitations. Mark. Lett. 2008, 19, 39–50. [Google Scholar] [CrossRef]
- Roberts, M.L.; Zahay, D. Internet Marketing: Integrating Online and Offline Strategies; Cengage Learning: Boston, MA, USA, 2012; ISBN 978-1-285-40203-1. [Google Scholar]
- Milne, G.R.; Boza, M.-E. Trust and Concern in Consumers’ Perceptions of Marketing Information Management Practices. J. Interact. Mark. 1999, 13, 5–24. [Google Scholar] [CrossRef]
- Nowak, G.J.; Joseph, P. Understanding Privacy Concerns: An Assessment of Consumers’ Information-Related Knowledge and Belief. J. Direct Mark. 1992, 6, 28–39. [Google Scholar] [CrossRef]
- Gurau, C.; Ashok, R.; Claire, G. To Legislate or Not to Legislate: A Comparative Study of Privacy/Personalization Factors Affecting French, UK and US Web Sites. J. Consum. Mark. 2003, 20, 652–664. [Google Scholar] [CrossRef]
- Miller, F. The 14 Best Mozilla Firefox Add-ons, Apps & Extensions of 2020. Product. Land 2019. Available online: https://productivityland.com/best-firefox-add-ons-extensions/ (accessed on 23 February 2020).
- Spadafora, A. These are the most popular Google Chrome extensions. Tech. Radar 2019. Available online: https://www.techradar.com/news/most-popular-google-chrome-extensions (accessed on 22 February 2020).
- Evans, D.S. The Online Advertising Industry: Economics, Evolution, and Privacy. J. Econ. Perspect. 2009, 23, 37–60. [Google Scholar] [CrossRef] [Green Version]
- Vega, T. For Online Privacy, Click Here. The New York Time. 19 January 2012. Available online: https://www.nytimes.com/2012/01/20/business/media/the-push-for-online-privacy-advertising.html (accessed on 29 February 2020).
- Lipman, R. Online Privacy and the Invisible Market for Our Data. Penn St. L. Rev. 2015, 120, 777. [Google Scholar]
- Hawthorne-Castro, J. Digital Advertising and Consumer Privacy: Three Trends to Watch. Mar. Tech. Advis. 2018. Available online: https://www.martechadvisor.com/articles/ads/digital-advertising-and-consumer-privacy-three-trends-to-watch/ (accessed on 22 February 2020).
- Hansen, M.; Köhntopp, K.; Pfitzmann, A. The Open Source approach—opportunities and limitations with respect to security and privacy. Comput. Secur. 2002, 21, 461–471. [Google Scholar] [CrossRef]
- Feller, J.; Fitzgerald, B. Understanding Open Source Software Development; Addison-Wesley: London, UK, 2002; pp. 143–159. [Google Scholar]
- Lakhani, K.R.; Wolf, R.G. Why hackers do what they do: Understanding motivation and effort in free/open source software projects. Perspect. Free Open Source Softw. 2005, 1, 3–22. [Google Scholar] [CrossRef]
- Hippel, E.V.; Krogh, G.V. Open source software and the “private-collective” innovation model: Issues for organization science. Organ. Sci. 2003, 14, 209–223. [Google Scholar] [CrossRef] [Green Version]
- Pearce, J.M. Building Research Equipment with Free, Open-Source Hardware. Science 2012, 337, 1303–1304. [Google Scholar] [CrossRef] [PubMed]
- Pearce, J. Open-Source Lab: How to Build Your Own Hardware and Reduce Research Costs, 1st ed.; Elsevier: Waltham, MA, USA, 2014. [Google Scholar]
- Gibb, A.; Abadie, S. Building Open Source Hardware: DIY Manufacturing for Hackers and Makers, 1st ed.; Addison-Wesley Professional: Boston, MA, USA, 2014. [Google Scholar]
- Oberloier, S.; Pearce, J.M. General Design Procedure for Free and Open-Source Hardware for Scientific Equipment. Designs 2018, 2, 2. [Google Scholar] [CrossRef] [Green Version]
- Open Source AdBlock Alternatives-AlternativeTo.net. Available online: https://alternativeto.net/software/adblock-for-chrome/?license=opensource (accessed on 22 February 2020).
- Allowing Acceptable Ads in Adblock Plus. Available online: https://adblockplus.org/en/acceptable-ads (accessed on 27 February 2020).
- 10 Ad Blocking Extensions Tested for Best Performance • Raymond.CC. Available online: https://www.raymond.cc/blog/10-ad-blocking-extensions-tested-for-best-performance/ (accessed on 27 February 2020).
- Haile, T. What You Think You Know About the Web Is Wrong. Time. 2014. Available online: https://time.com/12933/what-you-think-you-know-about-the-web-is-wrong/ (accessed on 29 February 2020).
- Kemp, S. Digital trends 2019: Every Single Stat You Need to Know about the Internet. Available online: https://thenextweb.com/contributors/2019/01/30/digital-trends-2019-every-single-stat-you-need-to-know-about-the-internet/ (accessed on 29 February 2020).
- Desroches, L.-B.; Fuchs, H.; Greenblatt, J.; Pratt, S.; Willem, H.; Claybaugh, E.; Beraki, B.; Nagaraju, M.; Price, S.; Young, S. Computer Usage and National Energy Consumption: Results from a Field-Metering Study; Lawrence Berkeley National Lab. (LBNL): Berkeley, CA, USA, 2014.
- United States Internet Usage and Population State by State. Available online: https://www.internetworldstats.com/unitedstates.htm (accessed on 3 March 2020).
- EIA-Electricity Data. Available online: https://www.eia.gov/electricity/monthly/epm_table_grapher.php?t=epmt_5_6_a (accessed on 3 March 2020).
- Electricity Prices around the World | GlobalPetrolPrices.com. Available online: https://www.globalpetrolprices.com/electricity_prices/ (accessed on 3 March 2020).
- Alexa-Top Sites. Available online: https://www.alexa.com/topsites (accessed on 3 March 2020).
- YouTube. Press–YouTube. Available online: https://www.youtube.com/about/press/ (accessed on 3 March 2020).
- Nielo, D. All the Ways Google Tracks You—And How to Stop It. Wired. 27 May 2019. Available online: https://www.wired.com/story/google-tracks-you-privacy/ (accessed on 3 March 2020).
- Caiazzo, F.; Ashok, A.; Waitz, I.A.; Yim, S.H.L.; Barrett, S.R.H. Air pollution and early deaths in the United States. Part I: Quantifying the impact of major sectors in 2005. Atmos. Environ. 2013, 79, 198–208. [Google Scholar] [CrossRef]
- Dedoussi, I.C.; Barrett, S.R.H. Air pollution and early deaths in the United States. Part II: Attribution of PM2.5 exposure to emissions species, time, location and sector. Atmos. Environ. 2014, 99, 610–617. [Google Scholar] [CrossRef]
- Burney, J.A. The downstream air pollution impacts of the transition from coal to natural gas in the United States. Nat. Sustain. 2020, 3, 152–160. [Google Scholar] [CrossRef]
- Perry, M. Massacre sparks foreign criticism of U.S. gun culture. Reuters. 17 April 2007. Available online: https://www.reuters.com/article/us-usa-crime-shooting-world/massacre-sparks-foreign-criticism-of-u-s-gun-culture-idUSL1752333820070417 (accessed on 3 March 2020).
- Pearce, J.M. Towards Quantifiable Metrics Warranting Industry-Wide Corporate Death Penalties. Soc. Sci. 2019, 8, 62. [Google Scholar] [CrossRef] [Green Version]
- Gizli, V.; Marx Gómez, J. A Framework to Optimize Energy Efficiency in Data Centers Based on Certified KPIs. Technologies 2018, 6, 87. [Google Scholar] [CrossRef] [Green Version]
- Ni, J.; Bai, X. A review of air conditioning energy performance in data centers. Renew. Sustain. Energy Rev. 2017, 67, 625–640. [Google Scholar] [CrossRef]
- Choo, K.; Galante, R.M.; Ohadi, M.M. Energy consumption analysis of a medium-size primary data center in an academic campus. Energy Build. 2014, 76, 414–421. [Google Scholar] [CrossRef]
- Singh, R.; Mochizuki, M.; Mashiko, K.; Nguyen, T. Heat pipe based cold energy storage systems for datacenter energy conservation. Energy 2011, 36, 2802–2811. [Google Scholar] [CrossRef]
- Bai, Y.; Gu, L.; Qi, X. Comparative Study of Energy Performance between Chip and Inlet Temperature-Aware Workload Allocation in Air-Cooled Data Center. Energies 2018, 11, 669. [Google Scholar]
- Priyadumkol, J.; Kittichaikarn, C. Application of the combined air-conditioning systems for energy conservation in data center. Energy Build. 2014, 68, 580–586. [Google Scholar] [CrossRef]
- Meng, X.; Zhou, J.; Zhang, X.; Luo, Z.; Gong, H.; Gan, T. Optimization of the thermal environment of a small-scale data center in China. Energy 2020, 196, 117080. [Google Scholar] [CrossRef]
- Mitchell, R.B.; York, R. Reducing the web’s carbon footprint: Does improved electrical efficiency reduce webserver electricity use? Energy Res. Soc. Sci. 2020, 65, 101474. [Google Scholar] [CrossRef]
- Liu, Z.; Yu, H.; Liu, R.; Wang, M.; Li, C. Configuration Optimization Model for Data-Center-Park-Integrated Energy Systems under Economic, Reliability, and Environmental Considerations. Energies 2020, 13, 448. [Google Scholar] [CrossRef] [Green Version]
- Fernández-Cerero, D.; Fernández-Montes, A.; Velasco, F. Productive Efficiency of Energy-Aware Data Centers. Energies 2018, 11, 2053. [Google Scholar] [CrossRef] [Green Version]
- Bahari, H.I.; Shariff, S.S.M. Review on data center issues and challenges: Towards the Green Data Center. In Proceedings of the 2016 6th IEEE International Conference on Control System, Computing and Engineering (ICCSCE), Penang, Malaysia, 25–27 November 2016; pp. 129–134. [Google Scholar]
- Zafar, S.; Chaudhry, S.A.; Kiran, S. Adaptive TrimTree: Green Data Center Networks through Resource Consolidation, Selective Connectedness and Energy Proportional Computing. Energies 2016, 9, 797. [Google Scholar] [CrossRef] [Green Version]
- Building Efficient Data Centers with the Open Compute Project | Facebook. Available online: https://www.facebook.com/notes/facebook-engineering/building-efficient-data-centers-with-the-open-compute-project/10150144039563920/ (accessed on 4 March 2020).
- Oberloier, S.; Pearce, J.M. Open source low-cost power monitoring system. HardwareX 2018, 4, e00044. [Google Scholar] [CrossRef]
- Fakhar, F.; Javed, B.; ur Rasool, R.; Malik, O.; Zulfiqar, K. Software level green computing for large scale systems. J. Cloud Comput. 2012, 1, 4. [Google Scholar] [CrossRef] [Green Version]
- Byard, D.J.; Woern, A.L.; Oakley, R.B.; Fiedler, M.J.; Snabes, S.L.; Pearce, J.M. Green fab lab applications of large-area waste polymer-based additive manufacturing. Addit. Manuf. 2019, 27, 515–525. [Google Scholar] [CrossRef] [Green Version]
- Stifter, M.; Widl, E.; Andrén, F.; Elsheikh, A.; Strasser, T.; Palensky, P. Co-simulation of components, controls and power systems based on open source software. In Proceedings of the 2013 IEEE Power Energy Society General Meeting, Vancouver, BC, Canada, 21–25 July 2013; pp. 1–5. [Google Scholar]
- Brewer, R.S.; Lee, G.E.; Johnson, P.M. The Kukui Cup: A Dorm Energy Competition Focused on Sustainable Behavior Change and Energy Literacy. In Proceedings of the 2011 44th Hawaii International Conference on System Sciences, Koloa, HI, USA, 4–7 January 2011; pp. 1–10. [Google Scholar]
- Leslie, P.; Pearce, J.M.; Harrap, R.; Daniel, S. The application of smartphone technology to economic and environmental analysis of building energy conservation strategies. Int. J. Sustain. Energy 2012, 31, 295–311. [Google Scholar] [CrossRef] [Green Version]
- Zelenika, I.; Pearce, J.M. The Internet and other ICTs as tools and catalysts for sustainable development: Innovation for 21st century. Inf. Dev. 2013, 29, 217–232. [Google Scholar] [CrossRef]
- Wen, Y.-J.; Bonnell, J.; Agogino, A.M. Energy Conservation Utilizing Wireless Dimmable Lighting Control in a Shared-Space Office. In Proceedings of the Illuminating Engineering Society of North America Annual Conference 2008, Savannah, GA, USA, 10–11 November 2008; pp. 97–108. [Google Scholar]
- Capehart, B.L.; Middelkoop, T. Handbook of Web Based Energy Information and Control Systems; The Fairmont Press, Inc.: Lilburn, GA, USA, 2011; ISBN 978-0-88173-669-4. [Google Scholar]
- O’Reilly, T. Lessons from open-source software development. Commun. ACM 1999, 42, 32–37. [Google Scholar] [CrossRef]
- Guhlin, M. Open Source and ROI: Open Source Has Made Significant Leaps in Recent Years. What Does It Have to Offer Education? Technol. Learn. 2007, 27, 12. [Google Scholar]
- Pearce, J.M. Return on investment for open source scientific hardware development. Sci. Public Policy 2016, 43, 192–195. [Google Scholar] [CrossRef]
- Coakley, M.; Hurt, D.E. 3D Printing in the Laboratory: Maximize Time and Funds with Customized and Open-Source Labware. J. Lab. Autom. 2016, 21, 489–495. [Google Scholar] [CrossRef] [Green Version]
- Pearce, J.M. Maximizing Returns for Public Funding of Medical Research with Opensource Hardware. Health Policy Technol. 2017, 6, 381. [Google Scholar] [CrossRef] [Green Version]
- Riehle, D. The Economic Motivation of Open Source Software: Stakeholder Perspectives. Computer 2007, 40, 25–32. [Google Scholar] [CrossRef]
- Linåker, J.; Munir, H.; Wnuk, K.; Mols, C.E. Motivating the contributions: An Open Innovation perspective on what to share as Open Source Software. J. Syst. Softw. 2018, 135, 17–36. [Google Scholar] [CrossRef]
- Mughees, M.H.; Qian, Z.; Shafiq, Z.; Dash, K.; Hui, P. A First Look at Ad-block Detection: A New Arms Race on the Web. arXiv 2016, arXiv:1605.05841. [Google Scholar]
- Malloy, M.; McNamara, M.; Cahn, A.; Barford, P. Ad Blockers: Global Prevalence and Impact. In Proceedings of the 2016 ACM on Internet Measurement Conference-IMC ’16, Santa Monica, CA, USA, 14–16 November 2016; ACM Press: Santa Monica, CA, USA, 2016; pp. 119–125. [Google Scholar]
- Bashir, M.A.; Arshad, S.; Kirda, E.; Robertson, W.; Wilson, C. How Tracking Companies Circumvented Ad Blockers Using WebSockets. In Proceedings of the Internet Measurement Conference 2018- IMC ’18, Boston, MA, USA, 31 October–2 November 2018; ACM Press: Boston, MA, USA, 2018; pp. 471–477. [Google Scholar]
- Post, E.L.; Sekharan, C.N. Comparative Study and Evaluation of Online Ad-Blockers. In Proceedings of the 2015 2nd International Conference on Information Science and Security (ICISS), Seoul, Korea, 14–16 December 2015; IEEE: Seoul, Korea, 2015; pp. 1–4. [Google Scholar]
- Pujol, E.; Hohlfeld, O.; Feldmann, A. Annoyed Users: Ads and Ad-Block Usage in the Wild. In Proceedings of the 2015 ACM Conference on Internet Measurement Conference-IMC ’15, Tokyo, Japan, 28–30 October 2015; ACM Press: Tokyo, Japan, 2015; pp. 93–106. [Google Scholar]
- Redondo, I.; Aznar, G. To use or not to use ad blockers? The roles of knowledge of ad blockers and attitude toward online advertising. Telemat. Inform. 2018, 35, 1607–1616. [Google Scholar] [CrossRef] [Green Version]
Figure 1.
The impact of open source ad blockers on the Weather Channel website: (a) no ad block, (b) AdBlock+, (c) Privacy Badger, and (d) uBlock Origin.
Figure 1.
The impact of open source ad blockers on the Weather Channel website: (a) no ad block, (b) AdBlock+, (c) Privacy Badger, and (d) uBlock Origin.

Figure 2.
The impact of open source ad blockers on the Yahoo.com website: (a) no ad block, (b) AdBlock+, (c) Privacy Badger, and (d) uBlock Origin.
Figure 2.
The impact of open source ad blockers on the Yahoo.com website: (a) no ad block, (b) AdBlock+, (c) Privacy Badger, and (d) uBlock Origin.


Table 1.
Analyzed websites and their classification.
| Website | Classification |
|---|---|
| google.com | Web search |
| yahoo.com | |
| bing.com | |
| wikipedia.org | Information |
| weather.com | |
| cnn.com | News |
| foxnews.com | |
| nytimes.com | |
| sohu.com | Chinese search/gaming |
| taobao.com | Chinese e-commerce |
Table 2.
Average page load times (in seconds) for no ad block, AdBlock+, Privacy Badger, and uBlock Origin as well as the percent of saved load time for each open source ad blocker.
Table 2.
Average page load times (in seconds) for no ad block, AdBlock+, Privacy Badger, and uBlock Origin as well as the percent of saved load time for each open source ad blocker.
| Website | Use of Ad Blocker | |||||||
|---|---|---|---|---|---|---|---|---|
| None | AdBlock+ | AdBlock+ Percent | Privacy Badger | Badger Percent | uBlock Origin | uBlock Origin Percent | ||
| 1 | google.com | 0.997 | 0.962 | 3.5% | 0.9476 | 5.0% | 0.9889 | 0.8% |
| 2 | yahoo.com | 2.359 | 2.696 | −14.3% | 1.92 | 18.6% | 1.343 | 43.1% |
| 3 | bing.com | 0.799 | 0.532 | 33.4% | 0.5404 | 32.3% | 0.5402 | 32.3% |
| 4 | wikipedia.org | 2.294 | 2.260 | 1.5% | 2.11 | 8.0% | 2.498 | −8.9% |
| 5 | weather.com | 1.491 | 0.993 | 33.4% | 0.9029 | 39.4% | 0.8561 | 42.6% |
| 6 | cnn.com | 3.258 | 3.347 | −2.7% | 2.678 | 17.8% | 2.514 | 22.8% |
| 7 | foxnews.com | 5.647 | 5.550 | 1.7% | 3.776 | 33.1% | 3.602 | 36.2% |
| 8 | nytimes.com | 3.683 | 3.600 | 2.3% | 2.322 | 37.0% | 2.658 | 27.8% |
| 9 | sohu.com | 16.920 | 8.960 | 47.0% | 13.68 | 19.1% | 4.01 | 76.3% |
| 10 | taobao.com | 1.970 | 1.890 | 4.1% | 1.75 | 11.2% | 1.74 | 11.7% |
| Average | 3.942 | 3.079 | 11.0% | 3.063 | 22.2% | 2.075 | 28.5% | |
| SD | 4.779 | 2.551 | 19.7% | 3.850 | 12.5% | 1.176 | 24.2% | |
Table 3.
Average time per year saved per person who uses the web in the world and the United States if AdBlock+, Privacy Badger, and uBlock Origin were used.
Table 3.
Average time per year saved per person who uses the web in the world and the United States if AdBlock+, Privacy Badger, and uBlock Origin were used.
| t (Globe) [Hours/Year] | t (USA) [Hours/Year] | |
|---|---|---|
| AdBlock+ | 38.9 | 37.7 |
| Privacy Badger | 78.4 | 76.1 |
| uBlock Origin | 100.7 | 97.7 |
Table 4.
Electrical energy conserved and consumer electric bill savings per year from the use of open source ad blockers in the world and the United States during rapid Internet use for AdBlock+, Privacy Badger, and uBlock Origin.
Table 4.
Electrical energy conserved and consumer electric bill savings per year from the use of open source ad blockers in the world and the United States during rapid Internet use for AdBlock+, Privacy Badger, and uBlock Origin.
| Ey(Globe) [kWh/year] | Sy(Globe) [USD/year] | Ey(USA) [kWh/year] | Sy(USA) [USD/year] | |
|---|---|---|---|---|
| AdBlock+ | 5.20 × 10⁹ | 728,300,000 | 3.58 × 10⁸ | 45,432,000 |
| Privacy Badger | 1.05 × 10¹⁰ | 1,469,800,000 | 7.23 × 10⁸ | 91,690,000 |
| uBlock Origin | 1.35 × 10¹⁰ | 1,886,960,000 | 9.28 × 10⁸ | 117,710,000 |
© 2020 by the author. Licensee MDPI, Basel, Switzerland. This article is an open access article distributed under the terms and conditions of the Creative Commons Attribution (CC BY) license (http://creativecommons.org/licenses/by/4.0/).
Share and Cite
MDPI and ACS Style
Pearce, J.M. Energy Conservation with Open Source Ad Blockers. Technologies 2020, 8, 18. https://0-doi-org.brum.beds.ac.uk/10.3390/technologies8020018
AMA Style
Pearce JM. Energy Conservation with Open Source Ad Blockers. Technologies. 2020; 8(2):18. https://0-doi-org.brum.beds.ac.uk/10.3390/technologies8020018
Chicago/Turabian StylePearce, Joshua M. 2020. "Energy Conservation with Open Source Ad Blockers" Technologies 8, no. 2: 18. https://0-doi-org.brum.beds.ac.uk/10.3390/technologies8020018
Note that from the first issue of 2016, this journal uses article numbers instead of page numbers. See further details here.