Article

Ergot Alkaloids at Doses Close to EU Regulatory Limits Induce Alterations of the Liver and Intestine

by
Viviane Mayumi Maruo
1,4,
Ana Paula Bracarense
2,
Jean-Paul Metayer
3,
Maria Vilarino
3,
Isabelle P. Oswald
4,* and
Philippe Pinton
4
1
Universidade Federal do Tocantins, Araguaína 77824-838, Brazil
2
Laboratory of Animal Pathology, Universidade Estadual de Londrina, Londrina 86057-970, Brazil
3
ARVALIS-Institut du Végétal, Station expérimentale, 41100 Villerable, France
4
Toxalim (Research Centre in Food Toxicology), Université de Toulouse, INRA, ENVT, INP-Purpan, UPS, 31027 Toulouse, France
*
Author to whom correspondence should be addressed.
Submission received: 21 March 2018 / Revised: 7 April 2018 / Accepted: 17 April 2018 / Published: 1 May 2018
(This article belongs to the Special Issue Effects of Mycotoxins on the Intestine)

Abstract

:
An increase in the occurrence of ergot alkaloids (EAs) contamination has been observed in North America and Europe in recent years. These toxins are well known for their effects on the circulatory and nervous systems. The aim of this study was to investigate the effect of EAs on the liver and on the intestine using the pig both as a target species and as a non-rodent model for human. Three groups of 24 weaned piglets were exposed for 28 days to control feed or feed contaminated with 1.2 or 2.5 g of sclerotia/kg, i.e., at doses close to EU regulatory limits. Contaminated diets significantly reduced feed intake and consequently growth performance. In the liver, alteration of the tissue, including development of inflammatory infiltrates, vacuolization, apoptosis and necrosis of hepatocytes as well as presence of enlarged hepatocytes (megalocytes) were observed. In the jejunum, EAs reduced villi height and increased damage to the epithelium, reduced the number of mucus-producing cells and upregulated mRNA coding for different tight junction proteins such as claudins 3 and 4. In conclusion, in term of animal health, our data indicate that feed contaminated at the regulatory limits induces lesions in liver and intestine suggesting that this limit should be lowered for pigs. In term of human health, we establish a lowest observed adverse effect level (LOAEL) of 100 μg/kg body weight (bw) per day, lower than the benchmark dose limit (BMDL) retained by European Food Safety Authority (EFSA) to set the tolerable daily intake, suggesting also that regulatory limit should be revised.
Key Contribution: In term of pig, our data indicate that feed contaminated at the regulatory limits (1 g sclerotia/kg) induces liver and intestine suggesting that the limit should be lowered. In term of human health; the present experiment established a LOAEL of 100 μg EAs/kg bw per day; lower than the BMDL associated with a 10% response of 330 μg/kg bw per day retained by EFSA to set the tolerable daily intake.

1. Introduction

Ergot is a parasitic fungus that belongs to the Claviceps genus. It forms on various grains and grasses a dark mass of mycelium called sclerotia producing toxic secondary metabolites, the ergot alkaloids (EAs). These mycotoxins gained notoriety in the Middle Ages because of mass poisonings in Europe, characterized by gangrene and convulsions [1].
More than 50 different EAs have been identified so far. The main EAs produced by Claviceps species are ergometrine, ergotamine, ergosine, ergocristine, ergocryptine and ergocornine. Their toxicity is linked to their structural similarity with dopamine, noradrenaline, adrenaline and serotonin, enabling binding to the biogenic amine receptor and the interruption of neurotransmission [2]. Typical clinical symptoms of ergot poisoning are vasoconstriction, which may progress into gangrene, disruption of reproduction, abortion, neurotoxic signs including feed refusal, dizziness and convulsions, agalactia and adverse effects to the cardiovascular system [1,3,4,5]. Although acute poising has become rare, EAs are still a source of concern because they continue to be detected in cereals and cereal products in Europe and North America [6,7]. Moreover, the occurrence of Claviceps purpurea (C. purpurea) infections has been increasing in the last few years [8,9,10,11].
Currently, regulations are based on the quantities of ergot sclerotia. Codex Alimentarius established maximum levels for sclerotia of C. purpurea in wheat and durum wheat intended for processing for human consumption at 0.5 g/kg and 5 g/kg, respectively [12]. In animal feed, the European Commission fixed the maximum content at 1 g/kg of feed stuff containing unground cereals [13]. Recently, the EFSA Panel on Contaminants in the Food Chain conducted a risk assessment and proposed a tolerable daily intake (TDI) of 0.6 μg total EA/kg body weight (bw) per day [1] for humans.
The aim of this study was to investigate the effects of ingestion of EA-contaminated feed at concentrations close to the regulatory limits. We chose to perform the experiment in pigs as they may be exposed to EAs. In addition, they represent a choice species as a biomedical model for human toxicology, due to their similarities in anatomy, genetics and pathophysiology [14].
We mainly focused on the effects of EAs on the intestine and the liver. The intestine is of particular importance since it represents the first barrier against food contaminants and foreign antigens. The jejunum is one of the major intestinal sites of absorption, including the absorption of toxins. Intestinal epithelium integrity plays a critical role in the maintenance of the physical and immune barrier that is achieved by an ensemble of well-organized structural and secretory components including tight junctions, mucus and cytokines [15]. Most of the metabolization processes for xenobiotics, including mycotoxins, occur in the liver [16]. The metabolizing enzymes of the cytochrome P450 family are involved in and induced by ergot metabolism [17]. Moreover, certain hepatic enzymatic activities were found to be inhibited by ergotamine and ergometrine [18]. Reports in the literature on the effects of ergot on the intestine and the liver are rare, especially concerning biochemical and morphological parameters.

2. Results

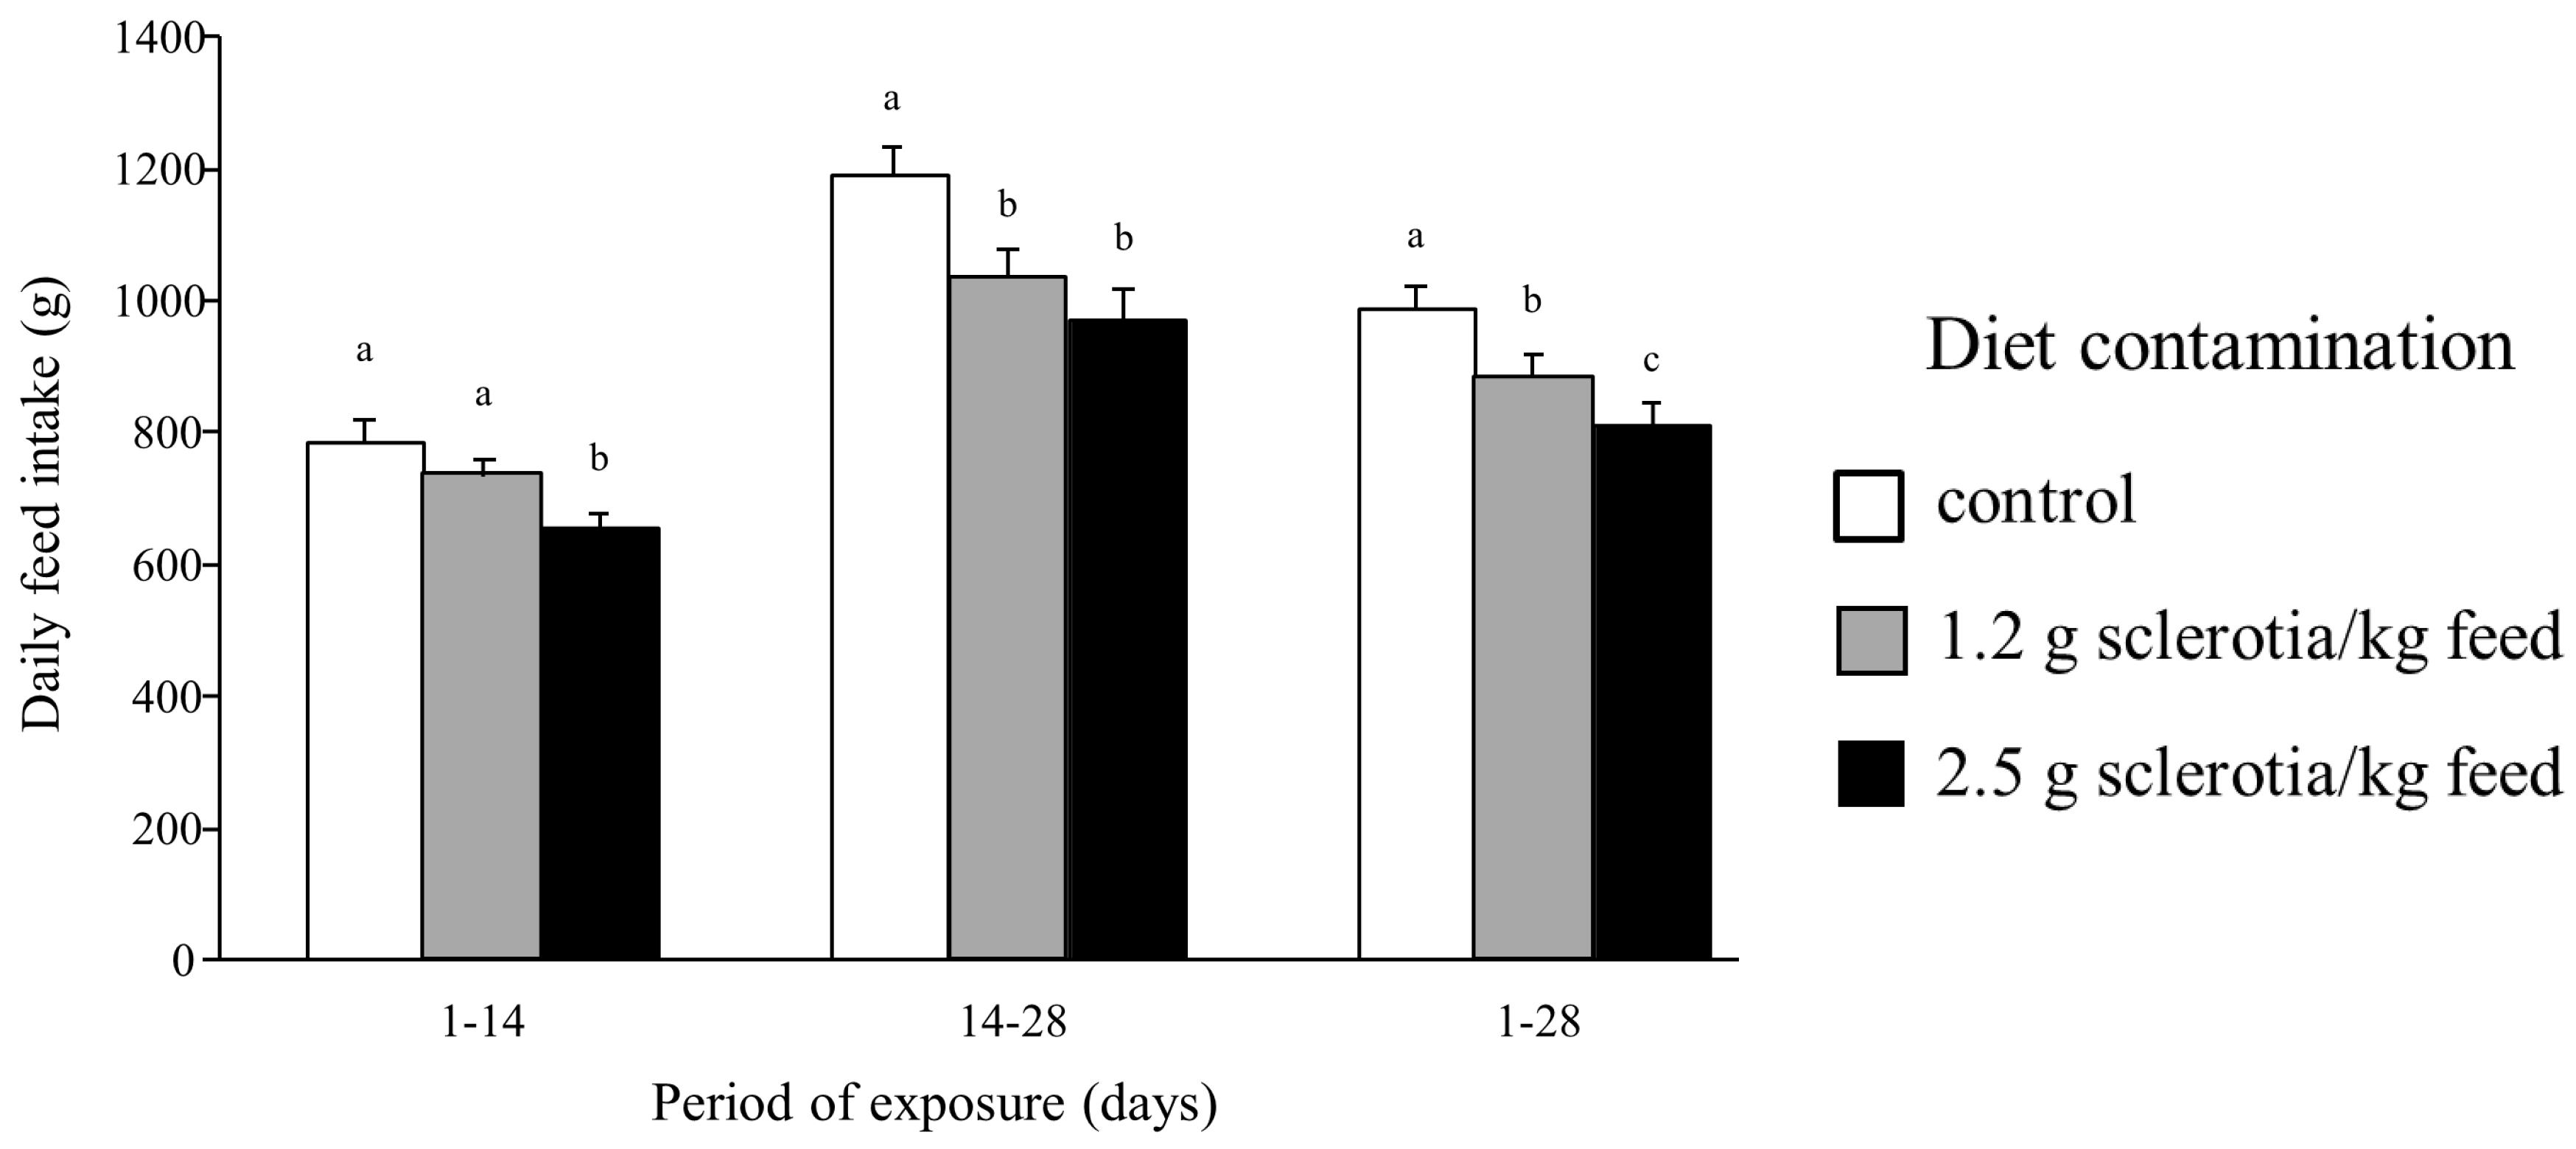
2.1. Effects of Ergot Alkaloids on Clinical Signs, Growth and Feed Intake

The effects of ergot were first investigated in pigs exposed for 28 days at doses of 1.2 and 2.5 g sclerotia/kg feed, which are just above the European regulatory limit. When assessing clinical signs, no typical symptoms of acute toxicity, such as convulsions or muscle spasms, or necrosis of the extremities were observed. Similarly, no vomiting or fever was observed in animals exposed to ergot.
The effects of ergot on feed intake were already detected the second week in animal exposed to the highest dose. For animals exposed to the lower dose of ergot, this reduction only appeared in the last 14 days of treatment (Figure 1). During the experimental period, the daily feed intake of animals exposed to the higher dose of ergot was reduced by about 18% in comparison with control group (Figure 1). Taking into account the whole period of treatment, the daily feed intake was significantly reduced as a function of ergot content (Figure 1).
The reduction in feed ingestion led to a decrease of animal weight gain that was significant in the group exposed to the higher dose of EA (data not shown).

2.2. Effects of Ergot Alkaloids on Hematology and Blood Chemistry

Hematology and serum biochemical analysis were performed at the end of the experiment. When animals were exposed to ergot, the percentage of neutrophils was reduced and the decrease was significant in the group exposed to the lower dose (Table 1). The percentage of lymphocytes also increased in animals exposed to ergot, with a significant difference in animals exposed to the higher dose (Table 1).
Biochemical analysis revealed a significant dose-dependent reduction in the levels of creatine kinase in animals exposed to ergot. In addition, the level of cholesterol decreased and that of glucose increased upon exposure to ergot (Table 2).

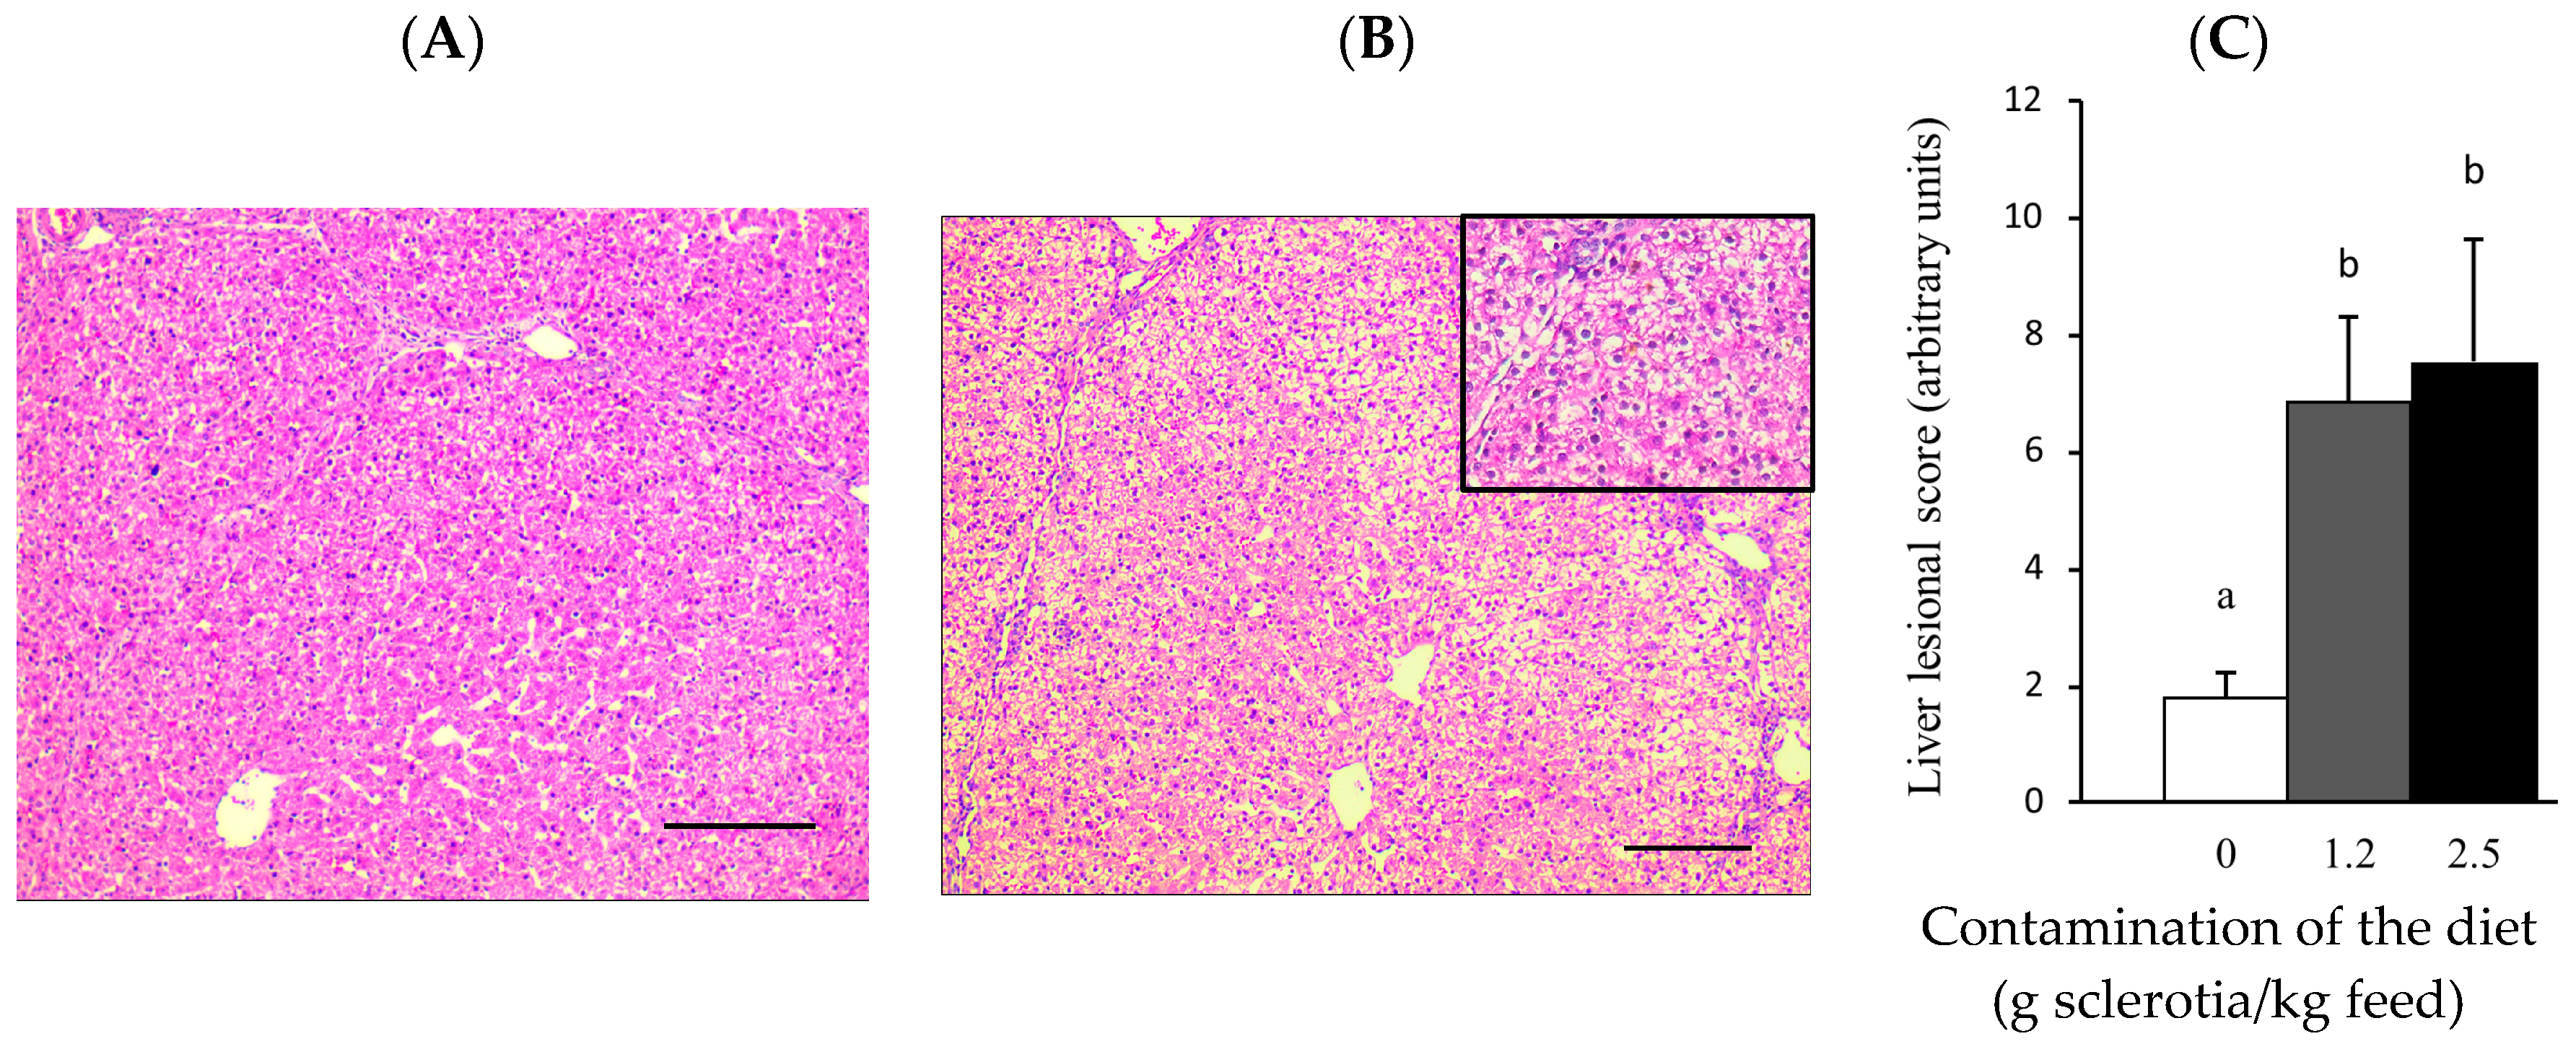
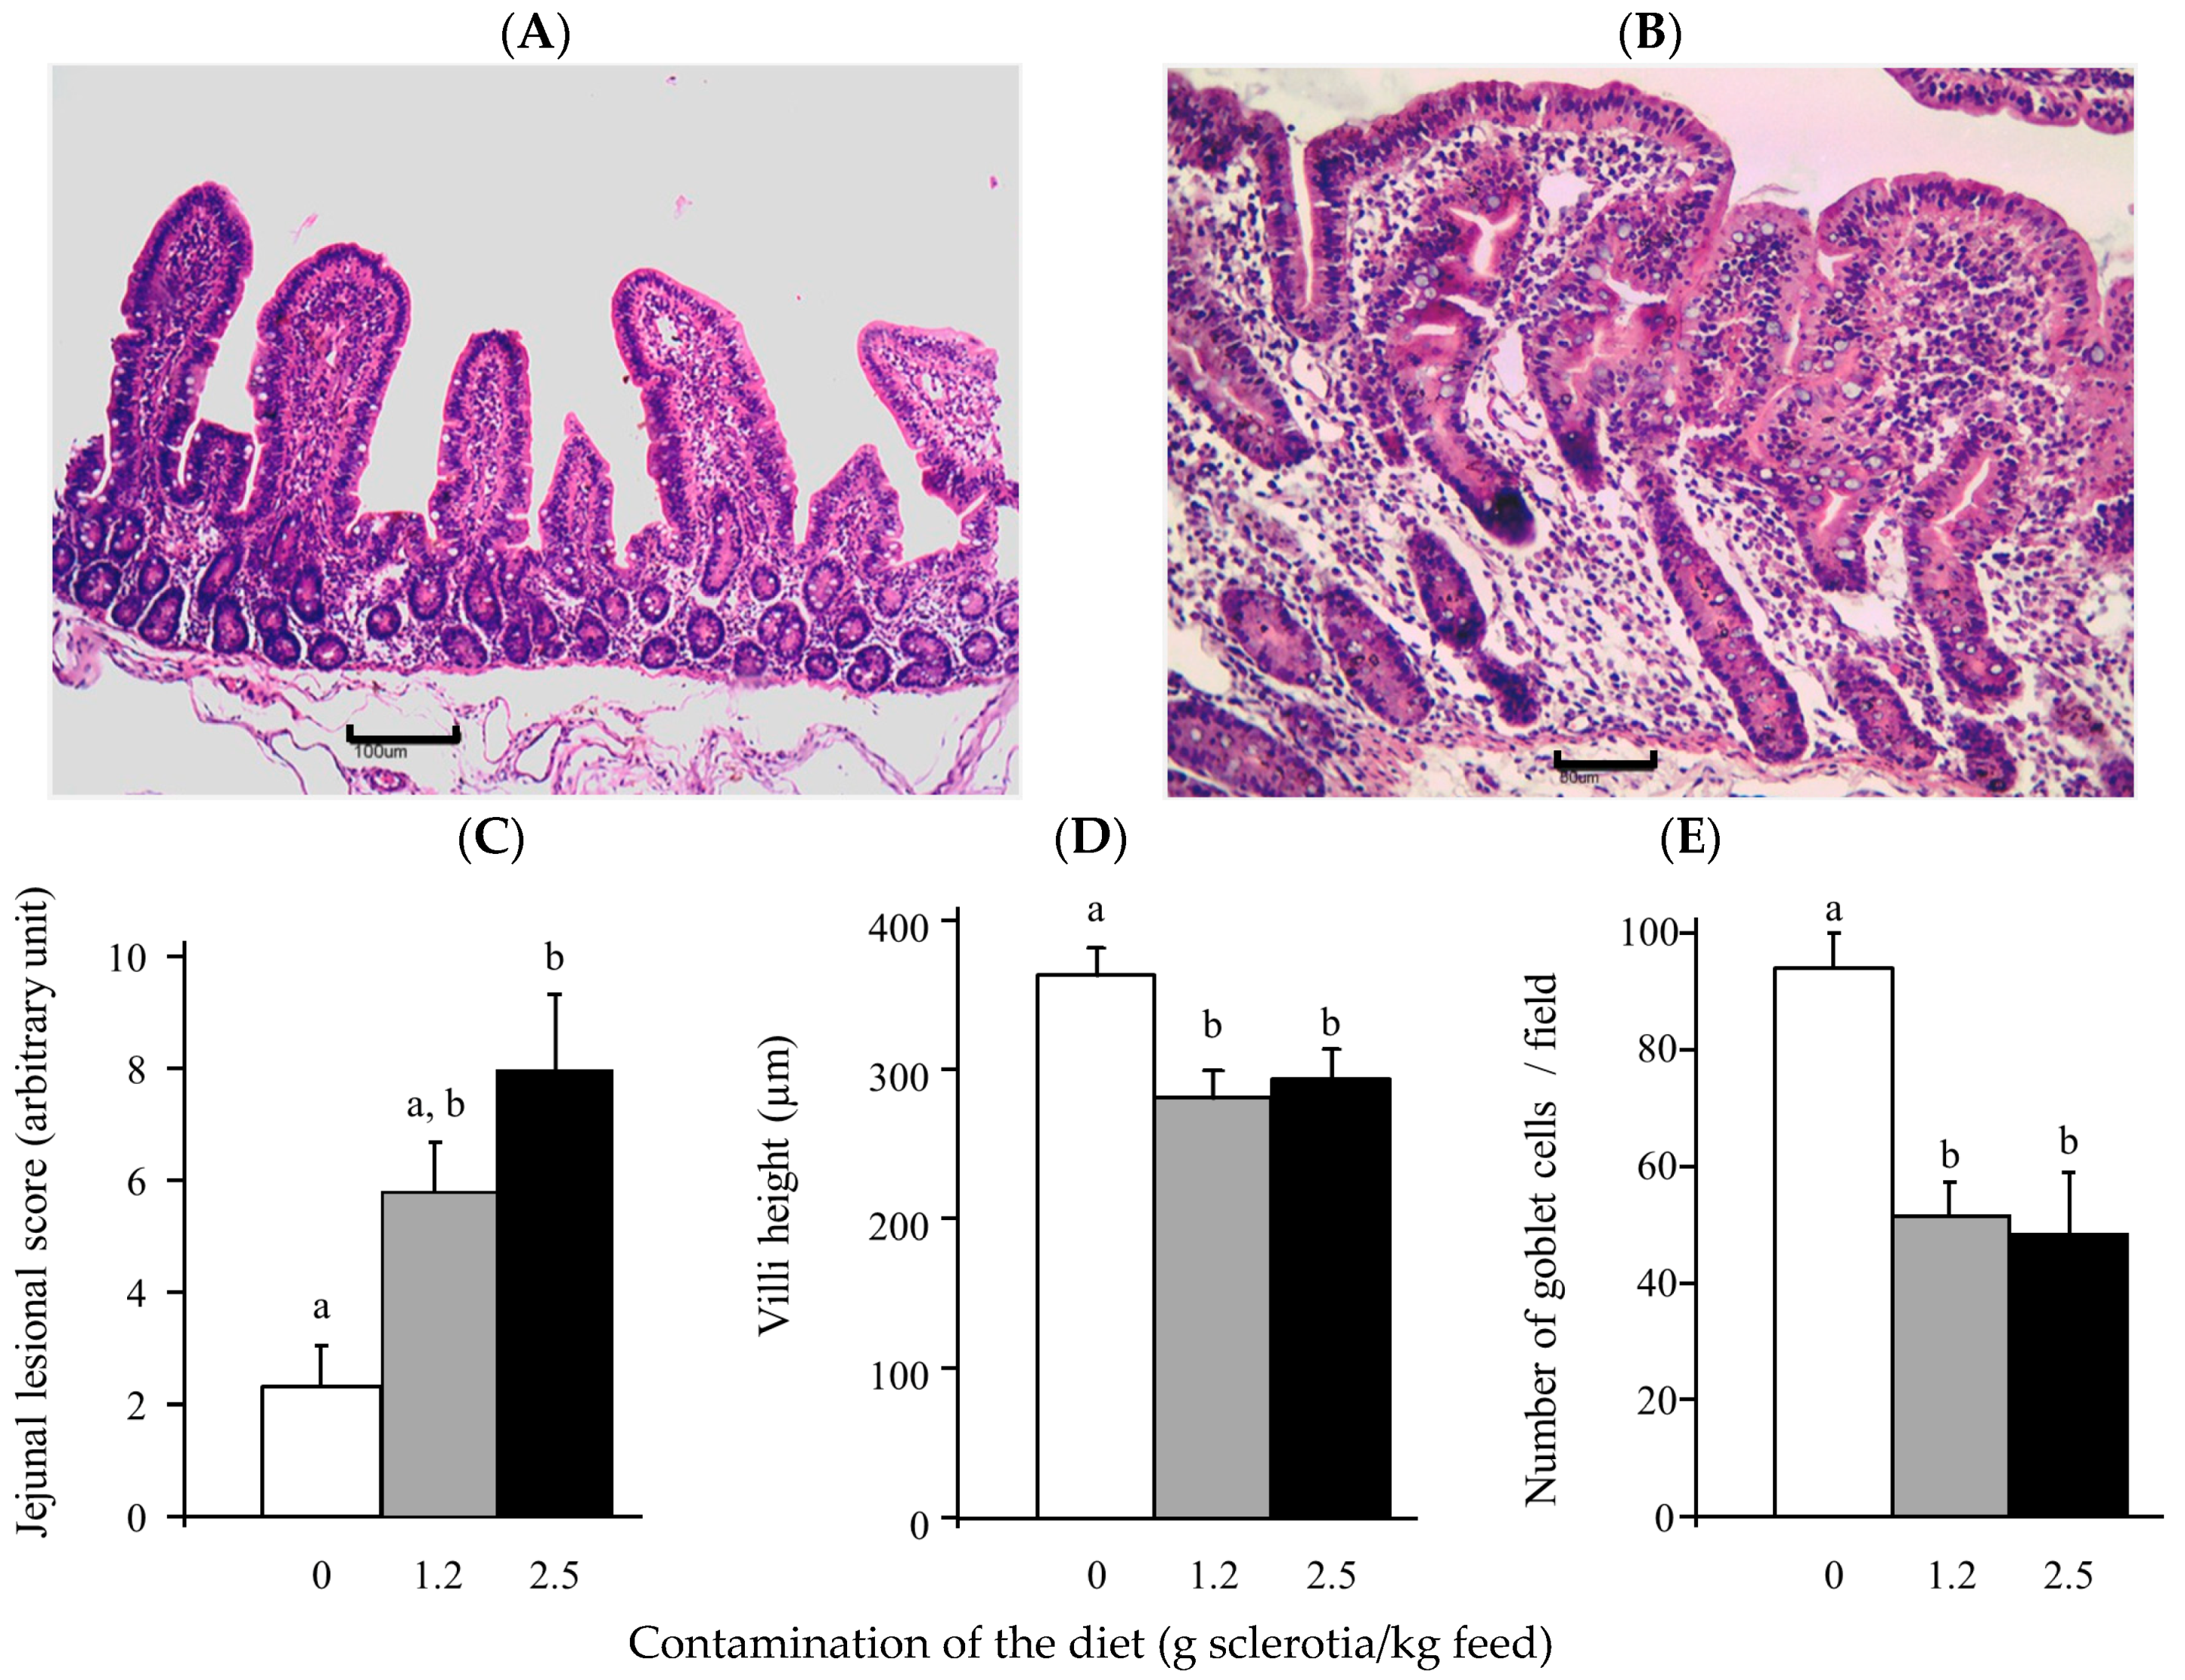
2.3. Alterations of Tissue Morphology Caused by Ergot Alkaloids

The effects of ergot on the liver and the intestine were investigated through histological analyses. Exposure to ergot led to mild to moderate lesions of the liver (Figure 2) and the jejunum (Figure 3) of pigs.
In the liver, tissue disorganization of hepatic cords, inflammation and vacuolation of hepatocytes, megalocytosis and necrosis were the main morphological alterations (Figure 2B). Furthermore, animals fed the contaminated diets presented a significant increase in the lesion liver score (Figure 2C).
The main histological changes observed in the jejunum were villi atrophy, edema of lamina propria and cytoplasmic vacuolation of enterocytes. As shown in Figure 3C, animals exposed to the higher dose of ergot displayed a significant increase of the lesion score in the jejunum compared to control animals (3.4 fold increase, p < 0.005). Morphometrical analysis revealed a significant decrease in villi height (1.2 fold decrease at both doses) (Figure 3D). The number of goblet cells decreased significantly in the jejunum (mean 1.6 fold decrease, p < 0. 001) of piglets exposed to ergot (Figure 3E). Similar effects were observed in jejunum areas with Peyer’s patches (data not shown).

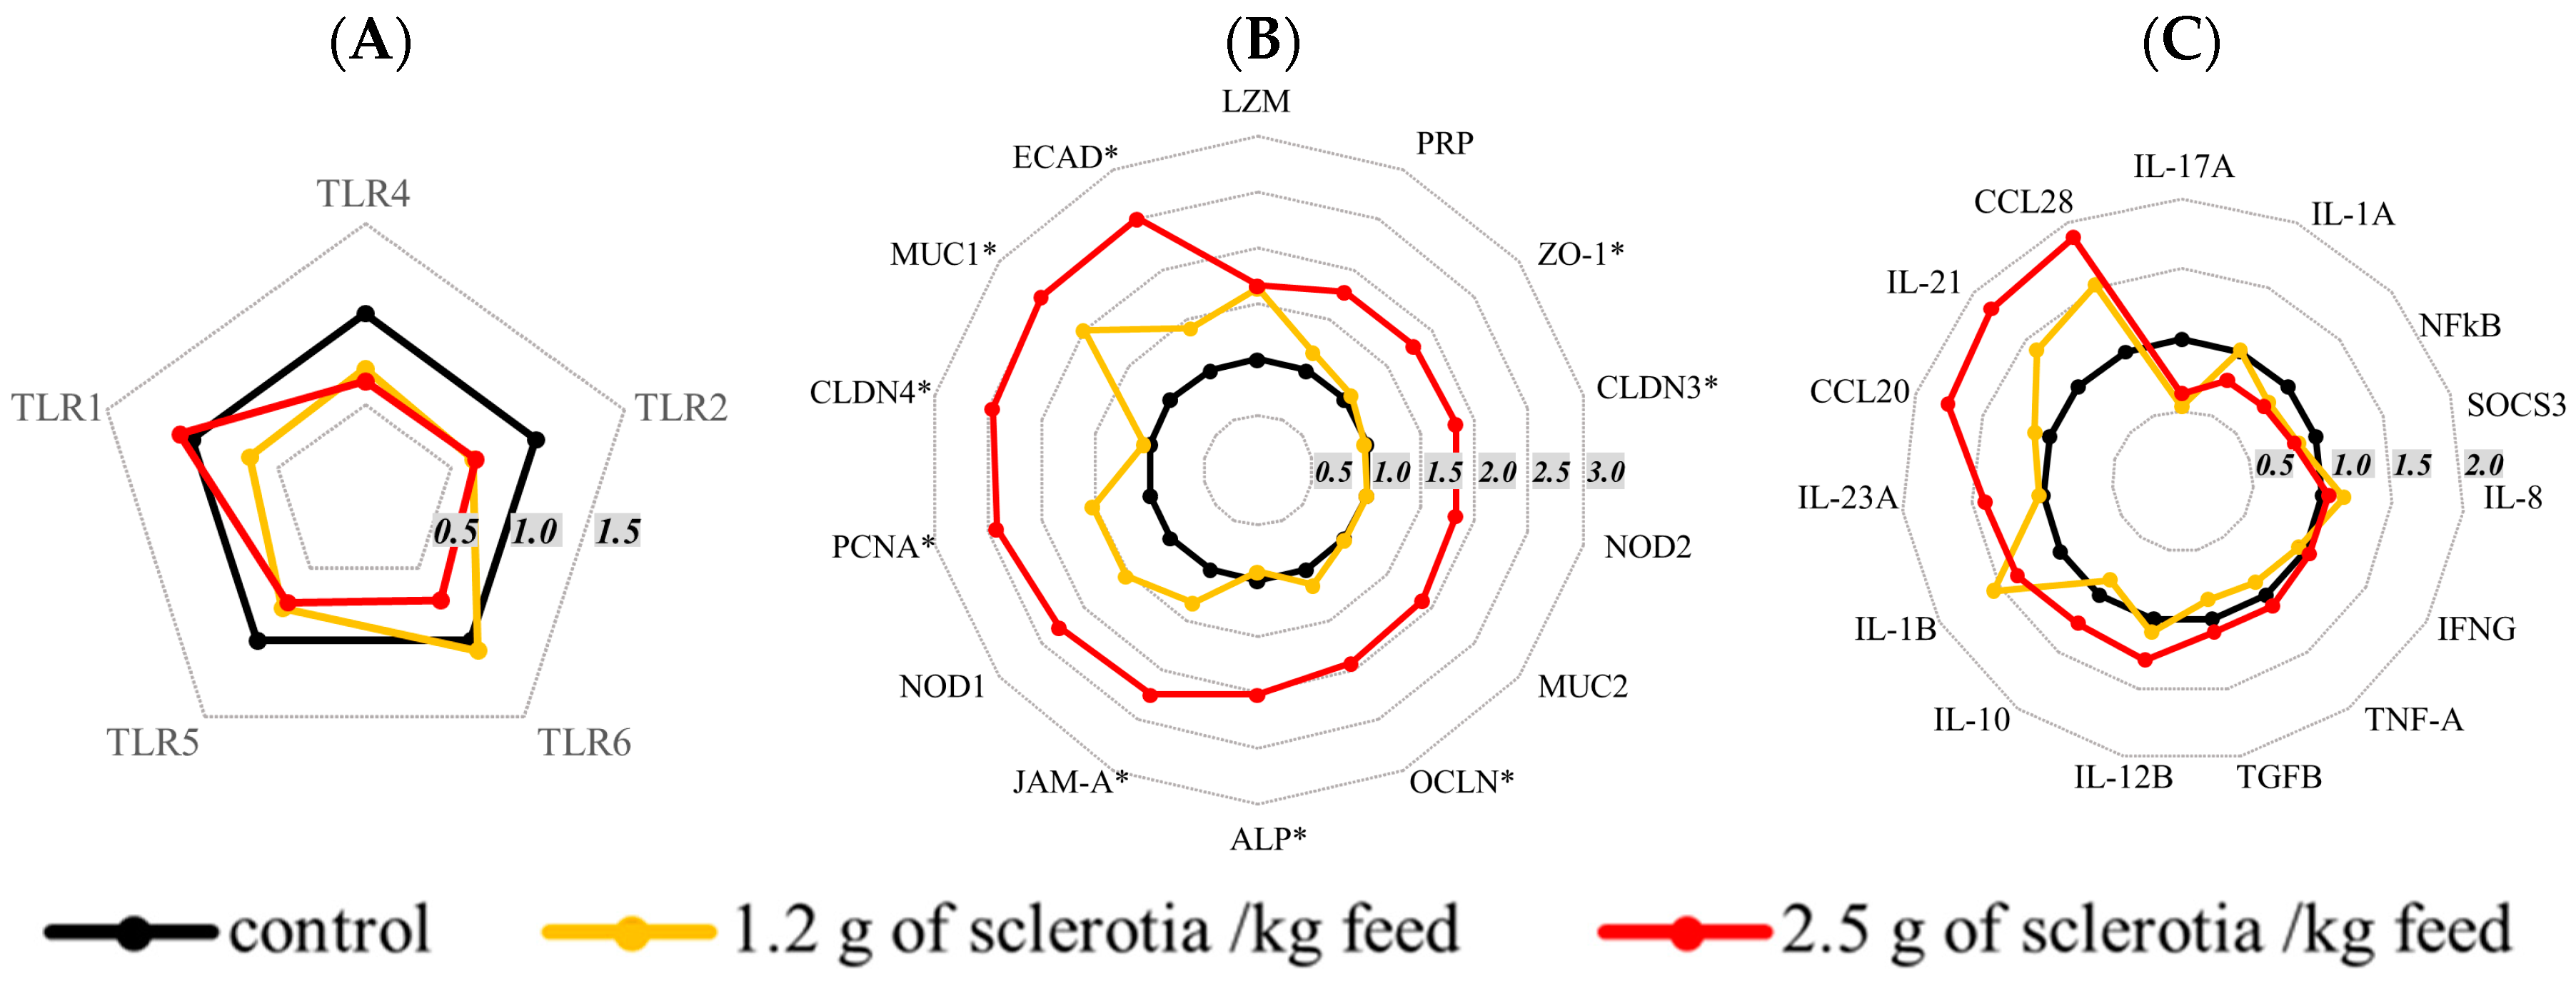
2.4. Effects of Ergot Alkaloids on mRNA Expression in the Jejunum

Given the lesions induced by ergot exposure in the jejunum and due to the lack of studies on the toxicity of EAs in this organ, the expression of 34 genes coding for junctional proteins, inflammatory and immunological mediators was evaluated by real-time-quantitative PCR (RT-qPCR) in the jejunum. The expression profile of mRNA expression of different toll-like receptors (TLR) and cytokines (TLR4, nuclear factor kappa B (NFkB), interleukin (IL)-6, IL-8, tumor necrosis factor-α (TNFA)) showed a tendency to downregulation. In animals exposed to the higher dose of ergot, analysis of mRNA expression of junctional proteins revealed a significant increase in claudin-3 (CLDN3), claudin-4 (CLDN4), occludin (OCLN), zonula occludens-1 (ZO-1), junctional adhesion molecule (JAM-A) and E-cadherin (ECAD) (Figure 4). The expression of genes coding for mucin-1 (MUC1), alkaline phosphatase (ALP) and proliferating cell nuclear antigen (PCNA) was also significantly increased. Altogether, the overexpression of the genes involved in maintaining the structure of the intestinal mucosa may reflect an attempt by the tissue to reestablish its function.

3. Discussion

The aim of this study was to investigate the effects of ingestion of EA-contaminated feed on the liver and intestine in pig. The levels of sclerotia in the feed were 1.2 g sclerotia or 2.4 mg total ergot alkaloids/kg. Using these concentrations that were close to the regulatory limits for 28 days, we observed not only effects on animal performances but also lesions in the liver and the intestine. This study shows that the regulation of 1 g sclerotia/kg of feed materials is probably not protective enough for pigs and deserves to be re-evaluated. In terms of human health, a LOAEL of 100 μg/kg bw per day could be established from the present data. This is lower than the BMDL associated with a 10% response of 330 μg/kg bw per day, which is set by EFSA as the tolerable daily intake for human. The present experiment thus provides evidence of the necessity to re-examine the current TDI for humans.
Considering the mean feed intake of these animals (1163 and 962 g/day after respectively, two and four weeks of exposure) and their mean weight (17.5 and 27.8 kg after respectively, two and four weeks of exposure), it represents an exposure to ergot alkaloids of 159 and 83 μg/kg bw per day after two and four weeks of exposure, respectively. The lowest observed adverse effect level (LOAEL) is lower than the benchmark dose limit (BMDL) associated with a 10% response of 330 μg/kg bw per day retained by EFSA to set the tolerable daily intake (TDI) of 0.6 μg/kg bw per day [1], based on the vasoconstrictive effects observed in a rat model exposed to ergotamine for 13 weeks [19]. Given the interspecies differences in the observed effects, pig could be considered as a relevant species for ergot alkaloids risk assessments. These data reinforce the need to increase the knowledge on the effects of EAs and suggest a revision of the TDI for EAs.
As already reported in other studies, we observed that the ingestion of EAs damages the zootechnical parameters as measured by feed intake and average daily gain [17,20]. Reduction of weight gain appears to be caused by the reduction in feed intake, which in turn may be explained by the action of the EAs on serotoninergic receptors in the gut, thereby affecting motility [2]. The composition and proportion of EAs in sclerotia can vary but the total EA content appears to be more important than the composition of EA for the alteration of animal performances [21].
The consumption of ergot also affected intestinal integrity, as revealed by histological and molecular analyses, and might have contributed to growth impairment of the animals. Histological and morphometric evaluation of the intestinal tissue revealed a sensitive endpoint for the evaluation of the effects of mycotoxin exposure. Modifications in villi height reflect changes in the balance between enterocyte proliferation and apoptosis. The increase in the lesion score and villi flattening in the intestine of animals exposed to EAs could be explained by their action on serotoninergic receptors present in epithelial intestinal cells, primary afferent neurons and secretor motor neurons of the intestine [22]. In addition to the action of EAs on the serotoninergic system, recent in vitro studies demonstrated that EAs also cause cytotoxicity and apoptosis in intestinal HT-29 and liver HepG2 cell lines, providing evidence for an intricate mode of action [23]. Additionally, the number of goblet cells was reduced in animals exposed to EAs, revealing impairment in the intestinal barrier function [15,24]. Taken together, these alterations could lead to a compensatory upregulation of mRNA levels of CLDN3, CLDN4, OCLN, ZO-1, JAM-A, ECAD, ALP and PCNA, as already described in the intestine of mice [25] or in intestinal epithelial cells exposed to deoxynivalenol [26]. Immunoregulatory mechanisms in the intestine play a crucial role in the defense of the organism [27]. The pattern recognition receptors (PRR) are membrane-bound receptors that specifically bind to pathogen-associated molecular patterns (PAMPs) shared by various microorganisms. PRR are highly expressed in the jejunum and ileum of pigs and trigger an inflammatory response, involving the activation of myeloid differentiation 88 and NFkB [28]. In the present work, mRNA expression of TLR-1 2, 4, 5 and 6 as well as TNF-A, IL-1A, IL-8 and IFNG tended to be downregulated in the jejunum of animals exposed to EAs. This could reduce tolerance to commensal microbiota and the organism’s ability to trigger inflammation response against pathogens, thereby increasing susceptibility to infections [29].
Besides the action of EAs on the intestine, their effects were also studied on the liver where tissue disorganization, inflammation and necrosis were observed and assessed by a significant increase of the lesion liver score. We observed that the consumption of EA-contaminated feed affected the levels of cholesterol, glucose and creatine kinase, parameters correlated with adiposity and muscle growth [30]. Hypocholesterolemia could correlate with the malabsorption of nutrients as well as with an altered lipid metabolism that often accompanies hepatic disease [31]. Glucose levels were elevated in the group that received the higher ergot content. In the post-absorptive phase, glucose is transported from its site of uptake in the gut to the sites of glycogen storage, principally the liver and muscles [32]. The increase in glucose level indicates glycogen mobilization from the storage sites to provide energy to the organism. In the present study, the morphological changes observed in hepatocytes could be associated with functional alterations such as lipid metabolism and glycogen storage. The reduction in creatine kinase may indicate hypoplasia, atrophy or the mild destruction of skeletal muscles [31,32]. EAs induce vasoconstriction through binding with serotoninergic receptors in the smooth muscle cells of vessels walls [5]. Therefore, an association between a relative ischemia and changes in creatine kinase could be hypothesized. In short, the biochemical alterations observed in animals exposed to ergot could be correlated to liver and mild muscle lesions [30].

4. Conclusions

The contamination of cereals by EAs has recently been shown to be increasing in different countries and is a source of concern for human and animal health. This study confirmed that EA reduces the performances of pigs, and demonstrated that EAs provoke hepatotoxicity, as revealed by deleterious effects on tissue morphology, and mild biochemical alterations. Moreover, EA alters the intestinal epithelium, reduces the number of goblet cells and modulates the expression of genes involved in immune response and barrier function. This suggests that ingestion of EA-contaminated feed may alter the intestinal barrier function, predisposing animals to enteric infections and potentially causing hepatotoxicity.
From the point of view of pig health, our data indicate that feed contaminated at the regulatory limits induces deleterious effects in the liver and intestine in pigs, suggesting that the regulatory limit is not adequately protective. From the point of view of human health, this study reveals the sensitivity of pigs to EAs with a LOAEL lower than the BMDL obtained in rats, which is employed by EFSA to set the tolerable daily intake for human. The present data should be considered in a further assessment of human risk of exposure to EAs.

5. Materials and Methods

5.1. Experimental Diets

Experimental diets, based on wheat, corn and soybean and formulated according to the CORPEN (1996) norms are detailed in Table 3. Two batches of sclerotia obtained from contaminated wheat were used to prepare the contaminated diets. Levels of sclerotia of 0 (control), 1.2 g/kg (dose 1) and 2.5 g/kg (dose 2) were used, the first dose being close to the regulatory limit of 1 g/kg [13].

5.2. Ergot Alkaloid Composition of the Diets

The quantities of EAs were determined by liquid chromatography coupled with a tandem mass spectrometry (LC/MS/MS) (TSQ Quantum Ultra, ThermoFisher Scientific, Villebon sur Yvette, France) at Qualtech laboratory (Vandœuvre, France).
After preparation, diets were analyzed four times and the mean EA concentrations were 2.36 and 5.05 mg/kg, for diets with ergot dose 1 and 2, respectively. The most abundant alkaloid was ergotamine, followed by ergosine, ergocristine and their corresponding-inine epimers (Table 4). The amount of the-ine isomers was approximately two-thirds of total alkaloids.
Contamination with other mycotoxins was investigated. Deoxynivalenol was naturally present in the wheat (19 μg/kg) and corn (171 μg/kg) but at an insignificant rate. Other mycotoxins, including DON acetylated, nivalenol, T2, HT-2, zearalenone and fumonisin were below the detection limit.

5.3. Animals

Animal experiments were carried out at ARVALIS—Institut du végétal facility (Villerable, France) in accordance with the guidelines for protection of animals used for scientific purposes issued by French Ministry of Higher Education and Research. Seventy-two castrated, 21 day-old crossbreed (P76 X Naïma) piglets (mean weight 10.7 ± 0.9 kg) were housed in the facility with free access to control starter feed and water. When they were 34 days old, they were housed in individual pens and assigned to three groups of 12 males and 12 females one group fed the control diet, another ergot dose 1 and the third ergot dose 2 diet. At the end of the experiment (62 days old) their mean weight was 27.9 ± 3.8 kg, 27.8 ± 2.6 kg, 25.6 ± 3.1 kg in the control group, ergot dose 1 and ergot dose 2 diet groups, respectively.

5.4. Experimental Setting and Sample Collection

Animals received experimental diets for a period of 28 days. Weight and consumption were measured on the first day of the experiment, 14 days later and on the last day of the experiment. The animals were observed daily to detect possible signs of ergot intoxication such as balance disorders or necrosis of the extremities.
At the end of the experiment, blood samples were taken from the external jugular vein of all the animals for biochemical and hematological analyses. In addition, six male animals in each group were euthanized and liver, jejunum and jejunum with Peyer’s patches were sampled in 10% buffered formalin (Sigma, Saint-Quentin Fallavier, France) for histopathological analysis or immediately quick-frozen in liquid nitrogen and stored at −80 °C until RNA extraction [33].

5.5. Hematology and Blood Chemistry

Hematological parameters (white and red blood cells, hemoglobin and platelets) were analyzed at Medibiolab (Vendome, France), with a Sysmex XT2000i automated hematology analyzer (Sysmex, Villepinte, France). Serum biochemistry was determined with a Pentra 400 Clinical Chemistry benchtop analyzer (Horiba, Les Ulis, France) at GenoToul-Anexplo platform (Toulouse, France).

5.6. Histomorphometrical Analysis

Formalin-fixed tissue samples were dehydrated in ethanol and embedded in paraffin wax. Sections (3 μm) were stained with hematoxylin-eosin (HE, Sigma) for histopathological analysis. A lesion score per animal was established by taking into account the severity of the lesion and its extent (intensity or observed frequency; scored from 0 to 3) as described previously [34]. Morphometry was evaluated in the jejunum by measuring the height of 30 randomly chosen villi using a MOTIC Image Plus 2.0 ML 1 image analysis system (Richmond, Canada, 2003), as described previously. In addition, Schiff’s periodic acid stain was used to evaluate goblet cell density (five fields/slide, objective 20×) [35].

5.7. Expression of mRNA by Real-Time PCR

Intestinal tissue was processed in lysing matrix D tubes (MP Biomedicals, Illkirch, France) containing Extract-All (Eurobio, Les Ulis, France) in a Fast-Prep FP120 instrument (MP Biomedicals) as described previously [36,37]. The concentrations and purity of RNA were determined using a Nanodrop nd1000 instrument (Labtech International, Paris, France). Total RNA samples were reverse-transcribed using a High Capacity cDNA-RT kit (Life Technologies, Saint Aubin, France). RT-qPCR was performed in 384-well plates in a ViiA 7 thermocycler (Life Technologies, Saint Aubin, France) as described previously [38]. All reactions were performed in duplicate and averages were used for further analysis. Primers for the real-time quantitative PCR are presented in Table 5. Among the different internal reference genes tested were Beta-2-microglobulin (B2M), peptidylprolyl isomerase A (PPIA—cyclophilin A) and ribosomal protein L32 (RPL32); the latter were selected for their stability of expression assessed with the NormFinder program [39]. Data from qPCR were analyzed with the LinRegPCR 2016. 2 program [40], enabling the determination of the starting concentrations (N0).

5.8. Statistical Analysis

The zootechnical parameters (daily feed intake and average weight gain) were measured on 24 piglets per group, and the differences in variance analysis were assessed with the Newman et Keuls post hoc test.
Histological data were measured on 6 animals per group and statistically analyzed by the free software Action 2.3 (Estatcamp, Campinas, SP, Brazil, 2003) using normality (Shapiro-Wilk’s test) and homogeneity (Bartlett) tests. When these two assumptions were met, the lesional score, the intestinal morphometry and the number of goblet cells were analyzed by ANOVA followed by Tukey’s test. For gene expression, quantification by qPCR and statistical analysis, the mRNA expression of target genes was normalized to the expressed housekeeping genes using REST© 2009 software (Qiagen, Valencia, CA, USA) which uses the pair-wise fixed reallocation randomization test as statistical model [44]. P values below 0.05 (p ≤ 0.05) were considered significant.

Author Contributions

J.-P.M., M.V., P.P. and I.P.O. supervised the study and the design of the experiments. V.M.M., J.-P.M., A.P.B. and P.P. performed the experiments and analyzed the data. V.M.M., A.P.B., I.P.O., P.P. wrote the paper.

Acknowledgments

The authors are grateful to A.M. Cossalter and J. Laffitte (INRA Toxalim) for sample collection and to Y. Lippi (TRiX Facility, INRA Toxalim) for assistance in PCR data handling.

Conflicts of Interest

The authors declare no conflict of interest.

References

  1. EFSA. Scientific opinion on ergot alkaloids in food and feed. EFSA J. 2012, 10, 2798. [Google Scholar]
  2. Klotz, J.L. Activities and effects of ergot alkaloids on livestock physiology and production. Toxins 2015, 7, 2801–2821. [Google Scholar] [CrossRef] [PubMed]
  3. Canty, M.J.; Fogarty, U.; Sheridan, M.K.; Ensley, S.M.; Schrunk, D.E.; More, S.J. Ergot alkaloid intoxication in perennial ryegrass (Lolium perenne): An emerging animal health concern in Ireland? Ir. Vet. J. 2014, 67, 21. [Google Scholar] [CrossRef] [PubMed]
  4. Korn, A.K.; Gross, M.; Usleber, E.; Thom, N.; Köhler, K.; Erhardt, G. Dietary ergot alkaloids as a possible cause of tail necrosis in rabbits. Mycotoxin Res. 2014, 30, 241–250. [Google Scholar] [CrossRef] [PubMed]
  5. Strickland, J.R.; Looper, M.L.; Matthews, J.C.; Rosenkrans, C.F., Jr.; Flythe, M.D.; Brown, K.R. Board-invited review: St. Anthony’s Fire in livestock: Causes, mechanisms, and potential solutions. J. Anim. Sci. 2011, 89, 1603–1626. [Google Scholar] [CrossRef] [PubMed]
  6. Di Mavungu, J.D.; Malysheva, S.V.; Sanders, M.; Larionova, D.; Robbens, J.; Dubruel, P.; Van Peteghem, C.; De Saeger, S. Development and validation of a new LC-MS/MS method for the simultaneous determination of six major ergot alkaloids and their corresponding epimers. Application to some food and feed commodities. Food Chem. 2012, 135, 292–303. [Google Scholar] [CrossRef]
  7. Scott, P. Ergot alkaloids: Extent of human and animal exposure. World Mycotoxin J. 2009, 2, 141–149. [Google Scholar] [CrossRef]
  8. Krska, R.; Crews, C. Significance, chemistry and determination of ergot alkaloids: A review. Food Addit. Contam. Part A Chem. Anal. Control Expo. Risk Assess. 2008, 25, 722–731. [Google Scholar] [CrossRef] [PubMed]
  9. Tittlemier, S.A.; Drul, D.; Roscoe, M.; McKendry, T. Occurrence of Ergot and Ergot Alkaloids in Western Canadian Wheat and Other Cereals. J. Agric. Food Chem. 2015, 63, 6644–6650. [Google Scholar] [CrossRef] [PubMed]
  10. Topi, D.; Jakovac-Strajn, B.; Pavsic-Vrtac, K.; Tavcar-Kalcher, G. Occurrence of ergot alkaloids in wheat from Albania. Food Addit. Contam. Part A Chem. Anal. Control. Expo. Risk Assess. 2017, 34, 1333–1343. [Google Scholar] [CrossRef] [PubMed]
  11. Orlando, B.; Maumené, C.; Piraux, F. Ergot and ergot alkaloids in French cereals: Occurrence, pattern and agronomic practices for managing the risk. World Mycotoxin J. 2017, 10, 327–338. [Google Scholar] [CrossRef]
  12. Codex Alimentarius. Codex standard for wheat and durum wheat. Codex Stand. 1995, 199–1995. [Google Scholar]
  13. European-Union Directive 2002/32/EC. Off. J. Eur. Communities 2002, 10–21.
  14. Walters, E.M.; Wolf, E.; Whyte, J.J.; Mao, J.; Renner, S.; Nagashima, H.; Kobayashi, E.; Zhao, J.; Wells, K.D.; Critser, J.K.; et al. Completion of the swine genome will simplify the production of swine as a large animal biomedical model. BMC Med. Genomics 2012, 5, 55. [Google Scholar] [CrossRef] [PubMed]
  15. Robert, H.; Payros, D.; Pinton, P.; Theodorou, V.; Mercier-Bonin, M.; Oswald, I.P.; Théodorou, V.; Mercier-Bonin, M.; Oswald, I.P. Impact of mycotoxins on the intestine: Are mucus and microbiota new targets? Crit. Rev. Toxicol. 2017, 20, 249–275. [Google Scholar] [CrossRef] [PubMed]
  16. Ingawale, D.K.; Mandlik, S.K.; Naik, S.R. Models of hepatotoxicity and the underlying cellular, biochemical and immunological mechanism(s): A critical discussion. Env. Toxicol Pharmacol 2014, 37, 118–133. [Google Scholar] [CrossRef] [PubMed]
  17. Danicke, S.; Diers, S. Effects of ergot alkaloids on liver function of piglets as evaluated by the (13)C-methacetin and (13)C-alpha-ketoisocaproic acid breath test. Toxins 2013, 5, 139–161. [Google Scholar] [CrossRef] [PubMed]
  18. Moubarak, A.; Rosenkrans, C.J.; Johnson, Z.B. Modulation of cytochrome P450 metabolism by ergonovine and dihydroergotamine. Vet. Hum. Toxicol. 2003, 45, 6–9. [Google Scholar] [PubMed]
  19. Speijers, G.J.A. Subchronic Toxicity Experiment with Rats Fed a Diet Containing Ergotamine-Tartrate; RIVM-report n°618312002; National Institute for Public Health the Environment Protection: Bilthoven, The Netherlands, 1993. [Google Scholar]
  20. Mainka, S.; Dänicke, S.; Böhme, H.; Ueberschär, K.-H.; Polten, S.; Hüther, L.; Danicke, S.; Bohme, H.; Ueberschar, K.H.; Polten, S.; et al. The influence of ergot-contaminated feed on growth and slaughtering performance, nutrient digestibility and carry over of ergot alkaloids in growing-finishing pigs. Arch. Anim. Nutr. 2005, 59, 377–395. [Google Scholar] [CrossRef] [PubMed]
  21. Mainka, S.; Danicke, S.; Bohme, H.; Ueberschar, K.H.; Liebert, F.; Dänicke, S.; Böhme, H.; Ueberschär, K.H.; Liebert, F.; Danicke, S.; et al. On the composition of ergot and the effects of feeding two different ergot sources on piglets. Anim. Feed Sci. Technol. 2007, 139, 52–68. [Google Scholar] [CrossRef]
  22. Spiller, R. Recent advances in understanding the role of serotonin in gastrointestinal motility in functional bowel disorders: Alterations in 5-HT signalling and metabolism in human disease. Neurogastroenterol. Motil. 2007, 19 (Suppl. 2), 25–31. [Google Scholar] [CrossRef] [PubMed]
  23. Mulac, D.; Lepski, S.; Ebert, F.; Schwerdtle, T.; Humpf, H.U. Cytotoxicity and fluorescence visualization of ergot alkaloids in human cell lines. J. Agric. Food Chem. 2013, 61, 462–471. [Google Scholar] [CrossRef] [PubMed]
  24. McGuckin, M.A.; Linden, S.K.; Sutton, P.; Florin, T.H.; Lindén, S.K.; Sutton, P.; Florin, T.H. Mucin dynamics and enteric pathogens. Nat. Rev. Microbiol. 2011, 9, 265–278. [Google Scholar] [CrossRef] [PubMed]
  25. Akbari, P.; Braber, S.; Gremmels, H.; Koelink, P.J.; Verheijden, K.A.; Garssen, J.; Fink-Gremmels, J. Deoxynivalenol: A trigger for intestinal integrity breakdown. FASEB J. 2014, 28, 2414–2429. [Google Scholar] [CrossRef] [PubMed]
  26. Pinton, P.; Braicu, C.; Nougayrede, J.-P.P.; Laffitte, J.; Taranu, I.; Oswald, I.P.P. Deoxynivalenol Impairs Porcine Intestinal Barrier Function and Decreases the Protein Expression of Claudin-4 through a Mitogen-Activated Protein Kinase-Dependent Mechanism. J. Nutr. 2010, 140, 1956–1962. [Google Scholar] [CrossRef] [PubMed]
  27. Ramiro-Puig, E.; Pérez-Cano, F.J.; Castellote, C.; Franch, A.; Castell, M. The bowel: A key component of the immune system. Rev. Esp. Enferm. Dig. 2008, 100, 29–34. [Google Scholar] [PubMed]
  28. Gourbeyre, P.; Berri, M.; Lippi, Y.; Meurens, F.; Vincent-Naulleau, S.; Laffitte, J.; Rogel-Gaillard, C.; Pinton, P.; Oswald, I.P.P. Pattern recognition receptors in the gut: Analysis of their expression along the intestinal tract and the crypt/villus axis. Physiol. Rep. 2015, 3. [Google Scholar] [CrossRef] [PubMed]
  29. Kumar, H.; Kawai, T.; Akira, S. Pathogen recognition by the innate immune system. Int. Rev. Immunol. 2001, 30, 16–34. [Google Scholar] [CrossRef] [PubMed]
  30. Cooper, C.A.; Moraes, L.E.; Murray, J.D.; Owens, S.D. Hematologic and biochemical reference intervals for specific pathogen free 6-week-old Hampshire-Yorkshire crossbred pigs. J. Anim. Sci. Biotechnol. 2014, 5, 5. [Google Scholar] [CrossRef] [PubMed]
  31. Meyer, D.; Harvey, J.W. Veterinary Laboratory Medicine: Interpretation and Diagnosis, 2nd ed.; W. B. Saunders Co.: Philadelphia, Pennsylvania, 1998; pp. 157–186. [Google Scholar]
  32. Kerr, M. Veterinary Laboratory Medecine, 2nd ed.; Blackwell Science Ltd.: London, UK, 2002; p. 392. [Google Scholar] [CrossRef]
  33. Lucioli, J.; Pinton, P.; Callu, P.; Laffitte, J.; Grosjean, F.; Kolf-Clauw, M.; Oswald, I.P.P.; Bracarense, A.P.F.R.L.P. The food contaminant deoxynivalenol activates the mitogen activated protein kinases in the intestine: Interest of ex vivo models as an alternative to in vivo experiments. Toxicon 2013, 66, 31–36. [Google Scholar] [CrossRef] [PubMed]
  34. Grenier, B.; Bracarense, A.P.; Schwartz, H.E.; Trumel, C.; Cossalter, A.M.; Schatzmayr, G.; Kolf-Clauw, M.; Moll, W.D.; Oswald, I.P. The low intestinal and hepatic toxicity of hydrolyzed fumonisin B(1) correlates with its inability to alter the metabolism of sphingolipids. Biochem. Pharmacol. 2012, 83, 1465–1473. [Google Scholar] [CrossRef] [PubMed] [Green Version]
  35. Gerez, J.R.R.; Pinton, P.; Callu, P.; Grosjean, F.; Oswald, I.P.P.; Bracarense, A.P.F.L.P. Deoxynivalenol alone or in combination with nivalenol andzearalenone induce systemic histological changes in pigs. Exp. Toxicol. Pathol. 2015, 67, 89–98. [Google Scholar] [CrossRef] [PubMed]
  36. García, G.R.; Payros, D.; Pinton, P.; Dogi, C.A.; Laffitte, J.; Neves, M.; González Pereyra, M.L.; Cavaglieri, L.R.; Oswald, I.P. Intestinal toxicity of deoxynivalenol is limited by Lactobacillus rhamnosus RC007 in pig jejunum explants. Arch. Toxicol. 2018, 92, 983–993. [Google Scholar] [CrossRef] [PubMed]
  37. Pierron, A.; Mimoun, S.; Murate, L.S.; Loiseau, N.; Lippi, Y.; Bracarense, A.F.L.; Schatzmayr, G.; He, J.W.; Zhou, T.; Moll, W.D.; et al. Microbial biotransformation of DON: Molecular basis for reduced toxicity. Sci. Rep. 2016, 6, 29105. [Google Scholar] [CrossRef] [PubMed]
  38. Cano, P.M.; Seeboth, J.; Meurens, F.; Cognie, J.; Abrami, R.; Oswald, I.P.; Guzylack-Piriou, L. Deoxynivalenol as a new factor in the persistence of intestinal inflammatory diseases: An emerging hypothesis through possible modulation of Th17-mediated response. PLoS ONE 2013, 8, e53647. [Google Scholar] [CrossRef] [PubMed]
  39. Andersen, C.; Jensen, J.; Orntoft, T. Normalization of Real Time Quantitative Reverse Transcription—PCR Data: A Model—Based Variance Estimation Approach to Identify Genes Suited for Normalization, Applied to Bladder and Colon Cancer Data Sets. Cancer Res. 2004, 64, 5245. [Google Scholar] [CrossRef] [PubMed]
  40. Ruijter, J.M.; Ramakers, C.; Hoogaars, W.M.H.; Karlen, Y.; Bakker, O.; van den hoff, M.J.B.; Moorman, A.F.M. Amplification efficiency: Linking baseline and bias in the analysis of quantitative PCR data. Nucleic Acids Res. 2009, 37. [Google Scholar] [CrossRef] [PubMed]
  41. Alassane-Kpembi, I.; Gerez, J.R.; Cossalter, A.-M.; Neves, M.; Laffitte, J.; Naylies, C.; Lippi, Y.; Kolf-Clauw, M.; Bracarense, A.P.L.; Pinton, P.; et al. Intestinal toxicity of the type B trichothecene mycotoxin fusarenon-X: Whole transcriptome profiling reveals new signaling pathways. Sci. Rep. 2017, 7, 7530. [Google Scholar] [CrossRef] [PubMed]
  42. Pinton, P.; Graziani, F.; Pujol, A.; Nicoletti, C.; Paris, O.; Ernouf, P.; Di Pasquale, E.; Perrier, J.; Oswald, I.P.P.; Maresca, M.; et al. Deoxynivalenol inhibits the expression by goblet cells of intestinal mucins through a PKR and MAP kinase-dependent repression of the resistin-like molecule beta. Mol. Nutr. Food Res. 2015, 59, 1076–1087. [Google Scholar] [CrossRef] [PubMed]
  43. Yamagata, K.; Tagami, M.; Takenaga, F.; Yamori, Y.; Itoh, S. Hypoxia-induced changes in tight junction permeability of brain capillary endothelial cells are associated with IL-1beta and nitric oxide. Neurobiol. Dis. 2004, 17, 491–499. [Google Scholar] [CrossRef] [PubMed]
  44. Pfaffl, M.; Horgan, G.; Dempfle, L. Relative expression software tool (REST) for group-wise comparison and statistical analysis of relative expression results in real-time PCR. Nucleic Acids Res. 2002, 30, e36. [Google Scholar] [CrossRef] [PubMed]
Figure 1. Daily feed intake of piglets fed ergot sclerotia for 28 days (n = 24/group). Values are means with standard errors of the mean represented by vertical bars. a, b, c mean values with different letters are statistically different (p < 0.05).
Toxins 10 00183 g001
Figure 2. Liver of piglets fed ergot diets. (A) Control piglet. Normal liver. HE. Objective 10×; (B) Piglet fed 2.5 g ergot sclerotia/kg feed. Disorganization of hepatic cords and periportal hepatocyte vacuolation. HE. Objective 10×. Insert: Hepatocyte vacuolation. HE. Objective 40×; (C) Liver lesion score. Values are means with their standard errors of mean represented by vertical bars (n = 6 animals). Mean values with different letters are significantly different (p < 0.05). Bar = 100 μm.
Toxins 10 00183 g002
Figure 3. Effect of ergot exposure on jejunum of pigs receiving a control diet or a diet contaminated with 1.2 or 2.5 g ergot sclerotia/kg feed for 28 days. Jejunal section with hematoxylin-eosin (HE), Objective 10×: (A) Control piglet; (B) Piglet fed 2.5 g ergot sclerotia/kg feed; (C) Lesion score according to the occurrence and severity of lesions observed on formalin-fixed tissue sections stained with HE; (D) Villi height measured on formalin-fixed tissue sections stained with HE; (E) Number of goblet cells observed on formalin-fixed tissue sections stained with Schiff’s periodic acid. Values are means of the score, villi height and number of goblet cells/field respectively, with standard errors of the mean represented by vertical bars (n = 6 animals). a,b mean values with different letters are statistically different (p < 0.05).
Toxins 10 00183 g003
Figure 4. Expression of selected genes in the jejunum of pigs fed with a control diet or a diet including ergot alkaloids for 28 days. mRNA levels were measured by RT-qPCR. The three panels present different groups: TLR-encoding genes (A), junctional protein-encoding genes (B) and immune mediator-encoding genes (C). The gene expression levels for the control group are shown in black (mean value adjusted to 1 for this group) and those for the groups exposed to 1.2 and 2.5 g sclerotia/kg feed ergot are shown in orange and red, respectively (n = 6 animals/group). * statistical difference in gene expression between control animals and pigs exposed to the highest dose of ergot (p < 0.05).
Toxins 10 00183 g004
Table 1. Hematological analysis of pigs fed 1.2 or 2.5 g ergot sclerotia/kg feed (n = 24/group).
ParametersContamination of the Diet (g of Sclerotia/kg Feed)
01.22.5
Red blood cells (T/L)7.75 ± 0.127.80 ± 0.138.08 ± 0.13
Hemoglobin (g/dL)10.45 ± 0.22 a,b10.09 ± 0.21 a10.97 ± 0.19 b
Hematocrit (%)36.6 ± 0.70 a,b35.52 ± 0.87 a38.31 ± 0.63 b
Mean corpuscular volume (fL)47.46 ± 0.9345.67 ± 0.9347.58 ± 0.91
White blood cells (103/mm3)14.5 ± 0.614.2 ± 0.916.5 ± 0.9
Neutrophils (%)40.92 ± 2.51 a30.67± 1.84 b36.17 ± 2.55 a,b
Eosinophils (%)0.38 ± 0.150.54 ± 0.300.29 ± 0.14
Basophils (%)0.08 ± 0.080.08 ± 0.080.00 ± 0.00
Lymphocytes (%)53.96 ± 2.66 a63.96 ± 1.95 b58.79 ± 2.77 a,b
Monocytes (%)4.67 ± 0.424.75 ± 0.684.75 ± 0.63
Platelets/mm3521.58 ± 32.67465.00 ± 28.08533.04 ± 32.39
a, b mean values with different letters are statistically different (p < 0.05).
Table 2. Serum biochemical analysis of pigs fed 1.2 or 2.5 g ergot sclerotia/kg feed (n = 24/group).
ParametersContamination of the Diet (g of Sclerotia/kg Feed)
01.22.5
Alkaline phosphatase (U/L)275.7 ± 24.5237.6 ± 16.7228.6 ± 16.1
Alanine aminotransferase (U/L)37.3 ± 1.931.74 ± 1.533.32 ± 1.6
Amylase (U/L)1783 ± 1231815 ± 992074 ± 122
Aspartate aminotransferase (U/L)56.0 ± 6.842.6 ± 5.444.4 ± 3.94
Creatine kinase (U/L)3377 ± 396 a1924 ± 297 b1300 ± 252 b
Lactate dehydrogenase (U/L)962.8 ± 50.5968.3 ± 57.71013.3 ± 72.5
Lipase (U/L)6.45 ± 0.56.9 ± 0.35.9 ± 0.8
Albumin (μmol/L)533.0 ± 9.7530.4 ± 11.7522.4 ± 13.3
T bilirubine (μmol/L)11.2 ± 1.211.0 ± 1.27.4 ± 1.3
Cholesterol (mmol/L)3.0 ± 0.1 a2.6 ± 0.1 b2.8 ± 0.1 a
Creatinine (μmol/L)61.9 ± 6.263.3 ± 6.571.7 ± 6.4
Glucose PAP (mmol/L)4.4 ± 0.2 a4.7 ± 0.3 a5.4 ± 0.3 b
Phosphorus (mmol/L)3.1 ± 0.13.2 ± 0.13.0 ± 0.1
Total proteins (g/L)63.5 ± 7.859.1 ± 7.462.5 ± 8.2
Urea (mmol/L)4.7 ± 0.44.3 ± 0.33.5 ± 0.4
a, b mean values with different letters are statistically different (p < 0.05).
Table 3. Chemical composition of the diets (% of dry matter DM).
ParametersContamination of the Diet (g of Sclerotia/kg Feed)
01.22.5
Total nitrogen20.120.220.3
Raw cellulose2.62.72.8
Lipids4.34.44.4
Minerals6.06.16.0
Table 4. Ergot alkaloid content in experimental feed (mg/kg).
Alkaloids (mg/kg Feed)Contamination of the Diet (g of Sclerotia/kg Feed)
1.22.5
Ergotamine0.521.03
Ergotaminine0.240.58
Ergosine0.290.58
Ergosinine0.160.34
Ergocristine0.260.47
Ergocristinine0.180.40
Ergometrine0.170.44
Ergometrinine0.060.12
Ergocornine0.150.30
Ergocorninine0.110.29
Ergocryptine0.130.30
Ergocryptinine0.090.21
Total alkaloids2.45.1
Table 5. Primer sequences of genes used for qRT-PCR analysis of the jejunum (F: forward; R: reverse).
Target Gene Primer Sequence (5′–3′)mRNAReference
Alkaline phosphatase (ALP)FAAGCTCCGTTTTTGGCCTGENSSSCT00000037252.1[28]
RGGAGGTATATGGCTTGAGATCCA
Beta-2-microglobulin (B2M)FTTCTACCTTCTGGTCCACACTGANM_213978.1[41]
RTCATCCAACCCAGATGCA
C-C Motif Chemokine Ligand 20 (CCL20)FGCTCCTGGCTGCTTTGATGTCNM_001024589Present study
RCATTGGCGAGCTGCTGTGTG
C-C Motif Chemokine Ligand 28 (CCL28)FGGCTGCTGTCATCCTTCATGTENSSSCT00000018375Present study
RTGAGGGCTGACACAGATTCTTCT
Claudin 3 (CLDN3)FCTGCTCTGCTGCTCGTGCCCAY625258.1Present study
RTCATACGTAGTCCTTGCGGTCGTAG
Claudin 4 (CLDN4)FCTGCTTTGCTGCAACTGCCNM_001161637.1[26]
RTCAACGGTAGCACCTTACACGTAGT
E-cadherin (ECAD)FACCACCGCCATCAGGACTCNM_001163060.1Present study
RTGGGAGCTGGGAAACGTG
Interferon gamma (IFNG)FTGGTAGCTCTGGGAAACTGAATGNM_213948[28]
RGGCTTTGCGCTGGATCTG
Interleukin 1A (IL-1A)FTCAGCCGCCCATCCANM_214029.1[38]
RAGCCCCCGGTGCCATGT
Interleukin 1B (IL-1B)FATGCTGAAGGCTCTCCACCTCNM_214055[28]
RTTGTTGCTATCATCTCCTTGCAC
Interleukin 8 (IL-8)FGCTCTCTGTGAGGCTGCAGTTCNM_213867.1[38]
RAAGGTGTGGAATGCGTATTTATGC
Interleukin 10 (IL-10)FGGCCCAGTGAAGAGTTTCTTTCNM_214041[38]
RCAACAAGTCGCCCATCTGGT
Interleukin 12B (IL-12B)FGGTTTCAGACCCGACGAACTCTNM_214013.1[38]
RCATATGGCCACAATGGGAGATG
Interleukin 17A (IL-17A)FCCAGACGGCCCTCAGATTACNM_001005729.1[38]
RGGTCCTCGTTGCGTTGGA
Interleukin 21 (IL-21)FGGCACAGTGGCCCATAAATCNM_214415Present study
RGCAGCAATTCAGGGTCCAAG
Interleukin 23A (IL-23A)FTTCTCTACACCCTGATGGCTCTGENSSSCT00000047550.1Present study
RTCGGGCTGCAAGAGTTGC
Junctional adhesion molecule A (JAM-A)FCGTGCCTTCATCAACTCTTCCTATNM_001128444.1Present study
RCACAAGTGTAATCTCCAGCATCAGA
Lysozyme (LZM)FGGTCTATGATCGGTGCGAGTTCNM_214392.2[28]
RTCCATGCCAGACTTTTTCAGAAT
Mucin 1 (MUC1)FGCATTACAAACCTCCAGTTTACCTAY243508.1[42]
RCCCAGAAGCCCGTCTTCTTT
Mucin 2 (MUC2)FGCAGCCTGTGCGAGGAAXM_003122394.1[42]
RTGTCATCATACACAGTGCCTTCTG
Occludin (OCLN)FAGCTGGAGGAAGACTGGATCAGU79554.1[43]
RTGCAGGCCACTGTCAAAATT
Nuclear Factor Kappa B (NFkB)FCCTCCACAAGGCAGCAAATAGENSSSCT00000033438Present study
RTCCACACCGCTGTCACAGA
Nuclear oligomerization domain 1 (NOD1)FTGGGCTGCGTCCTGTTCAAB_187219.1[28]
RGGTGACCCTGACCGATGT
Nuclear oligomerization domain 2 (NOD2)FGAGCGCATCCTCTTAACTTTCAB426547.1[28]
RACGCTCGTGATCCGTGAAC
Proliferating cell nuclear antigen (PCNA)FGTTGATAAAGAGGAGGAAGCAGTTNM_001291925.1[28]
RTGGCTTTTGTAAAGAAGTTCAGGTAC
Peptidylprolyl isomerase A (cyclophilin A)FCCCACCGTCTTCTTCGACATNM_214353.1[38]
RTCTGCTGTCTTTGGAACTTTGTCT
Prion protein (PRP)FTTTGTGCATGACTGCGTCAACNM_001008687.1Present study
RCGTGGTCACTGTGTGCTGCT
Ribosomal protein L32 (RPL32)FAGTTCATCCGGCACCAGTCANM_001001636.1[26]
RGAACCTTCTCCGCACCCTGT
Suppressor of Cytokine Signaling 3 (SOCS3)FCTTCACGCTCAGCGTCAAGHM045422.1Present study
RCTTGAGCACGCAGTCGAAG
Transforming growth factor beta (TGFB)FGAAGCGCATCGAGGCCATTCNM_214015[28]
RGGCTCCGGTTCGACACTTTC
Toll-like receptor 1 (TLR1)FTGCTGGATGCTAACGGATGTCAB219564.1[28]
RAAGTGGTTTCAATGTTGTTCAAAGTC
Toll-like receptor 2 (TLR2)FTCACTTGTCTAACTTATCATCCTCTTGAB085935.1[28]
RTCAGCGAAGGTGTCATTATTGC
Toll-like receptor 4 (TLR4)FGCCATCGCTGCTAACATCATCAB188301.2[28]
RCTCATACTCAAAGATACACCATCGG
Toll-like receptor 5 (TLR5)FCCTTCCTGCTTCTTTGATGGNM_001348771[28]
RCTGTGACCGTCCTGATGTAG
Toll-like receptor 6 (TLR6)FAACCTACTGTCATAAGCCTTCATTCAB085936.1[28]
RGTCTACCACAAATTCACTTTCTTCAG
Tumor Necrosis Factor alpha (TNF-A)FACTGCACTTCGAGGTTATCGGNM_214022[28]
RGGCGACGGGCTTATCTGA
Zonula occludens 1 (ZO-1)FATAACATCAGCACAGTGCCTAAAGCAJ318101.1Present study
RGTTGCTGTTAAACACGCCTCG

