Phytic Acid Decreases Oxidative Stress and Intestinal Lesions Induced by Fumonisin B1 and Deoxynivalenol in Intestinal Explants of Pigs

 and
and
Abstract
:1. Introduction
2. Results
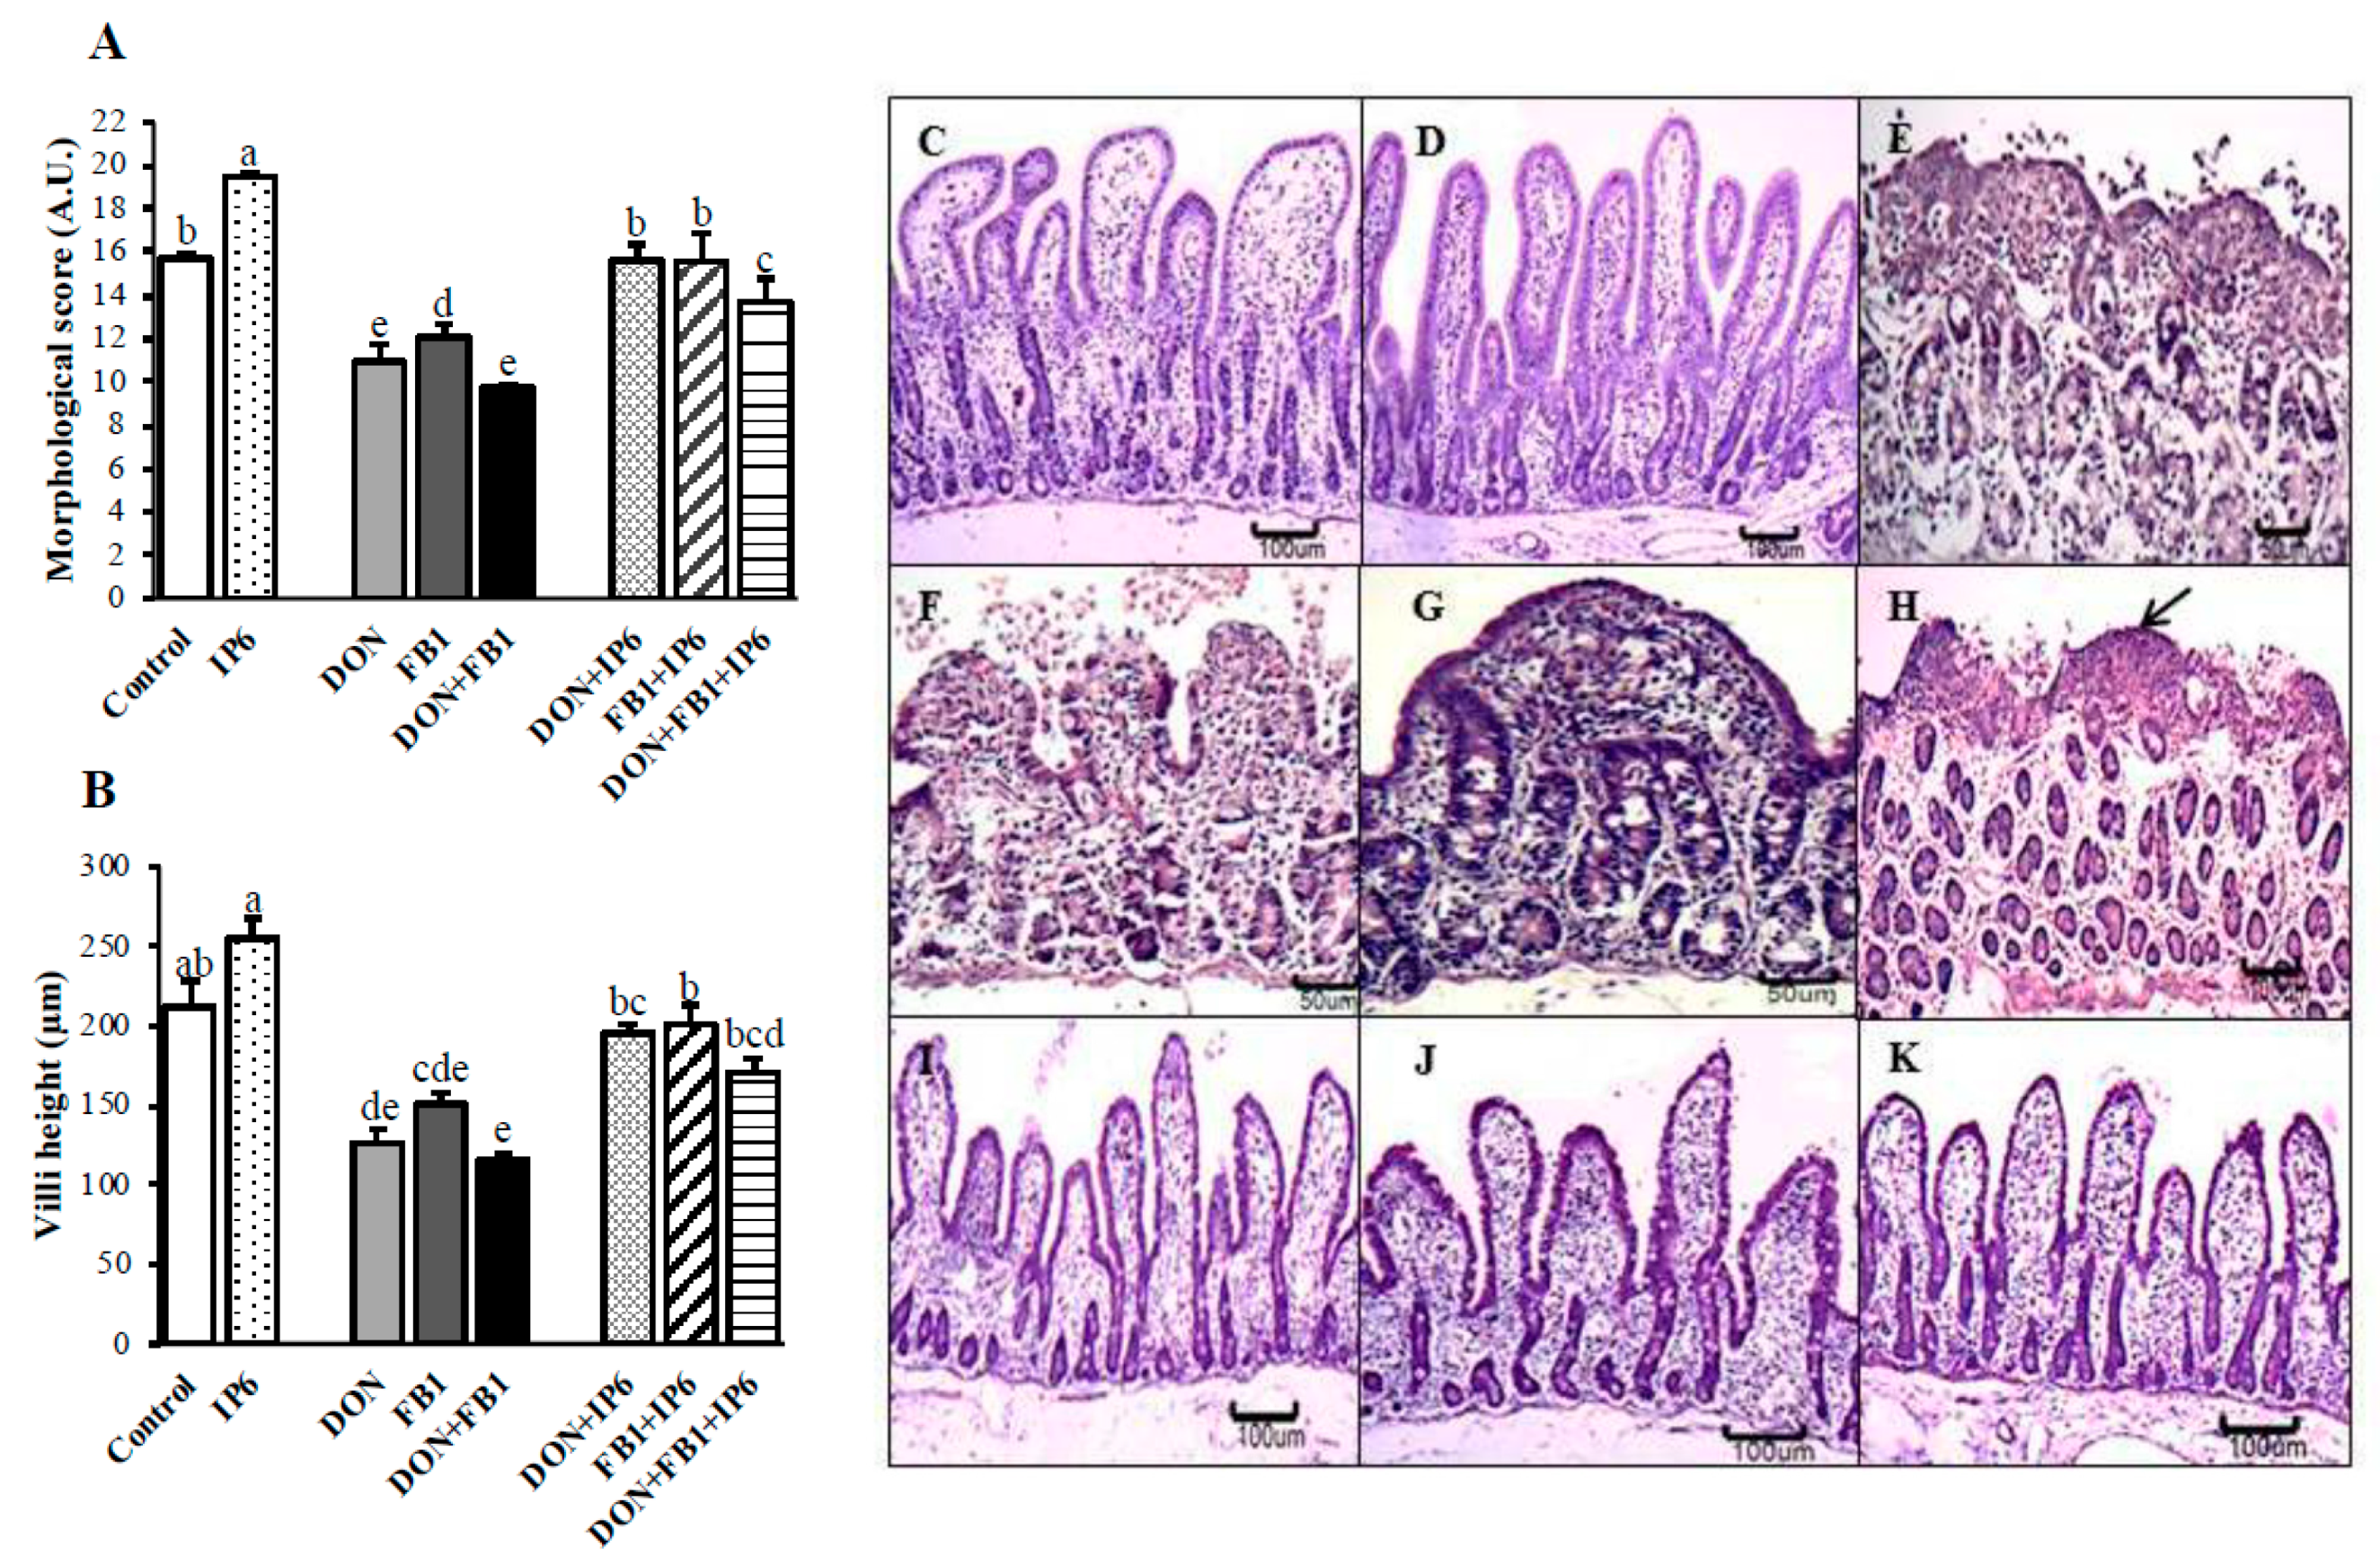
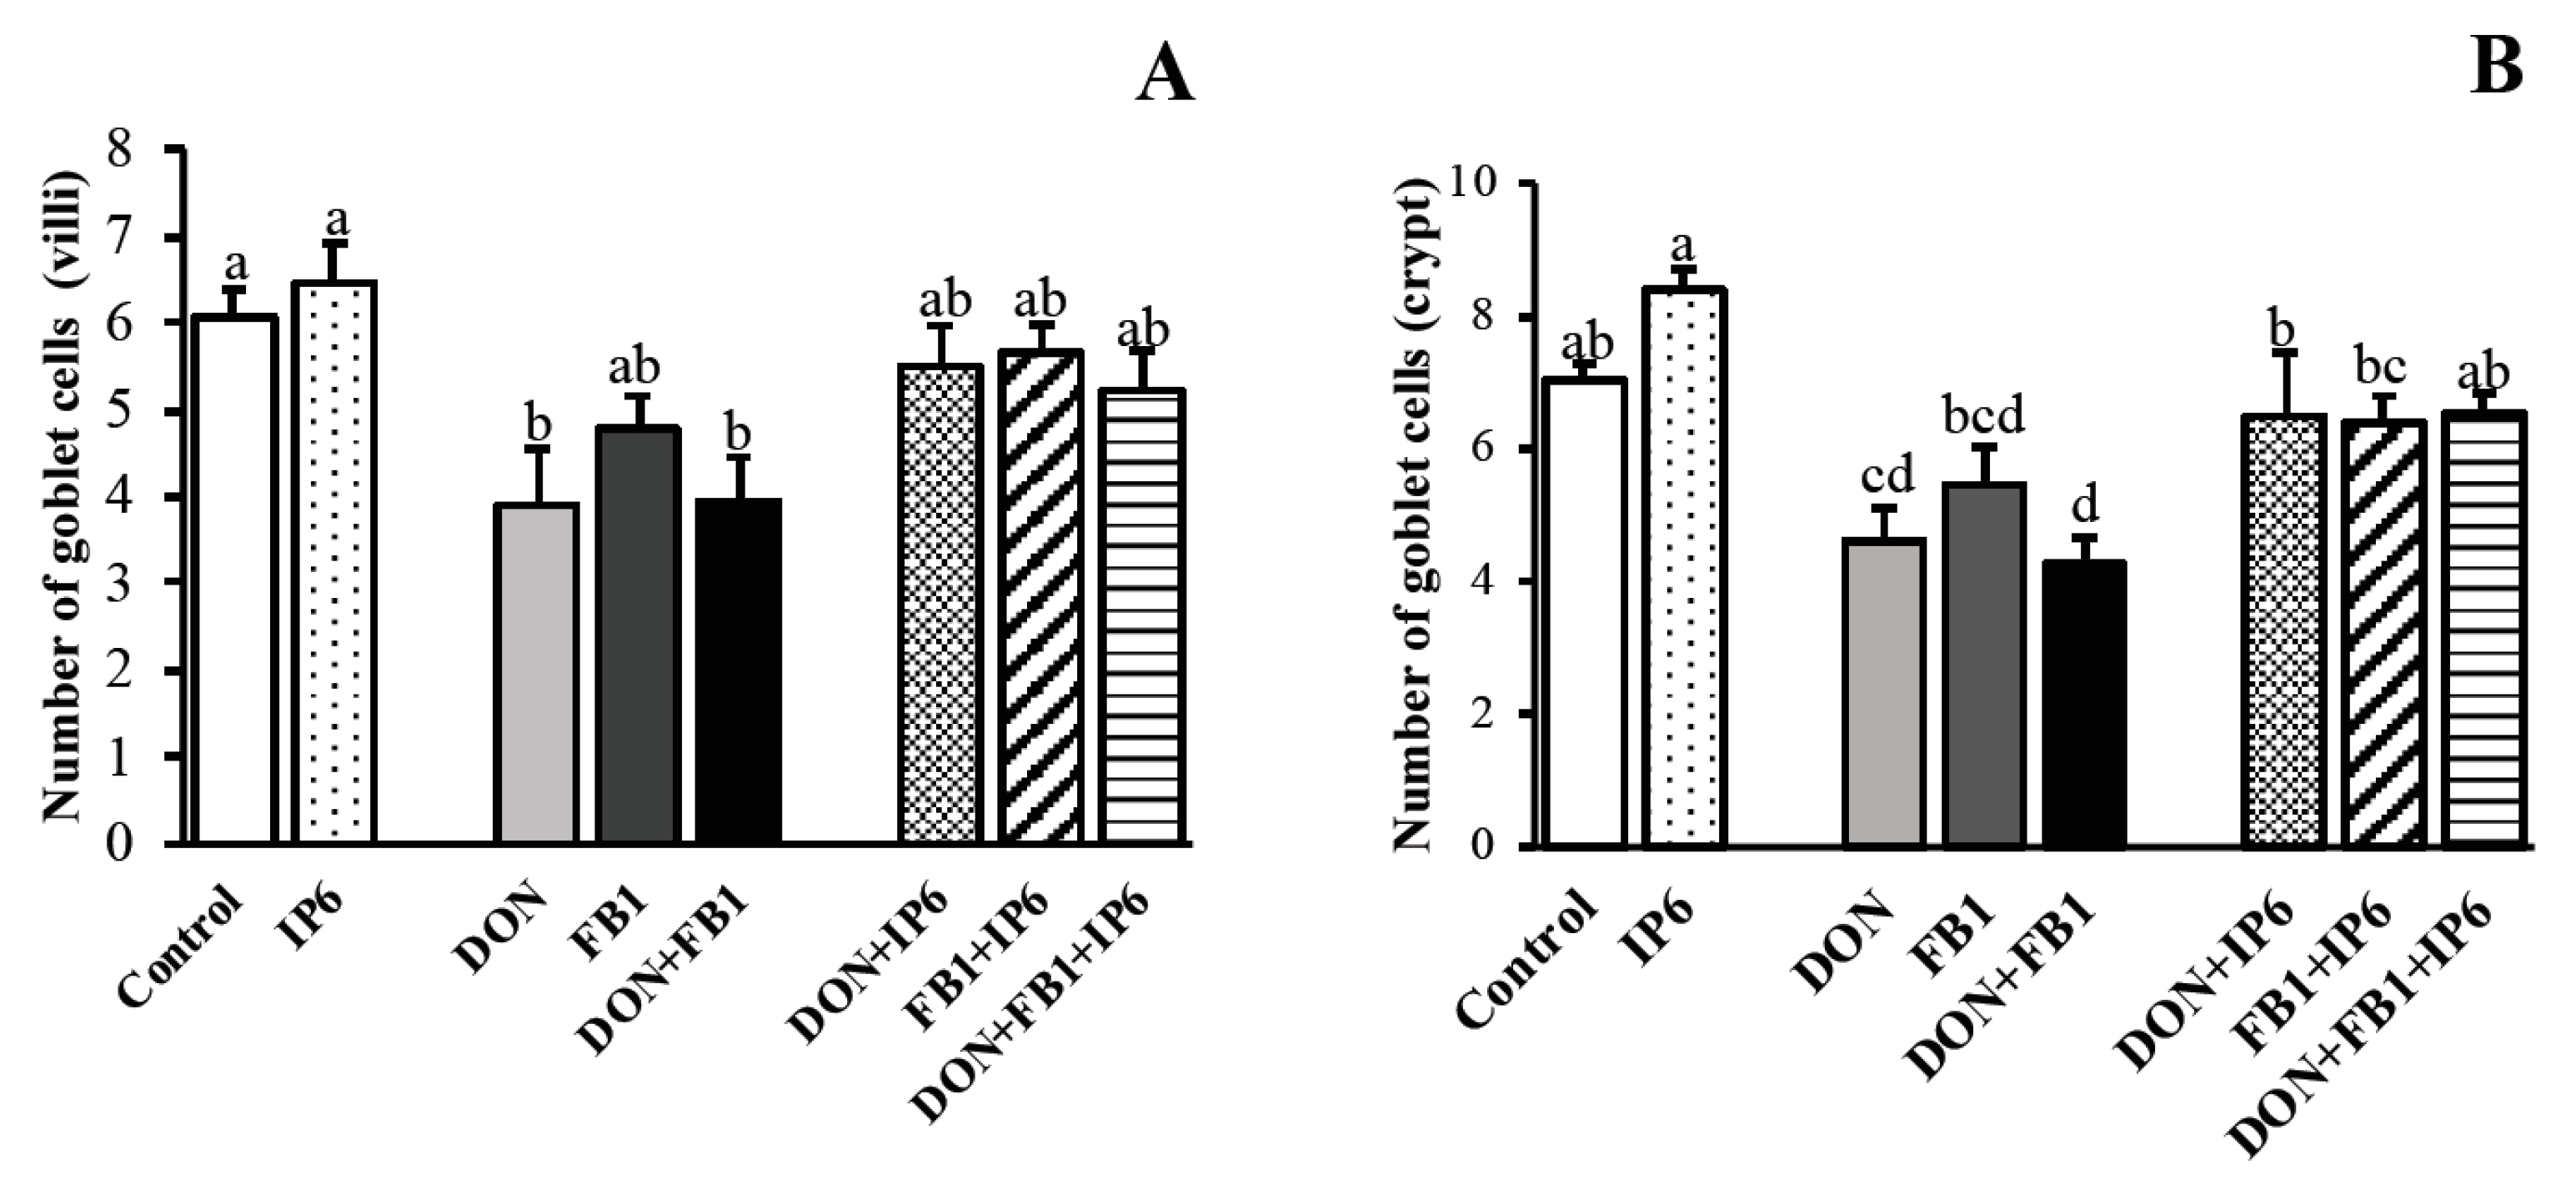
2.1. Morphological Assessment
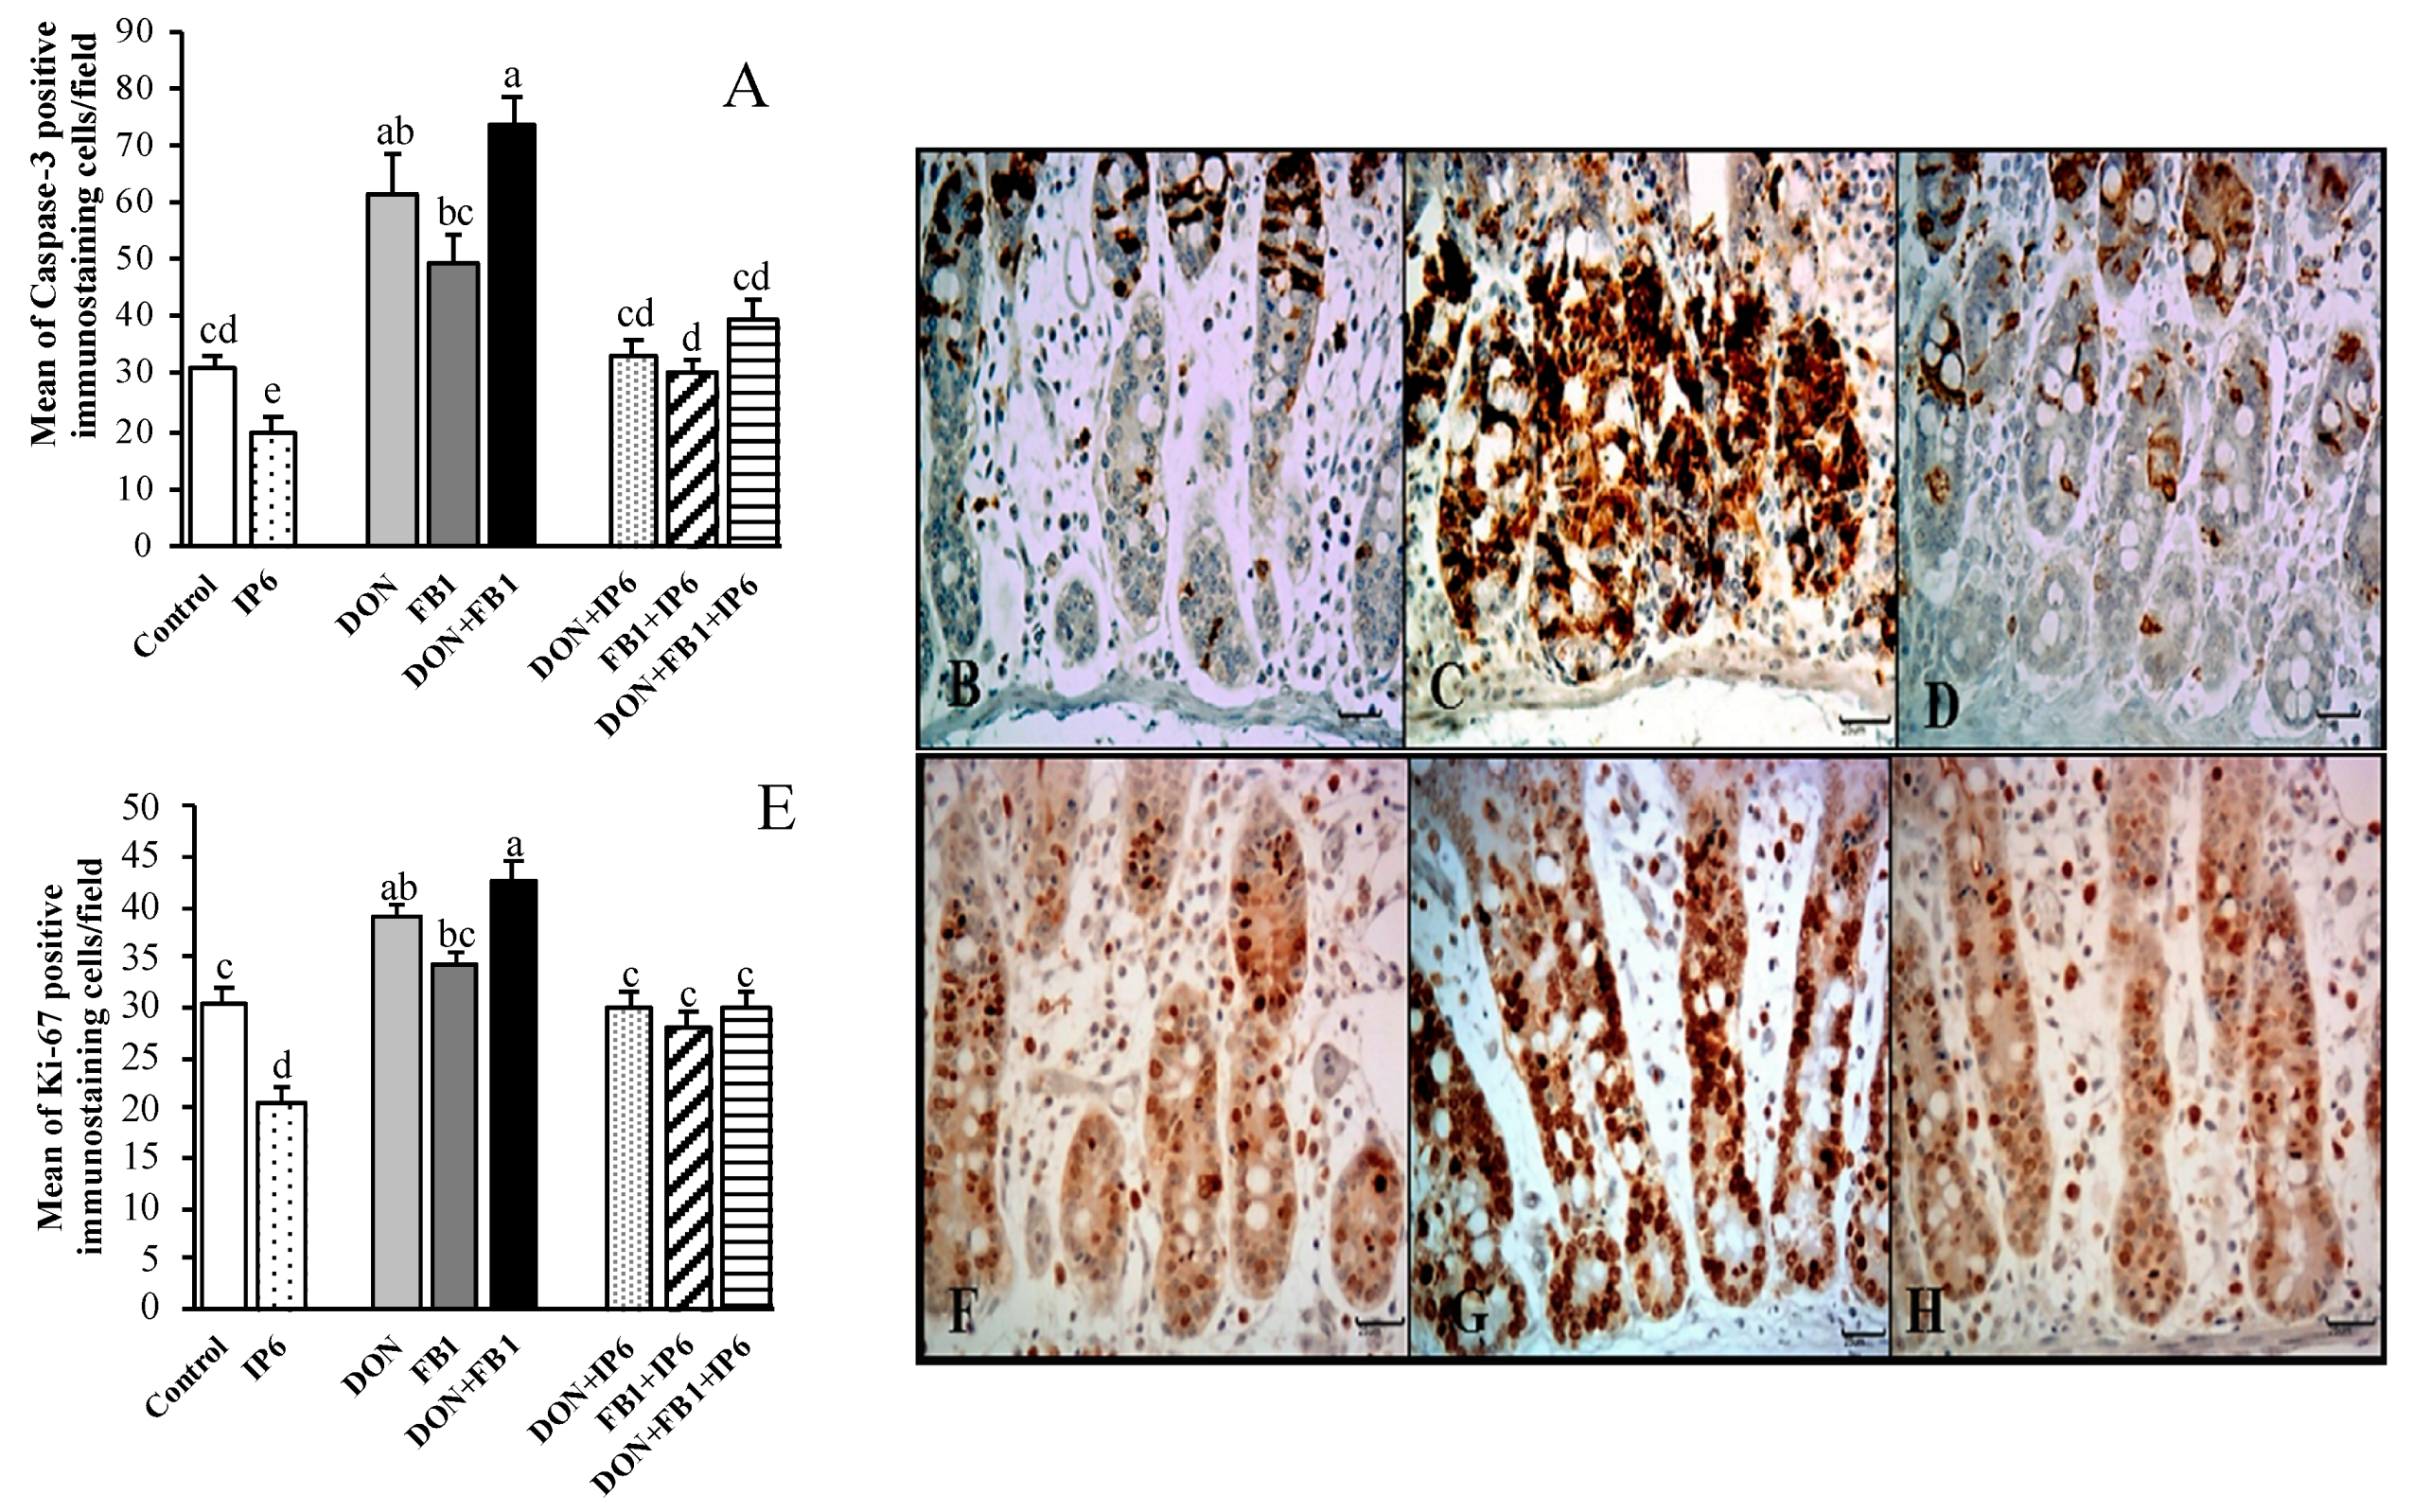
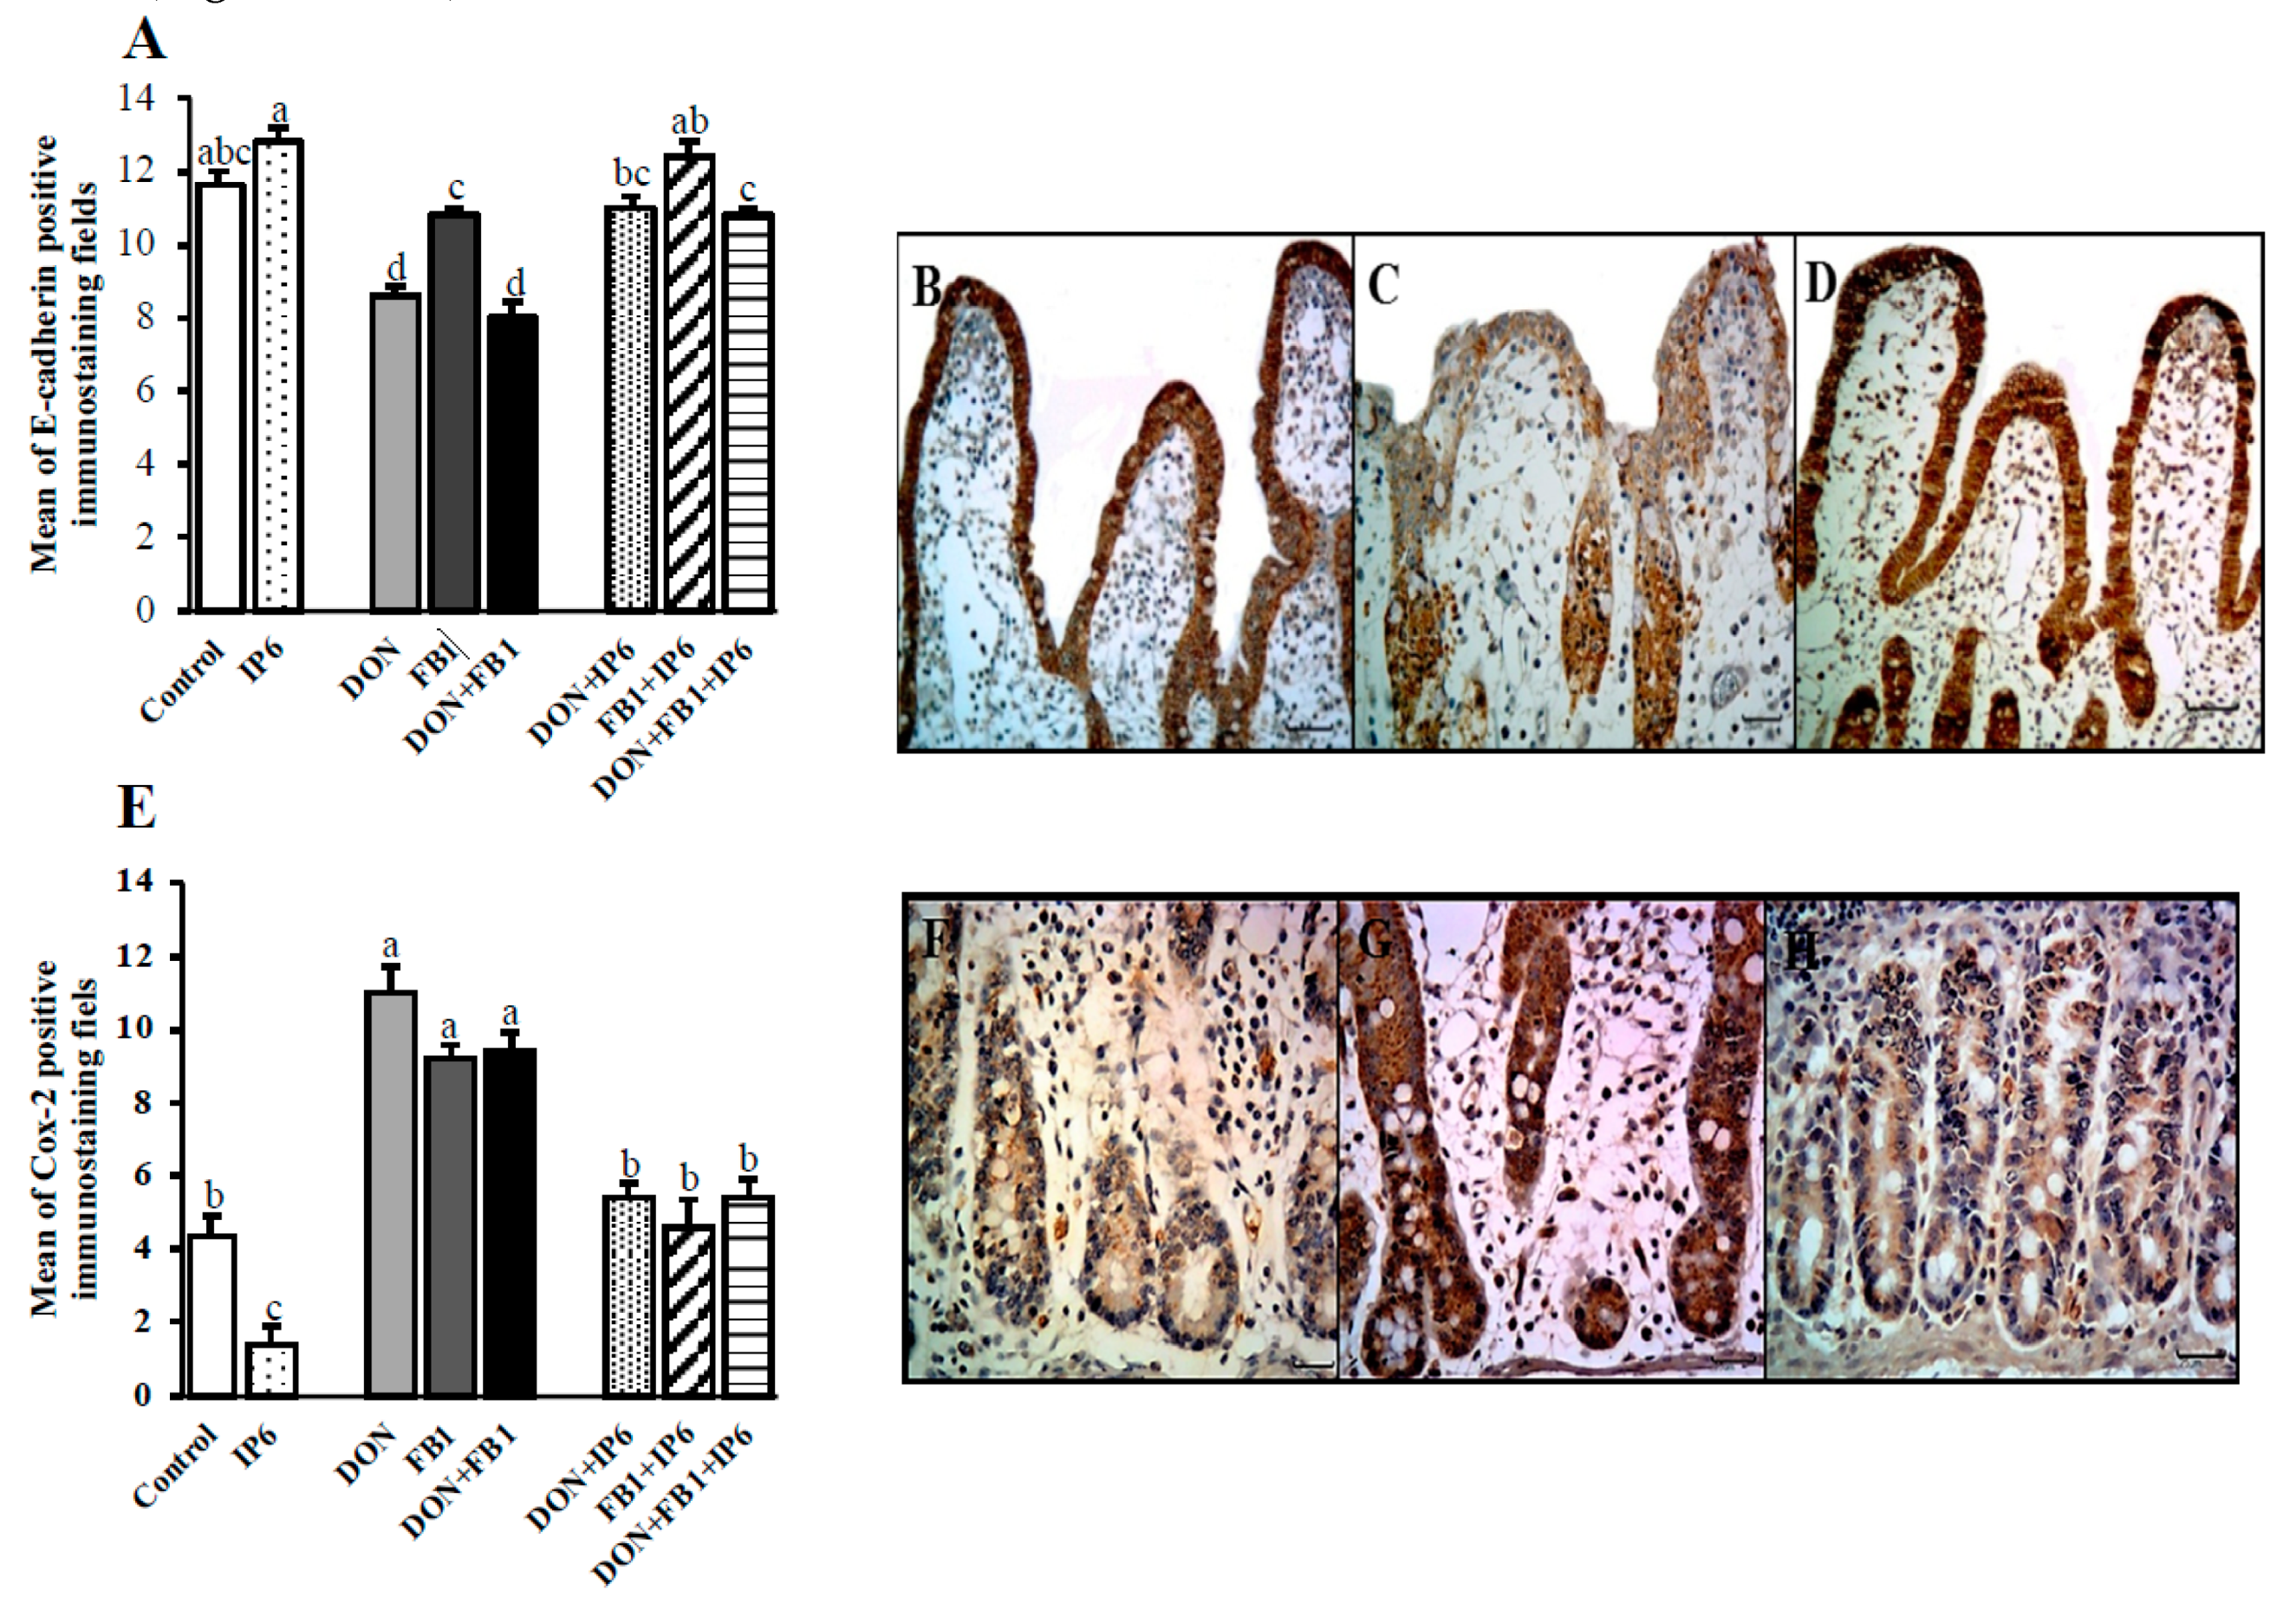
2.2. Caspase-3, Ki-67, E-cadherin and cox-2 Expression
2.3. Oxidative Stress Evaluation
3. Discussion
4. Conclusions
5. Materials and Methods
5.1. Animals and Reagents (FB1, DON, and Phytic Acid)
5.2. Ex Vivo Experimental Model
5.3. Histological and Immunohistochemical Assessment
5.4. GSH Levels Measurement
5.5. Lipid Peroxidation Measurement (TBARS)
5.6. ABTS and FRAP Assays
5.7. Statistical Analysis
Author Contributions
Funding
Acknowledgments
Conflicts of Interest
References
- Escrivá, L.; Font, G.; Manyes, L. In vivo toxicity studies of Fusarium mycotoxins in the last decade: A review. Food Chem. Toxicol. 2015, 78, 185–206. [Google Scholar]
- Adhikari, M.; Negi, B.; Kaushik, N.; Adhikari, A.; Al-Khedhairy, A.A.; Kaushik, N.K.; Choi, E.H. T-2 mycotoxin: Toxicological effects and decontamination strategies. Oncotarget 2017, 8, 33933–33952. [Google Scholar] [CrossRef] [PubMed]
- Alshannaq, A.; Yu, J.-H. Occurrence, toxicity, and analysis of the major mycotoxins in food. Int. J. Environ. Res. Public Health 2017, 14, 632. [Google Scholar] [CrossRef] [PubMed]
- Osselaere, A.; Santos, R.; Hautekiet, V.; Backer, P.D.; Chiers, K.; Ducatelle, R.; Croubels, S. Deoxynivalenol impairs hepatic and intestinal gene expression of selected oxidative stress, tight junction and inflammation proteins in broiler chickens, but addition of an adsorbing agent shifts the effects to the distal parts of the small intestine. PLoS ONE 2013, 8, e69014. [Google Scholar] [CrossRef]
- Abbes, S.; Ben Salah-Abbes, J.; Jebali, R.; Younes, R.B.; Queslati, R. Interaction of aflatoxin B1 and fumonisin B1 in mice causes immunotoxicity and oxidative stress: Possible protective role using lactic acid bacteria. J. Immunotoxicol. 2016, 13, 46–54. [Google Scholar] [CrossRef]
- Li, D.; Ye, Y.; Lin, S.; Deng, L.; Fan, X.; Zhang, Y.; Deng, X.; Li, Y.; Haikuo, M.H.Y. Evaluation of deoxynivalenol-induced toxic effects on DF-1 cells in vitro: Cellcycle arrest, oxidative stress, and apoptosis. Environ. Toxicol. Pharmacol. 2014, 37, 141–149. [Google Scholar] [CrossRef] [PubMed]
- Domijan, A.M.; Gajski, G.; Jovanovic, I.N.; Geric, M.; Garaj-Vrhovac, V. In vitro genotoxicity of mycotoxin ochratoxin A and fumonisin B (1) could be prevented by sodium copper chlorophylin-implication to their genotoxic mechanism. Food Chem. 2015, 170, 455–462. [Google Scholar] [CrossRef]
- Pinton, P.; Braicu, C.; Nougayred, J.-P.; Laffitte, J.; Taranu, I.; Oswald, I.P. Deoxynivalenol impairs porcine intestinal barrier function and decreases the protein expression of claudin-4 through a mitogen activated protein kinase-dependent mechanism. J. Nutr. 2010, 140, 1956–1962. [Google Scholar] [CrossRef]
- Bracarense, A.P.F.R.L.; Lucioli, J.; Grenier, B.; Pacheco, G.D.; Molls, W.-D.; Schtzmayr, G.; Oswald, I.P. Chronic ingestion of deoxynivalenol and fumonisin, alone or in interaction, induces morphological and immunological changes in the intestine of piglets. Br. J. Nutr. 2012, 107, 1776–1786. [Google Scholar] [CrossRef]
- Basso, K.; Gomes, F.; Bracarense, A.P. Deoxynivanelol and fumonisin, alone or in combination, induce changes on intestinal junction complexes and in E-cadherin expression. Toxins 2013, 5, 2341–2352. [Google Scholar] [CrossRef]
- Wan, L.Y.; Woo, C.S.; Turner, P.C.; Wan, J.M.; El-Nezanmi, H. Individual and combined effects of Fusarium toxins on the mRNA expression of pro-inflammatory cytokines in swine jejunal epithelial cells. Toxicol Lett. 2013, 220, 238–246. [Google Scholar] [CrossRef] [PubMed]
- Silva, E.O.; Gerez, J.R.; Drape, T.C.; Bracarense, A.F.R.L. Phytic acid decreases deoxynivalenol and fumonisin B1-induced changes on swine jejunal explants. Toxicol. Rep. 2014, 1, 284–292. [Google Scholar] [CrossRef] [PubMed]
- Silva, E.O.; Bracarense, A.P.F.R.L. Phytic acid: From antinutritional to multiple protection of organic systems. J. Food Sci. 2016, 81, R135–R1362. [Google Scholar] [CrossRef] [PubMed]
- Onomi, S.; Okazak, Y.; Katayama, T. Effect of dietary level of phytic acid on heptic and serum lipid status in rats fed a high-sucrose diet. Biosci. Biotecnol. Biochem. 2004, 68, 1379–1381. [Google Scholar] [CrossRef] [PubMed]
- Kapral, M.; Wawszyk, J.; Jurzak, M.; Hollek, A.; Weglarz, L. The effect of inositol hexaphosphato on the expression of selected metalloproteinase and their tissue inhibitors in Il-1β-stimulated colon. Int. J. Colorectal Dis. 2012, 27, 1419–1428. [Google Scholar] [CrossRef] [PubMed]
- Fuster, J.M.B.; Cortes, S.P.; Bestard, J.P.; Freixedas, F. Plant phosphates, phytate and pathological calcifications in chronic kidney disease. Nefrologia 2017, 37, 20–28. [Google Scholar]
- Cholewa, K.; Parfiniewicz, B.; Bednarek, I.; Swiatkowska, L.; Jezienicka, E.; Kierot, J.; Weglarz, L. The influence of phytic acid on TNF-α and its receptors genes expression in colon cancer caco-2 cells. Acta Polon. Pharm.-Drug Res. 2008, 65, 75–79. [Google Scholar]
- Saad, N.; Esa, N.M.; Ithnin, H. Suppression of β-catenin and cyclooxygenase-2 expression and cell proliferation in azoxymethane-induced colonic cancer in rats by rice bran phytic acid (PA). Asian Pac. J. Cancer Prev. 2013, 14, 3093–3099. [Google Scholar] [CrossRef]
- Kapral, M.; Wawszczyk, J.; Sośnicki, S.; Węglarz, L. Down-regulation of inducible nitric oxide synthase expression by inositol hexaphosphate in human colon cancer cells. Acta Pol. Pharm. 2015, 72, 705–711. [Google Scholar]
- Schlemmer, U.; Jany, K.D.; Berk, A.; Schulz, E.; Rechkemmer, G. Degradation of phytate in the gut of pigs-pathway of gastrointestinal inositol phosphate hydrolysis and enzyme involved. Arch. Anim. Nutr. 2001, 55, 255–280. [Google Scholar] [CrossRef]
- Silva, E.O.; Bracarense, A.P.F.R.L.; Oswald, I.P. Mycotoxins and oxidative stress: Where are we? World Mycotoxin J. 2018, 11, 113–133. [Google Scholar] [CrossRef]
- Pacheco, G.D.; Silva, C.A.; Pinton, P.; Oswald, I.P.; Bracarense, A.P. Phytic acid protects porcine intestinal epithelial cells from deoxynivalenol (DON) cytotoxicity. Exp. Toxicol. Pathol. 2012, 64, 345–347. [Google Scholar] [CrossRef]
- Lucioli, J.; Pinton, P.; Patrick, C.; Laffitte, J.; Grosjean, F.; Kolf-Clauw, M.; Oswald, I.P.; Bracarense, A.P.F.R.L. he food contaminant deoxynivlanol activates the mitogen activated protein kinases in the intestine: Interest of ex vivo models as an alternative to in vivo experiments. Toxicon 2013, 66, 31–36. [Google Scholar] [CrossRef] [PubMed]
- Yang, G.-H.; Jarvis, B.B.; Vhung, Y.-J.; Pestka, J.J. Apoptosis induction by the Satratoxins and other trichothecene mycotoxin: Relationship to ERK, p38 MAPK, and SAPK/JNK activation. Toxicol. Appl. Pharmacol. 2000, 164, 149–160. [Google Scholar] [CrossRef]
- Pestka, J.J. Mechanisms of deoxynivalenol-induced gene expression and apoptosis. Food Addit. Contam. Part A 2008, 25, 1123–1140. [Google Scholar] [CrossRef]
- Strasser, A.; Carra, M.; Ghareeb, K.; Awad, W.; Bohm, J. Protective effects of antioxidants on deoxynivalenol-induced damage in murine lymphoma cells. Mycotoxin Res. 2013, 29, 203–208. [Google Scholar] [CrossRef] [PubMed]
- Reuter, S.; Gupta, S.C.; Vhaturvedi, M.M.; Agarwal, B.B. Oxidative stress, inflammation, and cancer: How are they linked? Free Radic. Biol. Med. 2010, 49, 1603–1616. [Google Scholar] [CrossRef] [PubMed] [Green Version]
- Cuenda, A.; Rousseau, S. p38 MAP-kinases pathway regulation, function and role in human diseases. Biochim. Biophys. Acta 2007, 1773, 1358–1375. [Google Scholar] [CrossRef]
- Grenier, B.; Bracarense, A.P.F.L.; Schwartz, H.E.; Trumel, C.; Cossalter, A.M.; Schatzmayr, G.; Oswald, I.P. The low intestinal and hepatic toxicity of hydrolyzed fumonisin B1 correlates with its inability to alter the metabolism of sphingolipids. Biochem. Pharmacol. 2012, 83, 1465–1473. [Google Scholar] [CrossRef] [Green Version]
- Beak, S.M.; Lee, Y.S.; Kim, J.A. NADPH oxidase and cyclooxygenase mediate the ultraviolet B-induced generation of reactiveoxygen species and activation of nuclear factor-kappaB in HaCaT human keratinocytes. Biochimie 2004, 86, 425–429. [Google Scholar] [CrossRef]
- Hou, Y.J.; Zhao, Y.Y.; Xiong, B.; Cui, X.S.; Kim, N.H.; Xu, Y.X.; Sun, S.C. Mycotoxin-containing diet causes oxidative stress in the mouse. PLoS ONE 2013, 8, e60374. [Google Scholar] [CrossRef]
- Zbynovska, K.; Petruška, P.; Capcarova, M. Effect of deoxynivalenol on some haematological, biochemical and antioxidant parameters of porcine blood in vitro. J. Microbiol. Biotechnol. Food Sci. 2013, 2, 1611–1628. [Google Scholar]
- Sun, L.H.; Lei, M.; Zhang, N.Y.; Gao, X.; Li, C.; Krumm, C.S.; Qi, D.S. Individual and combined cytotxic effects of aflotoxin B1, zearalenone, deoxynivalenol and fumonisin B1 on BRL3A rat liver cell. Toxicon 2015, 96, 6–12. [Google Scholar] [CrossRef] [PubMed]
- Wang, X.; Wu, Q.; Wan, D.; Liu, Q.; Chen, D.; Liu, Z.; Matinez-Larranaga, M.R.; Martinez, M.A.; Anadon, A.; Yuan, Z. Fumonisins: Oxidative stress-mediated toxicity and metabolism in vivo and in vitro. Arch. Toxicol. 2016, 90, 81–101. [Google Scholar] [CrossRef] [PubMed]
- Mary, V.S.; Theumer, M.G.; Otaiza, S.N.; Velez, P.A.; Rubinstein, H.R.; Theumer, M.G. The aflatoxina B1-fumonisin B1 toxicity in BRL-3A Hepatocytes is associated to induction of cytochrome P450 activity and arachidonic acid metabolism. Environ. Toxicol. 2017, 32, 1711–1724. [Google Scholar] [CrossRef]
- Pestka, J.J.; Smolinski, A.T. Deoxynivalenol: Toxicology and potential effects on humans. J. Toxicol. Environ. Health B Crit. Rev. 2005, 8, 39–69. [Google Scholar] [CrossRef] [PubMed]
- Graf, E.; Eaton, J.W. Antioxidant functions of phytic acid. Free Radic. Biol. Med. 1990, 8, 61–69. [Google Scholar] [CrossRef]
- Challa, A.; Rao, D.R.; Reddy, B. Interactive suppression of aberrant crypt foci induced by azoxymethene in rat coln by phytic acid and green tea. Carcinogenesis 1997, 18, 2023–2026. [Google Scholar] [CrossRef]
- Jenab, P.M.; Thompson, L.U. Phytic acid in wheat bran affects colon morphology, cell proliferation and apopstosis. Carcinogenesis 2000, 21, 1547–1552. [Google Scholar] [CrossRef]
- Norazalina, S.; Norhaizan, M.E.; Hairuszah, I.; Norashareena, M.S. Anticarcinogeninc efficacy of Phytic acid extracted from rice bran on azoxymethane-induced colon carcinogenesis in rats. Exp. Toxicol. Pathol. 2010, 62, 259–268. [Google Scholar] [CrossRef]
- Shafie, N.H.; Esa, N.M.; Ithnin, H.; Akim, A.M.; Saad, N.; Pandurangan, A.K. Preventive inositol hxaphosphate extracted from rice bran inhibits colorectal cancer through involvement of Wnt/β-catenin and cox-2 pathways. Biomed. Res. Int. 2013, 2013, 681027. [Google Scholar] [CrossRef] [PubMed]
- Lee, H.J.; Lee, S.A.; Choi, H. Dietary administration of inositol and/or inositol-6-phosphate prevents chemically-induced rat hepatocarcinogenesis. Asian Pac. J. Cancer Prev. 2005, 6, 41–47. [Google Scholar] [PubMed]
- Abdel-Hamid, N.M.; Faddah, L.M.; Al-Rehany, M.A.; Ali, A.H.; Bakeet, A.A. New role of antinutritional factors, phytic acid and catechin in the treatment of CCl4 intoxication. Ann. Hepatol. 2007, 6, 262–266. [Google Scholar] [PubMed]
- Foster, S.R.; Dilworth, L.L.; Thompson, R.K.; Alexander-Lindo, R.L.; Omoruyi, F.O. Effects of combined inositol hexakisphosphate and inositol supplement on antioxidant activity and metabolic enzymes in the liver of streptozotocin-induced type 2 diabetic rats. Chem. Biol. Interact. 2017, 275, 108–115. [Google Scholar] [CrossRef] [PubMed]
- Grenier, B.; Oswald, I.P. Mycotoxin co-contamination of foods and feeds: Meta-analysis of publications describing toxicological interactions. World Mycotoxin J. 2011, 4, 285–313. [Google Scholar] [CrossRef]
- Sedlak, J.; Lindsay, R. Estimation of total, protein-bound, and nonprotein sulfhydryl groups in tissue with Ellman’s reagente. Anal Biochem. 1968, 25, 192–205. [Google Scholar] [CrossRef]
- Guedes, R.P.; Dal Bosco, L.; Teixeira, C.M.; Llesuy, S.; Belló-Klein, A.; Ribeiro, M.F.; Partata, W.A. Neuropathic pain modifies antioxidant activity in rat spinal cord. Neurochem. Res. 2006, 31, 603–609. [Google Scholar] [CrossRef]
- Katalinic, V.; Modun, D.; Music, I.; Boban, M. Gender differences in antioxidant capacity of rat tissues determined by 2,2’-azinobis (3-ethylbenzothialoine 6-sulfonate; ABTS) and ferric reducing antioxidant power (FRAP) assays. Comp. Biochem. Physiol. C Toxicol. Pharmacol. 2015, 140, 47–52. [Google Scholar] [CrossRef]
 ); DON (
  ); FB1 (
  ); DON + FB1 (■); DON + IP6 (
  ); FB1 + IP6 (
  ); DON + FB1 + IP6 (
  ). Mean values with different superscript letters were significantly different (p ≤ 0.05). (C) Control treatment. Hematoxylin-eosin (HE), bar 100 µm. (D) IP6 5 mM treatment. HE, bar 100 µm. (E) DON 10 µM alone: severe villi atrophy and fusion, and loss of the apical enterocytes. HE, bar 50 µm. (F) FB1 alone: severe loss of apical enterocytes. HE, bar 50 µm. (G) DON 10 µM + FB1: severe villi fusion. HE, bar 50 µm. (H) DON 10 µM + FB1: flattened enterocytes (arrow), villi atrophy and loss of enterocytes. HE, bar 100 µm. (I) DON 10 µM + IP6 5 mM: histological aspects similar to the control group. HE, bar 100 µm. (J) FB1 + IP6 5 mM: histological aspects similar to the control group. HE, bar 100 µm. (K) DON 10 µM plus FB1 + IP6 5 mM: histological aspects similar to the control group. HE, bar 100 µm.
); DON ( ); FB1 ( ); DON + FB1 (■); DON + IP6 ( ); FB1 + IP6 ( ); DON + FB1 + IP6 ( ). Mean values with different superscript letters were significantly different (p ≤ 0.05). (C) Control treatment. Hematoxylin-eosin (HE), bar 100 µm. (D) IP6 5 mM treatment. HE, bar 100 µm. (E) DON 10 µM alone: severe villi atrophy and fusion, and loss of the apical enterocytes. HE, bar 50 µm. (F) FB1 alone: severe loss of apical enterocytes. HE, bar 50 µm. (G) DON 10 µM + FB1: severe villi fusion. HE, bar 50 µm. (H) DON 10 µM + FB1: flattened enterocytes (arrow), villi atrophy and loss of enterocytes. HE, bar 100 µm. (I) DON 10 µM + IP6 5 mM: histological aspects similar to the control group. HE, bar 100 µm. (J) FB1 + IP6 5 mM: histological aspects similar to the control group. HE, bar 100 µm. (K) DON 10 µM plus FB1 + IP6 5 mM: histological aspects similar to the control group. HE, bar 100 µm.
). Mean values with different superscript letters were significantly different (p ≤ 0.05). (C) Control treatment. Hematoxylin-eosin (HE), bar 100 µm. (D) IP6 5 mM treatment. HE, bar 100 µm. (E) DON 10 µM alone: severe villi atrophy and fusion, and loss of the apical enterocytes. HE, bar 50 µm. (F) FB1 alone: severe loss of apical enterocytes. HE, bar 50 µm. (G) DON 10 µM + FB1: severe villi fusion. HE, bar 50 µm. (H) DON 10 µM + FB1: flattened enterocytes (arrow), villi atrophy and loss of enterocytes. HE, bar 100 µm. (I) DON 10 µM + IP6 5 mM: histological aspects similar to the control group. HE, bar 100 µm. (J) FB1 + IP6 5 mM: histological aspects similar to the control group. HE, bar 100 µm. (K) DON 10 µM plus FB1 + IP6 5 mM: histological aspects similar to the control group. HE, bar 100 µm.
); DON ( ); FB1 ( ); DON + FB1 (■); DON + IP6 ( ); FB1 + IP6 ( ); DON + FB1 + IP6 ( ). Mean values with different superscript letters were significantly different (p ≤ 0.05). (C) Control treatment. Hematoxylin-eosin (HE), bar 100 µm. (D) IP6 5 mM treatment. HE, bar 100 µm. (E) DON 10 µM alone: severe villi atrophy and fusion, and loss of the apical enterocytes. HE, bar 50 µm. (F) FB1 alone: severe loss of apical enterocytes. HE, bar 50 µm. (G) DON 10 µM + FB1: severe villi fusion. HE, bar 50 µm. (H) DON 10 µM + FB1: flattened enterocytes (arrow), villi atrophy and loss of enterocytes. HE, bar 100 µm. (I) DON 10 µM + IP6 5 mM: histological aspects similar to the control group. HE, bar 100 µm. (J) FB1 + IP6 5 mM: histological aspects similar to the control group. HE, bar 100 µm. (K) DON 10 µM plus FB1 + IP6 5 mM: histological aspects similar to the control group. HE, bar 100 µm. ); deoxynivalenol (DON) ( ); fumonisin B1 (FB1) ( ); DON + FB1 (■); DON + IP6 ( ); FB1 + IP6 ( ); DON + FB1 + IP6 ( ). Mean values with different superscript letters were significantly different (p ≤ 0.05).
); deoxynivalenol (DON) ( ); fumonisin B1 (FB1) ( ); DON + FB1 (■); DON + IP6 ( ); FB1 + IP6 ( ); DON + FB1 + IP6 ( ). Mean values with different superscript letters were significantly different (p ≤ 0.05).
); deoxynivalenol (DON) ( ); fumonisin B1 (FB1) ( ); DON + FB1 (■); DON + IP6 ( ); FB1 + IP6 ( ); DON + FB1 + IP6 ( ). Mean values with different superscript letters were significantly different (p ≤ 0.05). ); deoxynivalenol (DON) ( ); fumonisin B1 (FB1) ( ); DON + FB1 (■); DON + IP6 ( ); FB1 + IP6 ( ); DON + FB1 + IP6 ( ). (A) Mean number of Ccasp-3 immunostained cells per field on explants exposed to different treatments. Mean values with different superscript letters were significantly different (p ≤ 0.05). (B) Control treatment: mild Ccasp-3 cytoplasmic immunostaining in crypt cells. (C) DON 10 µM + FB1 70 µM: diffuse Ccasp-3 cytoplasmic immunostaining in crypt cells. (D) DON 10 µM + FB1 70 µM + IP6 5 mM: decrease in Ccasp-3 cytoplasmic immunostaining in crypt cells. (E) Mean number of Ki-67 immunostained cells per field on explants exposed to different treatments. Mean values with different superscript letters were significantly different (p ≤ 0.05). (F) Control treatment: mild Ki-67 nuclear immunostaining in crypt cells. (G) DON 10 µM + FB1 70 µM: diffuse Ki-67 nuclear immunostaining in crypt cells. (H) DON 10 µM + FB1 70 µM + IP6 5 mM: decrease in Ki-67 nuclear immunostaining in crypt cells. (B–D; F–H: immunoperoxidase method, bar 25 µm).
); deoxynivalenol (DON) ( ); fumonisin B1 (FB1) ( ); DON + FB1 (■); DON + IP6 ( ); FB1 + IP6 ( ); DON + FB1 + IP6 ( ). (A) Mean number of Ccasp-3 immunostained cells per field on explants exposed to different treatments. Mean values with different superscript letters were significantly different (p ≤ 0.05). (B) Control treatment: mild Ccasp-3 cytoplasmic immunostaining in crypt cells. (C) DON 10 µM + FB1 70 µM: diffuse Ccasp-3 cytoplasmic immunostaining in crypt cells. (D) DON 10 µM + FB1 70 µM + IP6 5 mM: decrease in Ccasp-3 cytoplasmic immunostaining in crypt cells. (E) Mean number of Ki-67 immunostained cells per field on explants exposed to different treatments. Mean values with different superscript letters were significantly different (p ≤ 0.05). (F) Control treatment: mild Ki-67 nuclear immunostaining in crypt cells. (G) DON 10 µM + FB1 70 µM: diffuse Ki-67 nuclear immunostaining in crypt cells. (H) DON 10 µM + FB1 70 µM + IP6 5 mM: decrease in Ki-67 nuclear immunostaining in crypt cells. (B–D; F–H: immunoperoxidase method, bar 25 µm).
); deoxynivalenol (DON) ( ); fumonisin B1 (FB1) ( ); DON + FB1 (■); DON + IP6 ( ); FB1 + IP6 ( ); DON + FB1 + IP6 ( ). (A) Mean number of Ccasp-3 immunostained cells per field on explants exposed to different treatments. Mean values with different superscript letters were significantly different (p ≤ 0.05). (B) Control treatment: mild Ccasp-3 cytoplasmic immunostaining in crypt cells. (C) DON 10 µM + FB1 70 µM: diffuse Ccasp-3 cytoplasmic immunostaining in crypt cells. (D) DON 10 µM + FB1 70 µM + IP6 5 mM: decrease in Ccasp-3 cytoplasmic immunostaining in crypt cells. (E) Mean number of Ki-67 immunostained cells per field on explants exposed to different treatments. Mean values with different superscript letters were significantly different (p ≤ 0.05). (F) Control treatment: mild Ki-67 nuclear immunostaining in crypt cells. (G) DON 10 µM + FB1 70 µM: diffuse Ki-67 nuclear immunostaining in crypt cells. (H) DON 10 µM + FB1 70 µM + IP6 5 mM: decrease in Ki-67 nuclear immunostaining in crypt cells. (B–D; F–H: immunoperoxidase method, bar 25 µm). ); deoxynivalenol (DON) ( ); fumonisin B1 (FB1) ( ); DON + FB1 (■); DON + IP6 ( ); FB1 + IP6 ( ); DON + FB1 + IP6 ( ). (A) Mean of E-cadherin positive immunostaining per fields on explants exposed to different treatments. Mean values with different superscript letters were significantly different (p ≤ 0.05). (B) Control treatment: strong and homogeneous E-cadherin immunostaining in epithelial cells. Bar 50 µm. (C) DON 10 µM: mild and non-homogeneous E-cadherin immunostaining in epithelial cells. Bar 25 µm. (D) DON 10 µM + IP6 5 mM: strong and homogeneous E-cadherin immunostaining in epithelial cells similar to control treatment. Bar 50 µm. (B–D: immunoperoxidase method). (E) Mean of cox-2 positive immunostaining per fields on explants exposed to different treatments. Mean values with different superscript letters were significantly different (p ≤ 0.05). (F) Control treatment: mild cox-2 cytoplasmic immunostaining in crypt cells. (G) DON 10 µM: diffuse and strong cox-2 cytoplasmic immunostaining in crypt cells. (H) DON 10 µM + IP6 5 mM: decrease in cox-2 cytoplasmic immunostaining in crypt cells similar to control treatment. (F–H: immunoperoxidase method, bar 25 µm).
); deoxynivalenol (DON) ( ); fumonisin B1 (FB1) ( ); DON + FB1 (■); DON + IP6 ( ); FB1 + IP6 ( ); DON + FB1 + IP6 ( ). (A) Mean of E-cadherin positive immunostaining per fields on explants exposed to different treatments. Mean values with different superscript letters were significantly different (p ≤ 0.05). (B) Control treatment: strong and homogeneous E-cadherin immunostaining in epithelial cells. Bar 50 µm. (C) DON 10 µM: mild and non-homogeneous E-cadherin immunostaining in epithelial cells. Bar 25 µm. (D) DON 10 µM + IP6 5 mM: strong and homogeneous E-cadherin immunostaining in epithelial cells similar to control treatment. Bar 50 µm. (B–D: immunoperoxidase method). (E) Mean of cox-2 positive immunostaining per fields on explants exposed to different treatments. Mean values with different superscript letters were significantly different (p ≤ 0.05). (F) Control treatment: mild cox-2 cytoplasmic immunostaining in crypt cells. (G) DON 10 µM: diffuse and strong cox-2 cytoplasmic immunostaining in crypt cells. (H) DON 10 µM + IP6 5 mM: decrease in cox-2 cytoplasmic immunostaining in crypt cells similar to control treatment. (F–H: immunoperoxidase method, bar 25 µm).
); deoxynivalenol (DON) ( ); fumonisin B1 (FB1) ( ); DON + FB1 (■); DON + IP6 ( ); FB1 + IP6 ( ); DON + FB1 + IP6 ( ). (A) Mean of E-cadherin positive immunostaining per fields on explants exposed to different treatments. Mean values with different superscript letters were significantly different (p ≤ 0.05). (B) Control treatment: strong and homogeneous E-cadherin immunostaining in epithelial cells. Bar 50 µm. (C) DON 10 µM: mild and non-homogeneous E-cadherin immunostaining in epithelial cells. Bar 25 µm. (D) DON 10 µM + IP6 5 mM: strong and homogeneous E-cadherin immunostaining in epithelial cells similar to control treatment. Bar 50 µm. (B–D: immunoperoxidase method). (E) Mean of cox-2 positive immunostaining per fields on explants exposed to different treatments. Mean values with different superscript letters were significantly different (p ≤ 0.05). (F) Control treatment: mild cox-2 cytoplasmic immunostaining in crypt cells. (G) DON 10 µM: diffuse and strong cox-2 cytoplasmic immunostaining in crypt cells. (H) DON 10 µM + IP6 5 mM: decrease in cox-2 cytoplasmic immunostaining in crypt cells similar to control treatment. (F–H: immunoperoxidase method, bar 25 µm).

| Treatment | GSH (nmol/mg of Protein) | TBARS (ΔOD A535 − A532/mg Protein) | ABTS (nmol/Trolox Eq/mg of Protein) | FRAP (nmol Trolox Eq/mg of Protein) |
|---|---|---|---|---|
| Control | 21.79 ± 0.49 a | 0.35 ± 0.04 bc | 60.70 ± 6.65 c | 60.23 ± 1.68 bcd |
| IP6 | 23.24 ± 2.39 a | 0.21 ± 0.02 c | 64.00 ± 8.19 bc | 57.14 ± 2.77 bcd |
| DON | 8.27 ± 2.25 b | 0.58 ± 0.05 a | 40.26 ± 5.93 d | 51.40 ± 2.90 d |
| DON + IP6 | 19.17 ± 2.37 a | 0.19 ± 0.02 c | 67.60 ± 4.19 abc | 66.15 ± 2.31 abc |
| FB1 | 10.50 ± 3.66 b | 0.54 ± 0.03 a | 39.14 ± 8.66 d | 58.99 ± 5.25 bcd |
| FB1 + IP6 | 21.56 ± 1.67 a | 0.22 ± 0.03 c | 81.00 ± 2.64 ab | 71.77 ± 1.91 a |
| DON + FB1 | 11.67 ± 1.64 b | 0.43 ± 0.06 ab | 41.83 ± 1.09 d | 55.77 ± 5.35 cd |
| DON + FB1 + IP6 | 19.26 ± 1.52 a | 0.23 ± 0.02 c | 85.75 ± 5.60 a | 67.71 ± 8.86 ab |
© 2019 by the authors. Licensee MDPI, Basel, Switzerland. This article is an open access article distributed under the terms and conditions of the Creative Commons Attribution (CC BY) license (http://creativecommons.org/licenses/by/4.0/).
Share and Cite
Da Silva, E.O.; Gerez, J.R.; Hohmann, M.S.N.; Verri, W.A., Jr.; Bracarense, A.P.F.R.L. Phytic Acid Decreases Oxidative Stress and Intestinal Lesions Induced by Fumonisin B1 and Deoxynivalenol in Intestinal Explants of Pigs. Toxins 2019, 11, 18. https://0-doi-org.brum.beds.ac.uk/10.3390/toxins11010018
Da Silva EO, Gerez JR, Hohmann MSN, Verri WA Jr., Bracarense APFRL. Phytic Acid Decreases Oxidative Stress and Intestinal Lesions Induced by Fumonisin B1 and Deoxynivalenol in Intestinal Explants of Pigs. Toxins. 2019; 11(1):18. https://0-doi-org.brum.beds.ac.uk/10.3390/toxins11010018
Chicago/Turabian StyleDa Silva, Elisângela O., Juliana R. Gerez, Miriam S. N. Hohmann, Waldiceu A. Verri, Jr., and Ana Paula F. R. L. Bracarense. 2019. "Phytic Acid Decreases Oxidative Stress and Intestinal Lesions Induced by Fumonisin B1 and Deoxynivalenol in Intestinal Explants of Pigs" Toxins 11, no. 1: 18. https://0-doi-org.brum.beds.ac.uk/10.3390/toxins11010018