Lipophilic Toxins in Galicia (NW Spain) between 2014 and 2017: Incidence on the Main Molluscan Species and Analysis of the Monitoring Efficiency


Abstract
:1. Introduction
2. Results
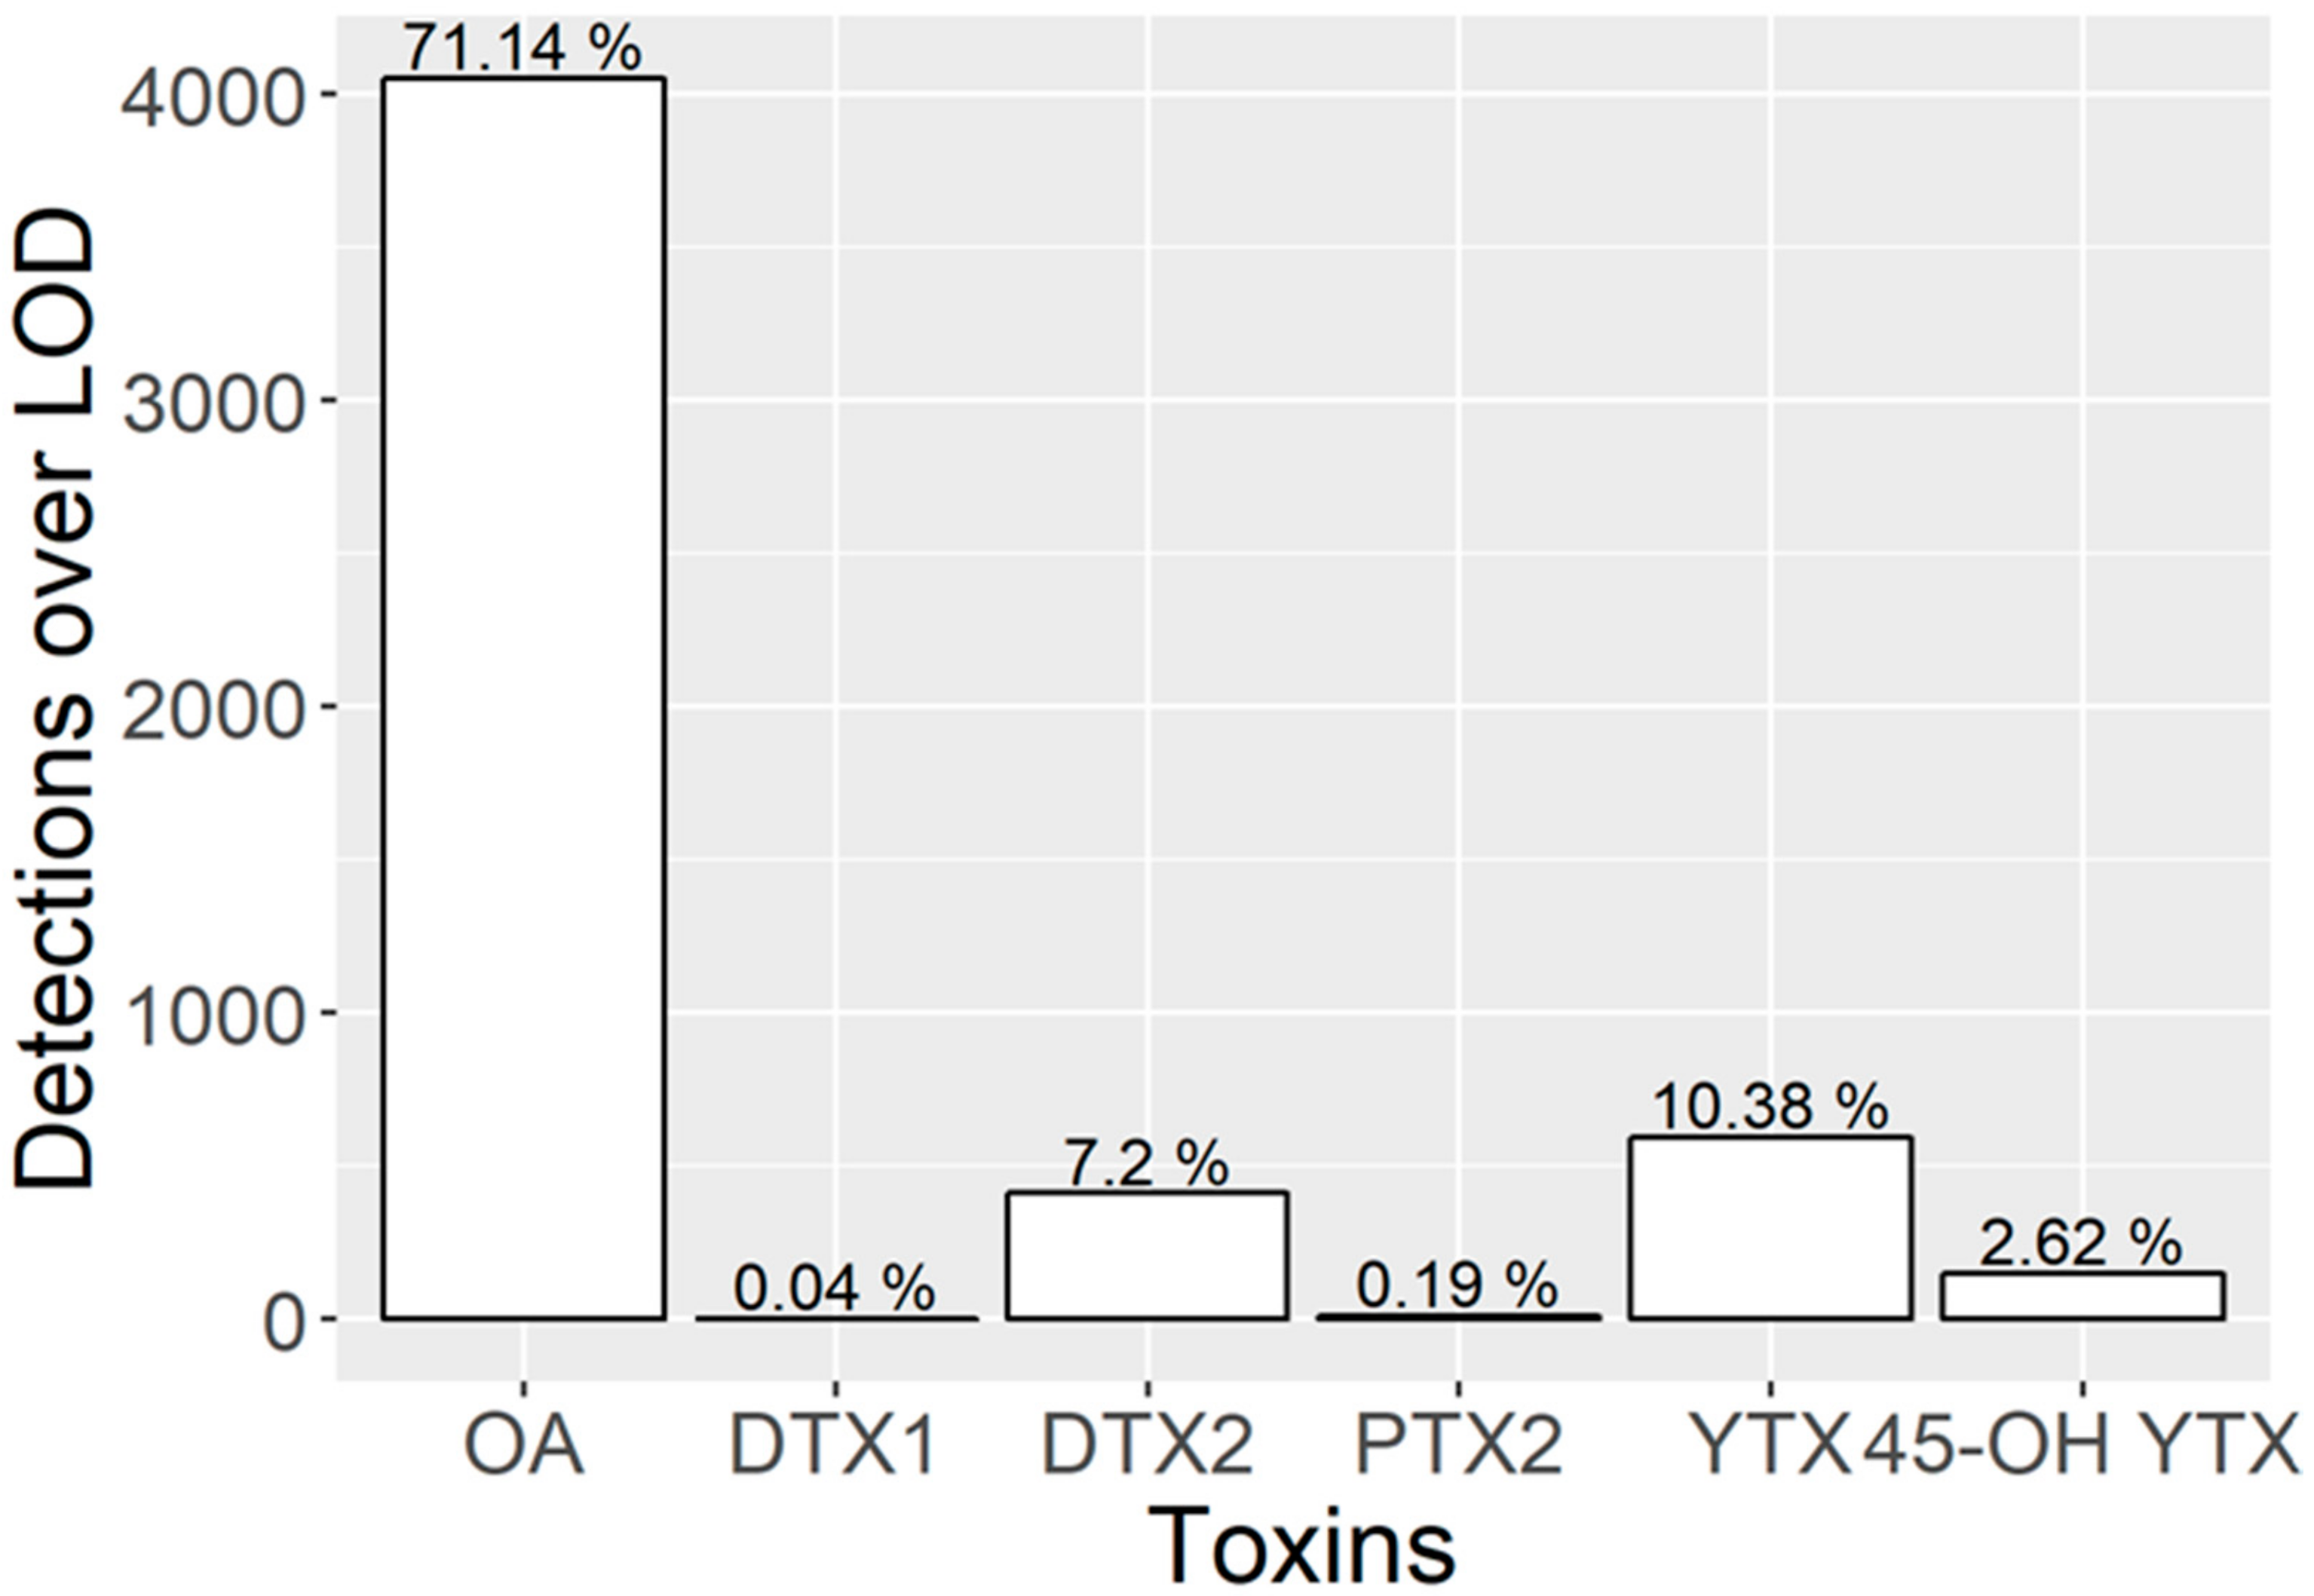
2.1. Toxin Profiles
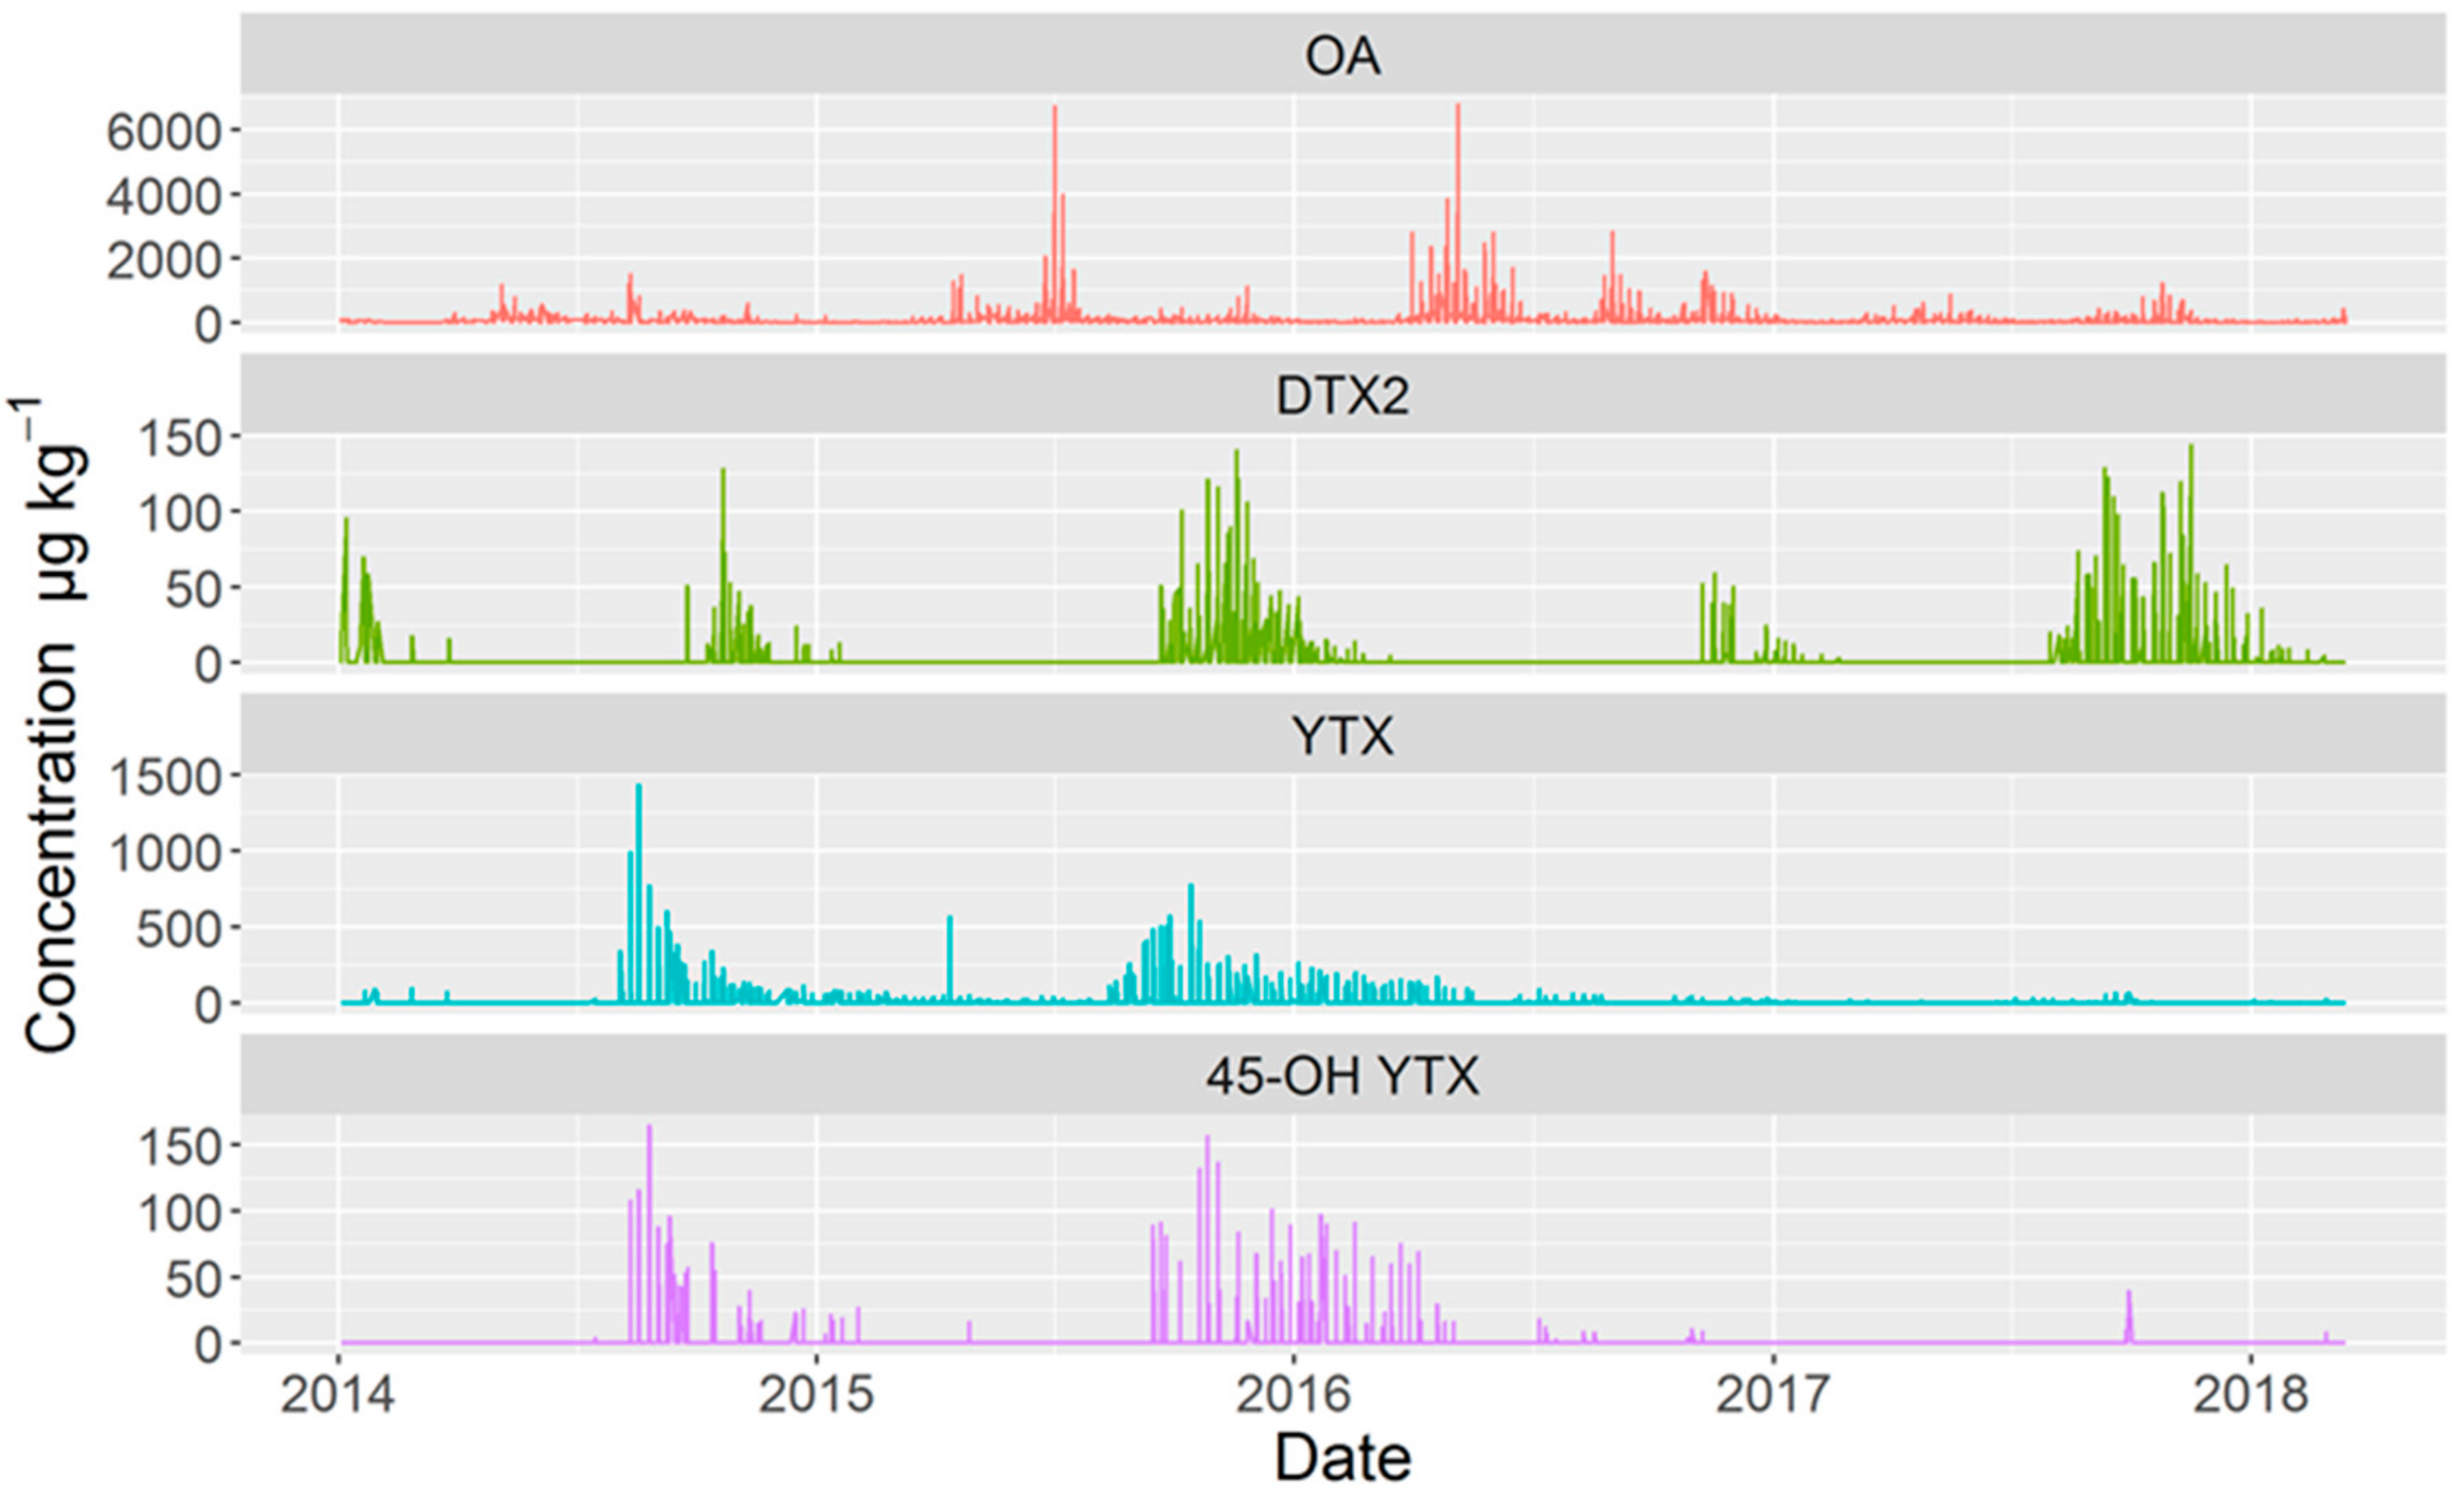
2.2. Temporal Variation
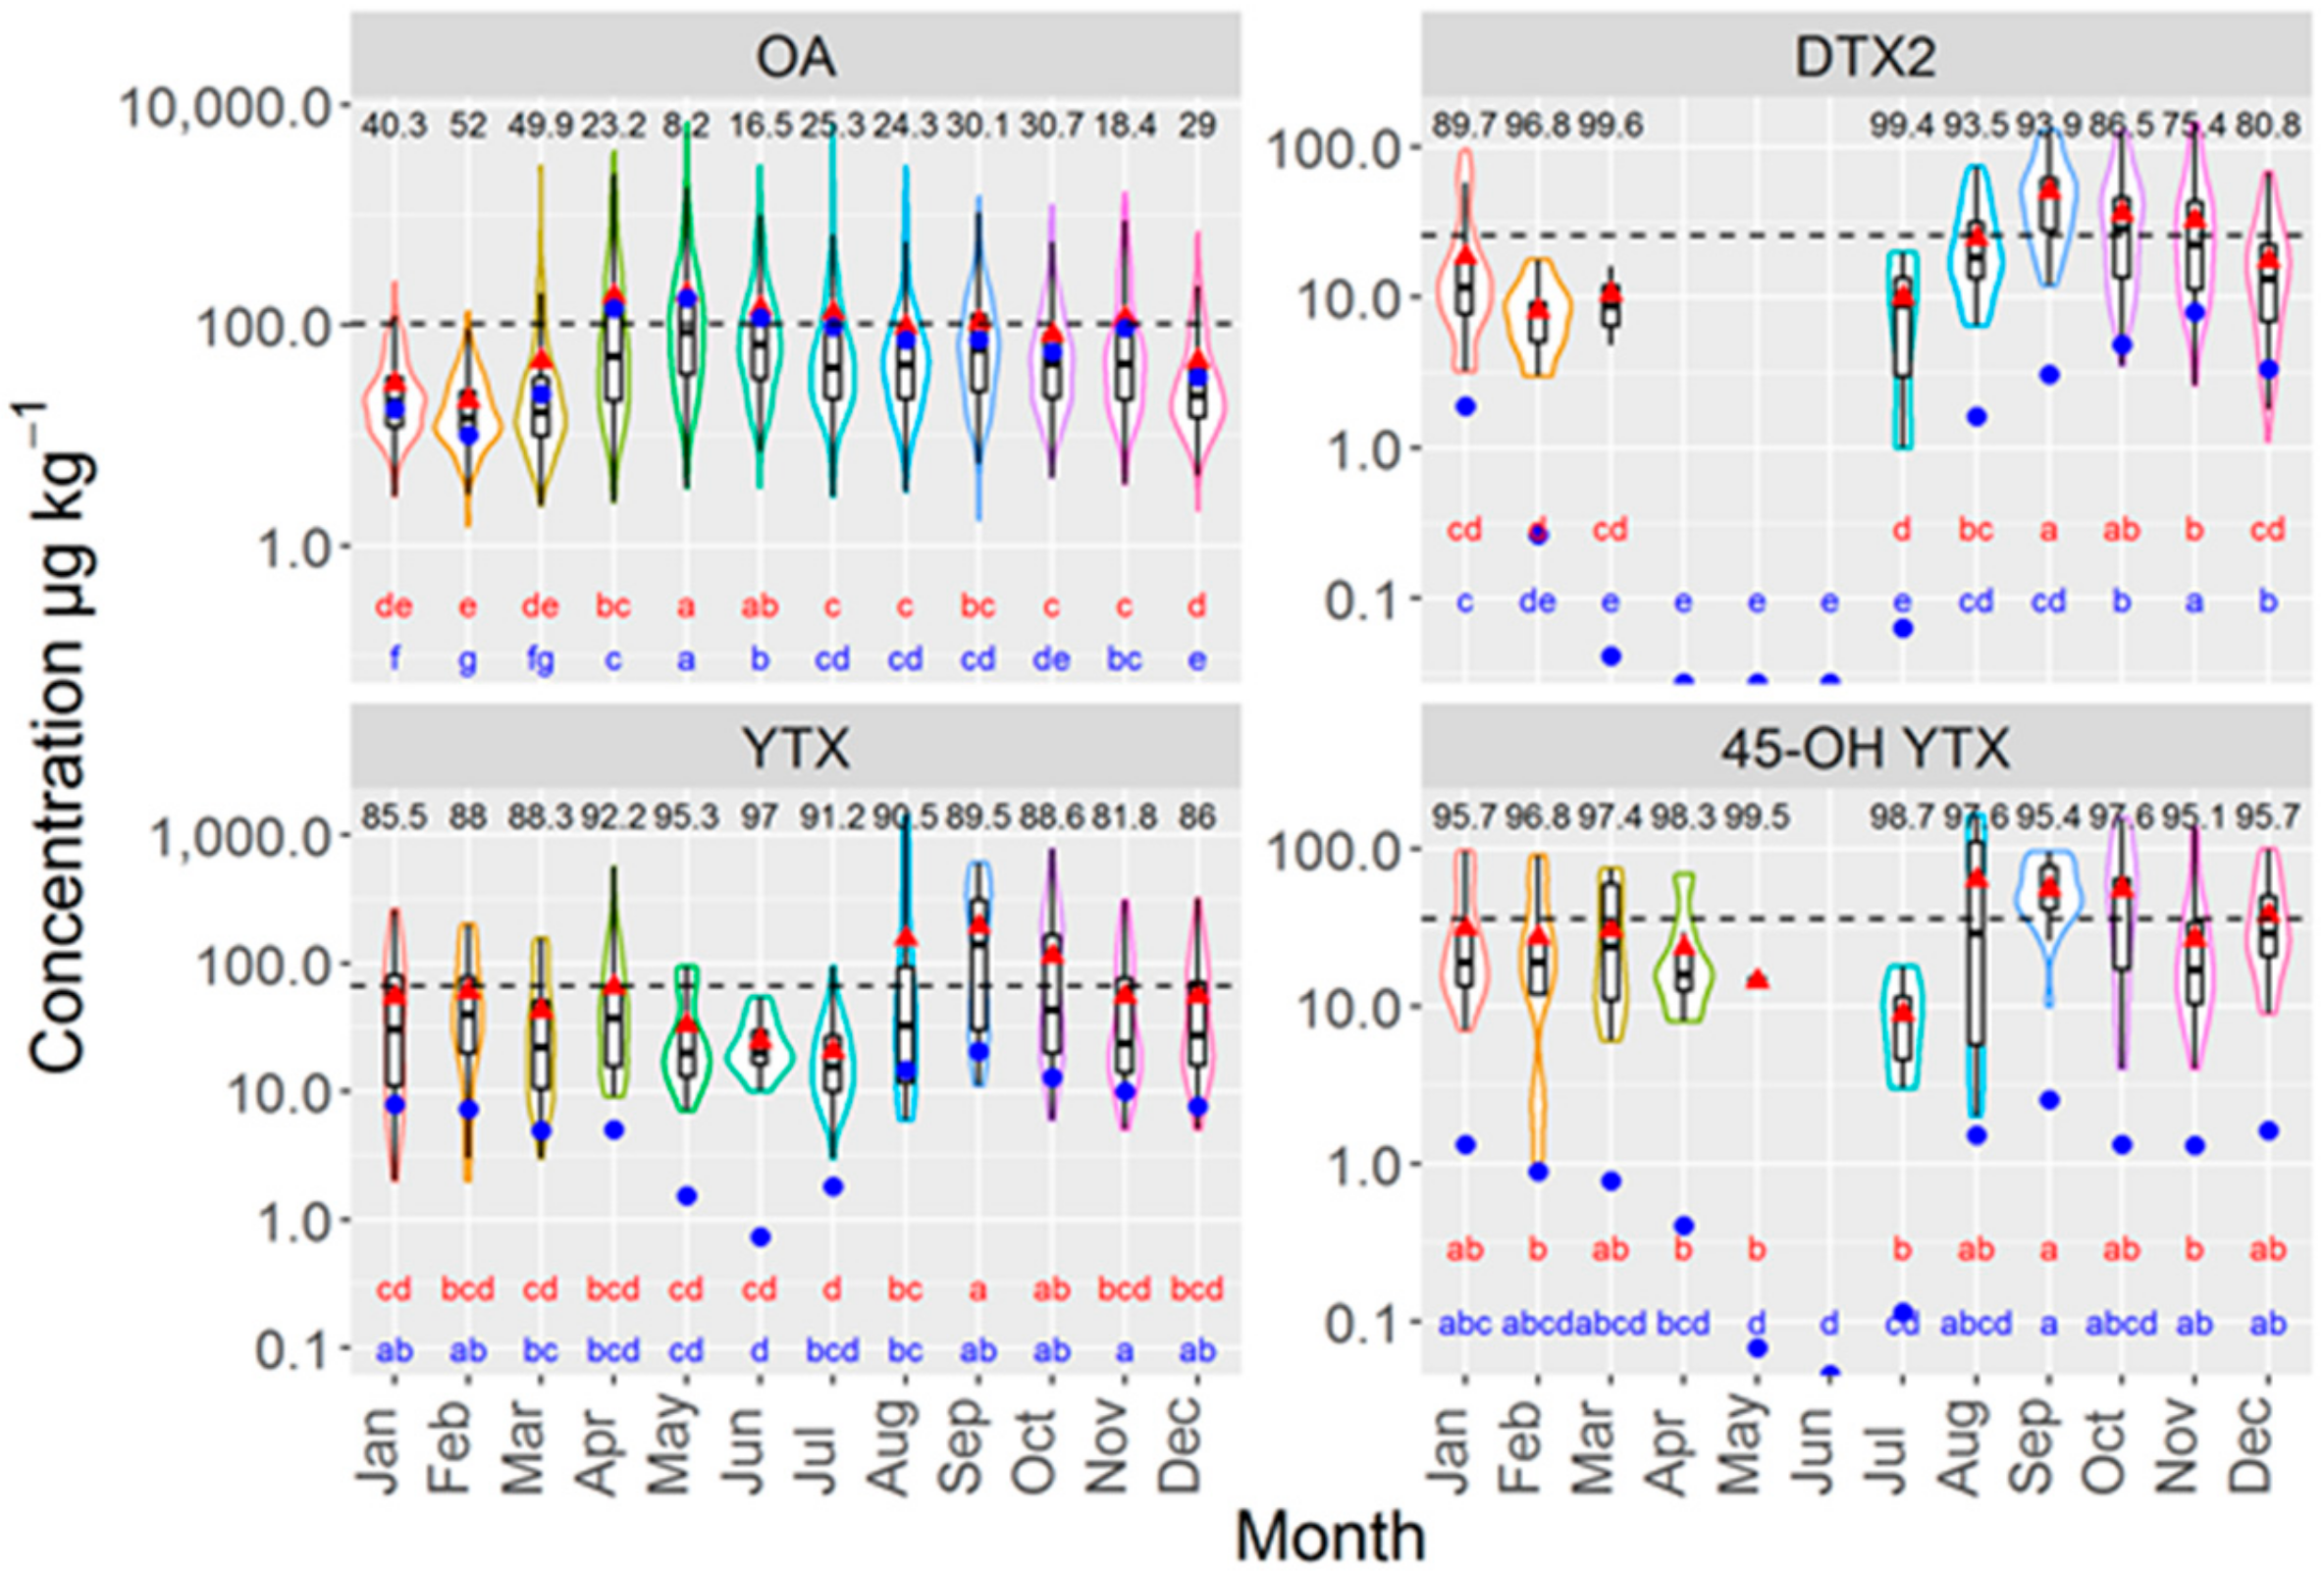
2.3. Annual and Seasonal Variation
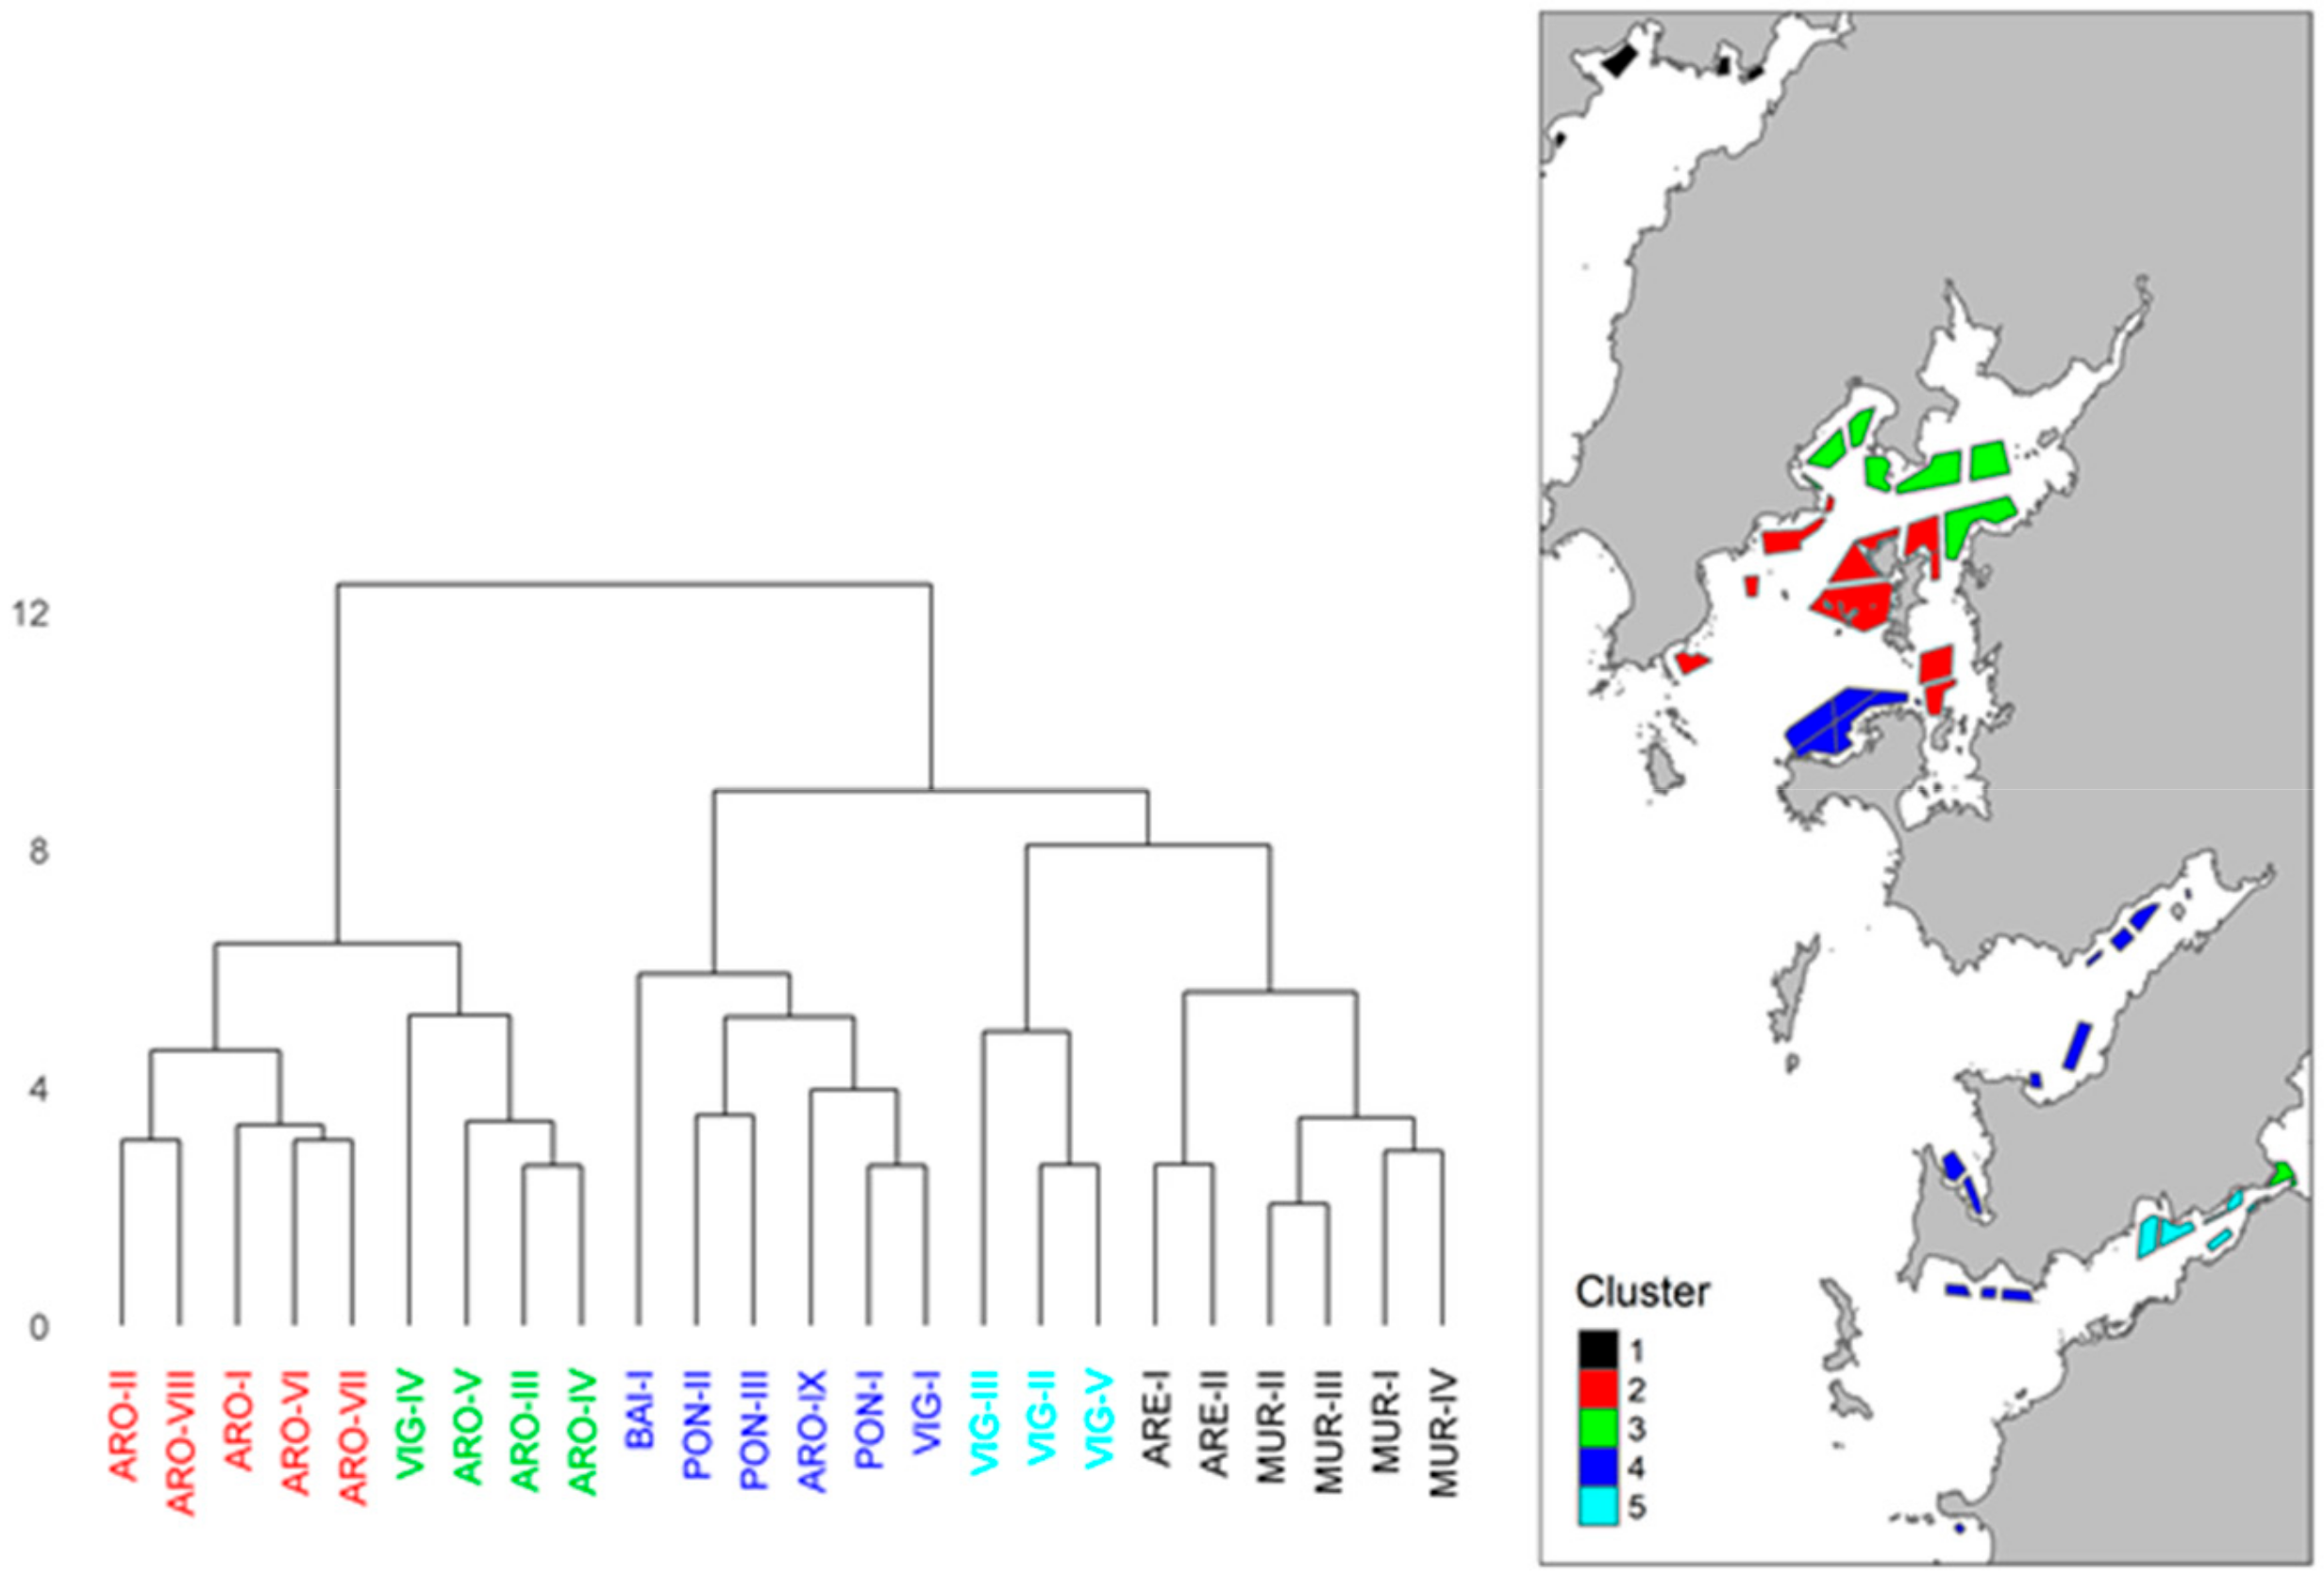
2.4. Geographical Distribution of the Toxins Detected in Raft Mussels
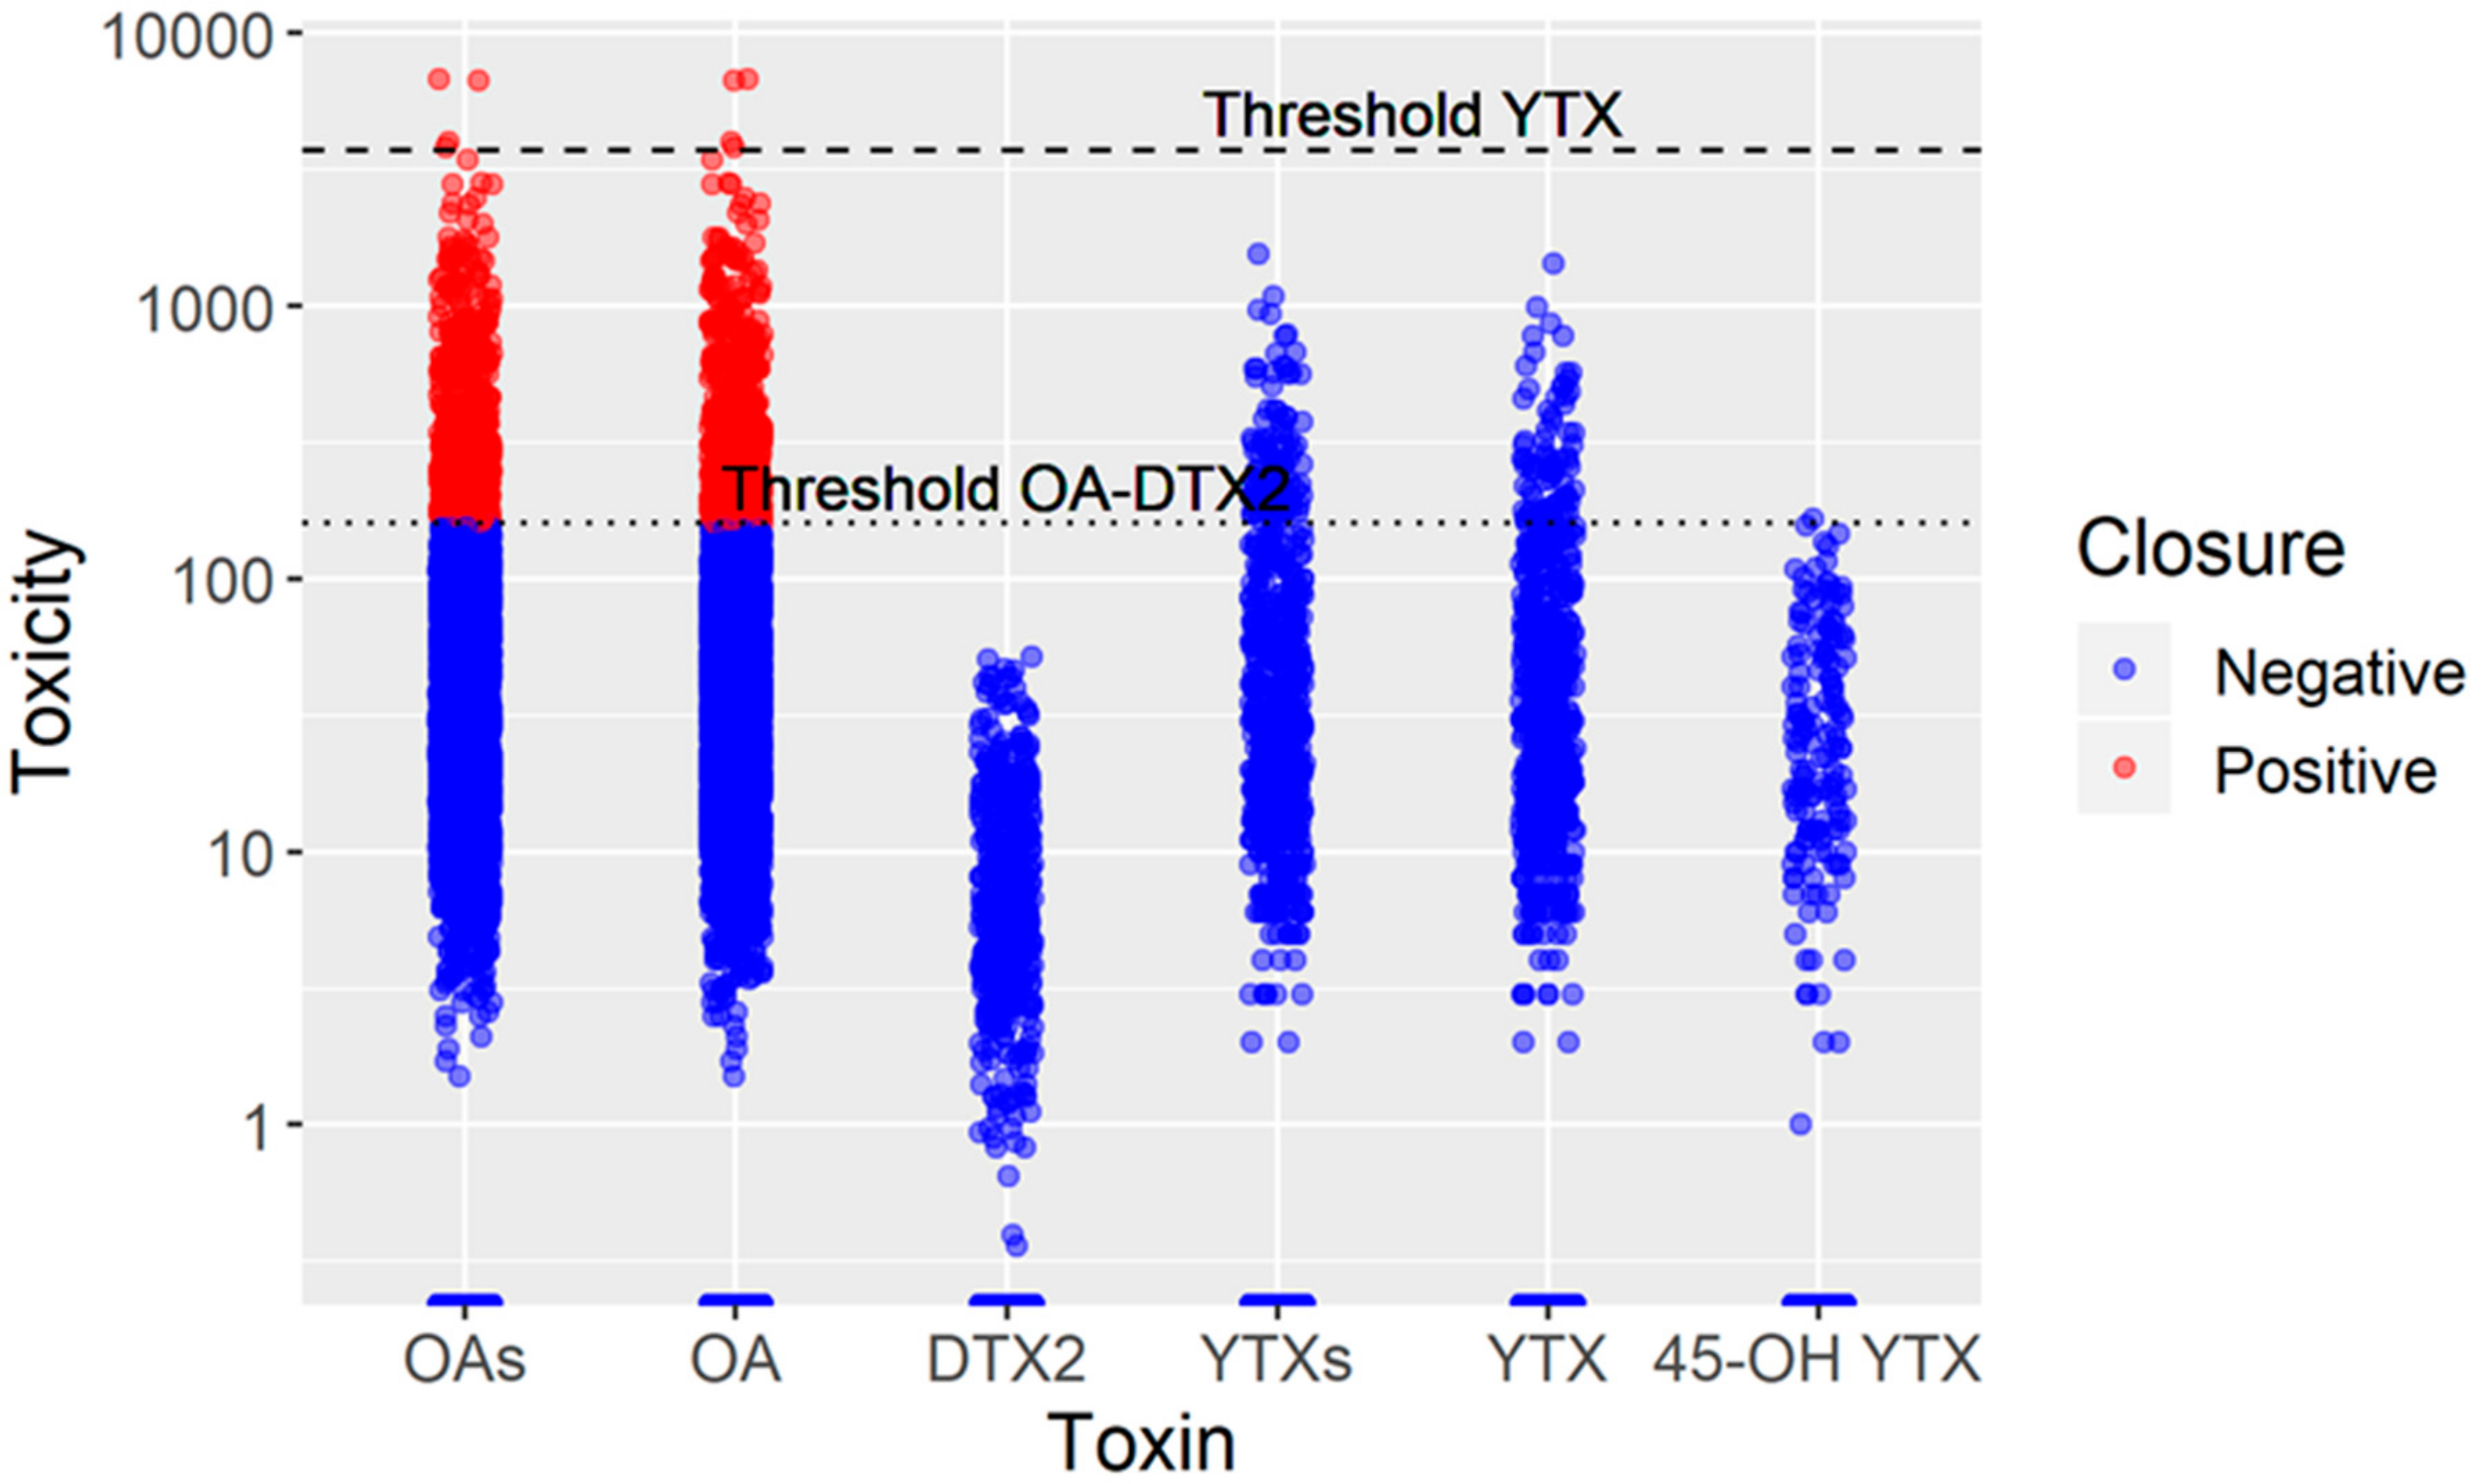
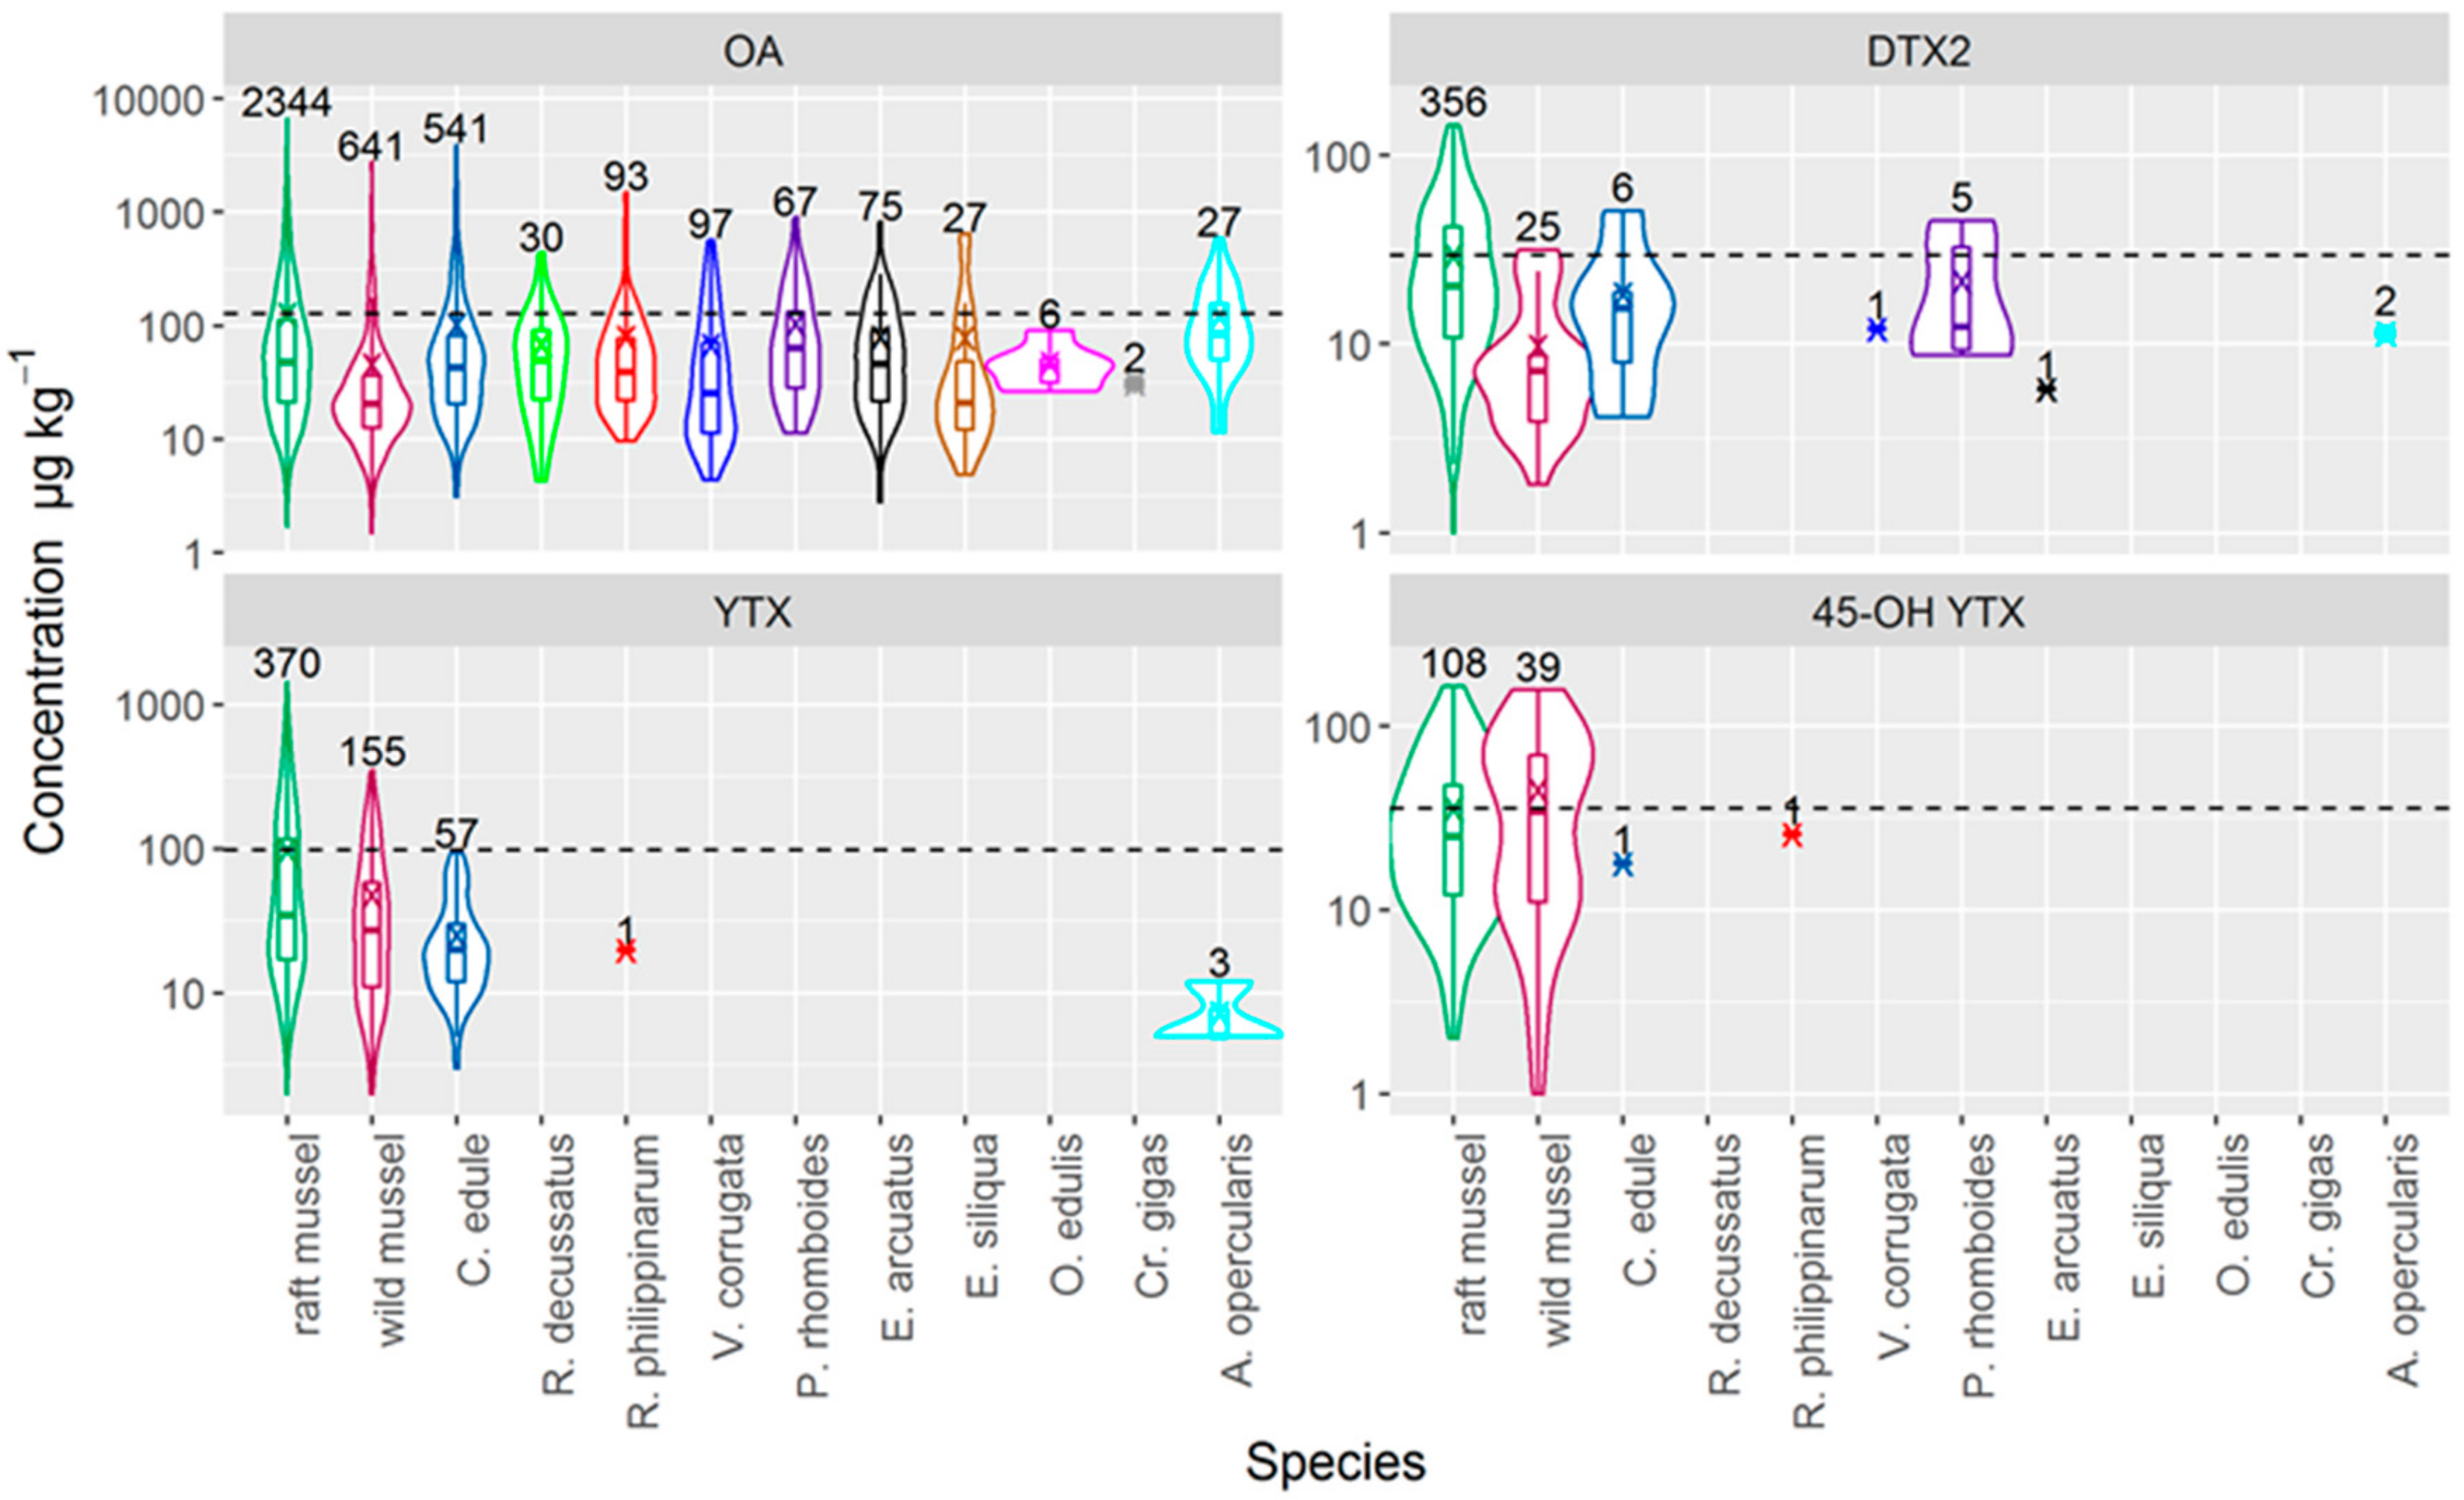
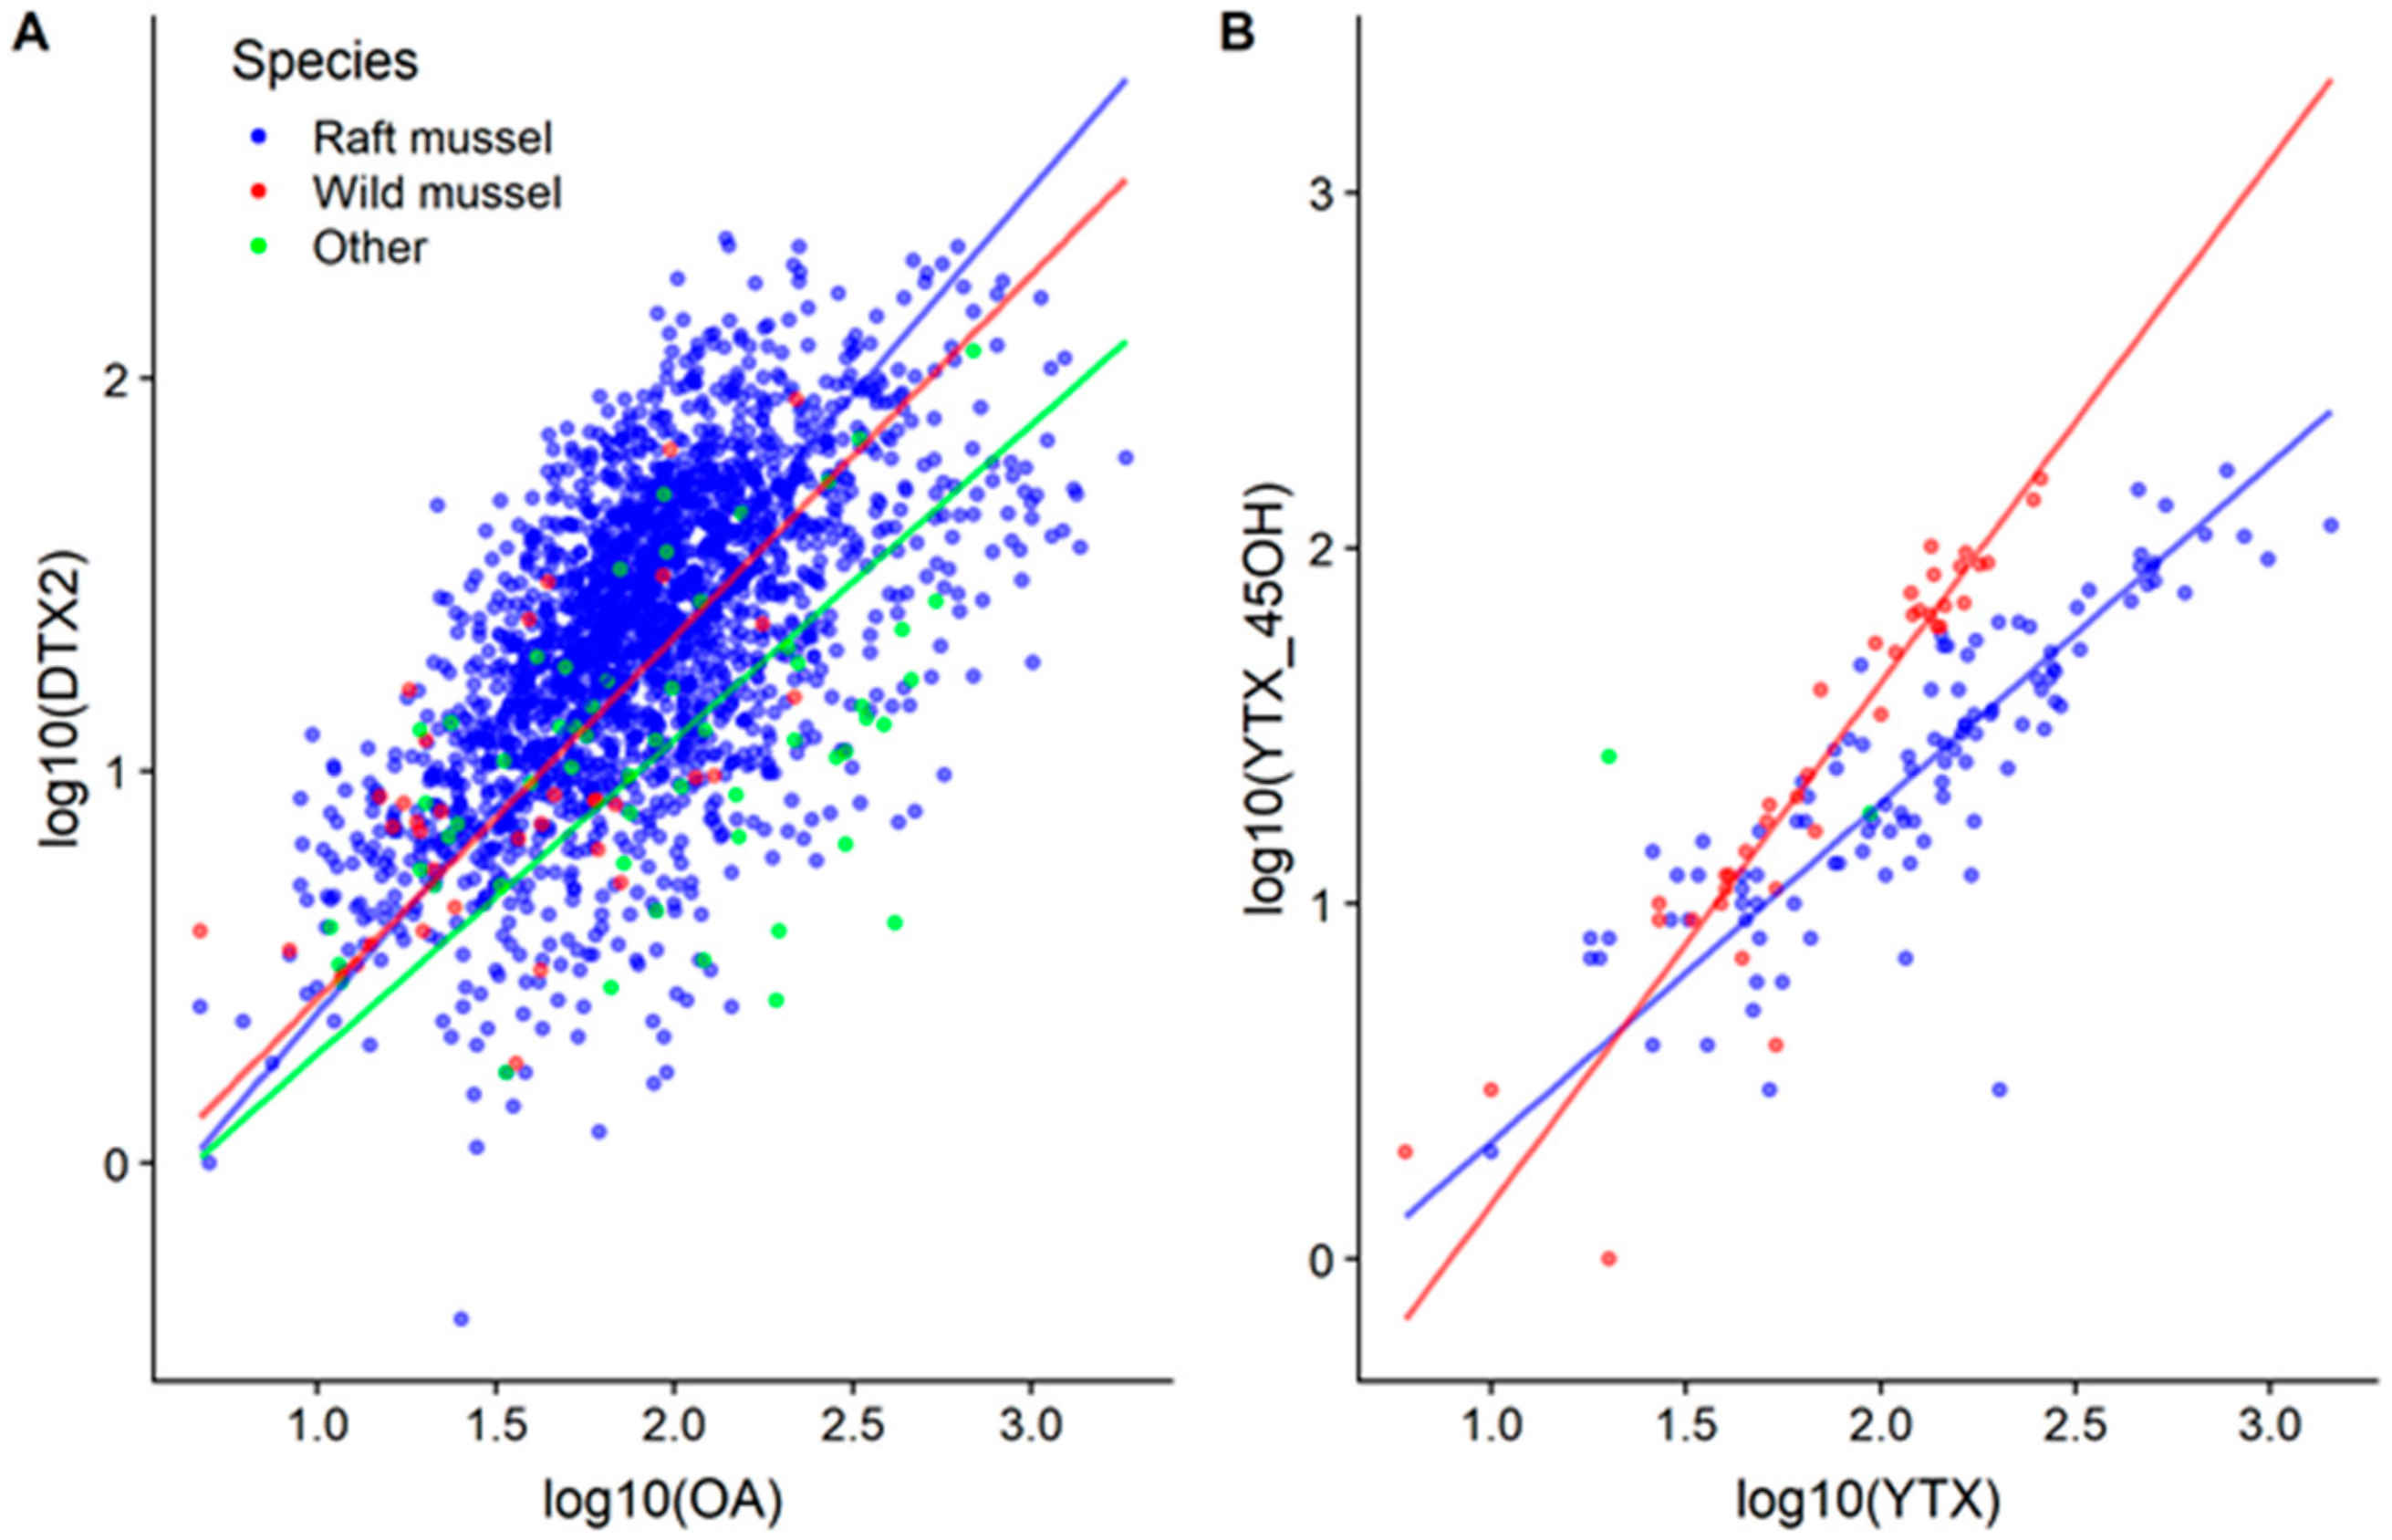
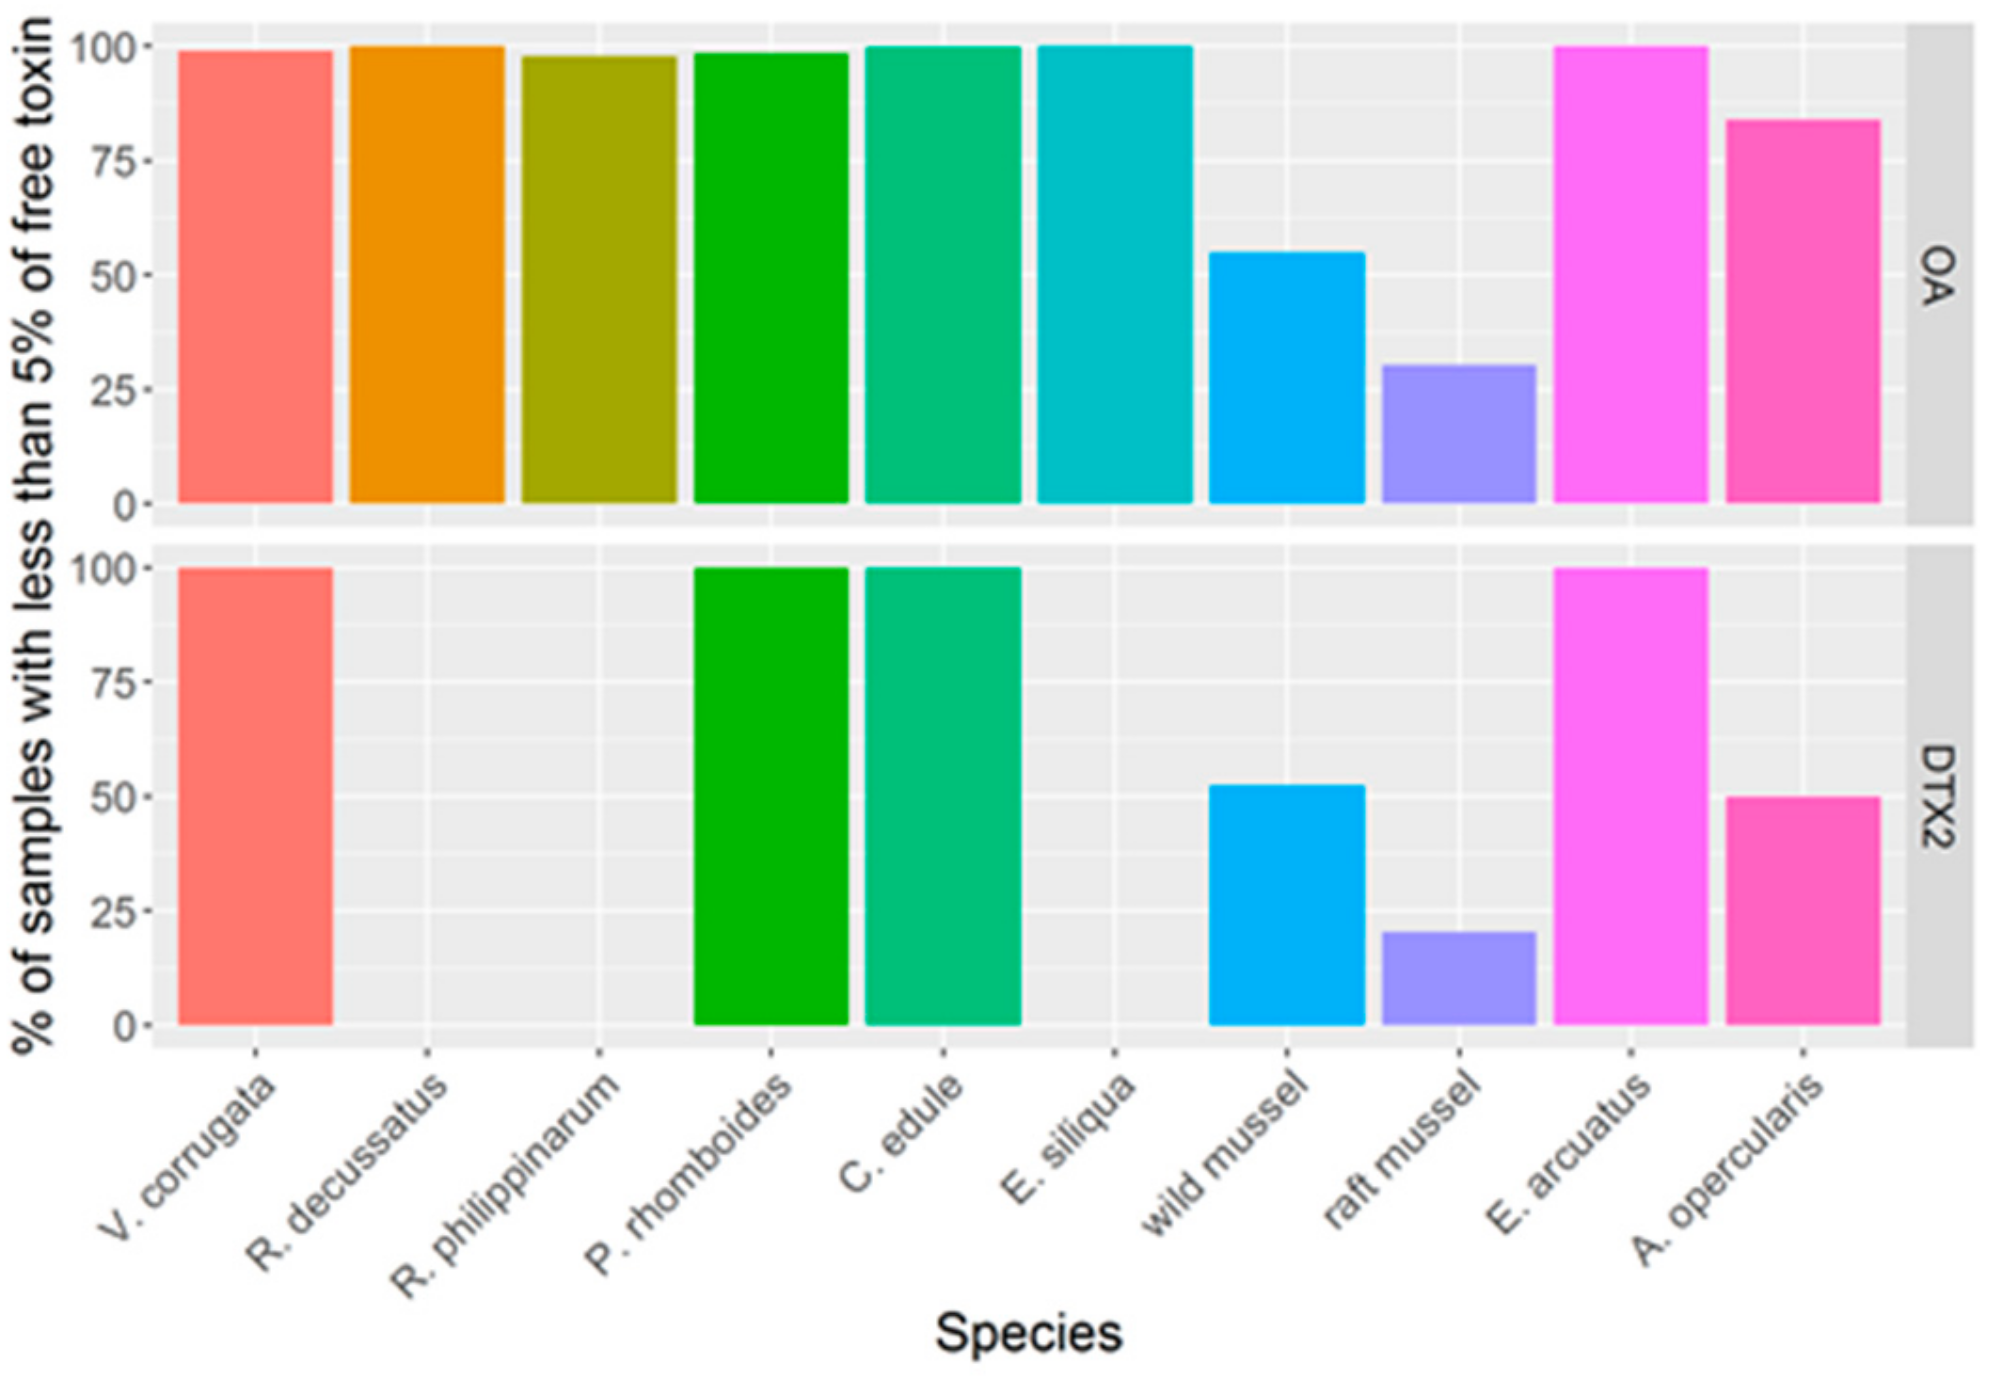
2.5. OA, DTX2, YTXs and their Biotransformations
2.6. Timing of Episode Onset
2.7. Apparent Uptake and Depuration Rates by Cultured Mussel
2.7.1. Differences between Toxins
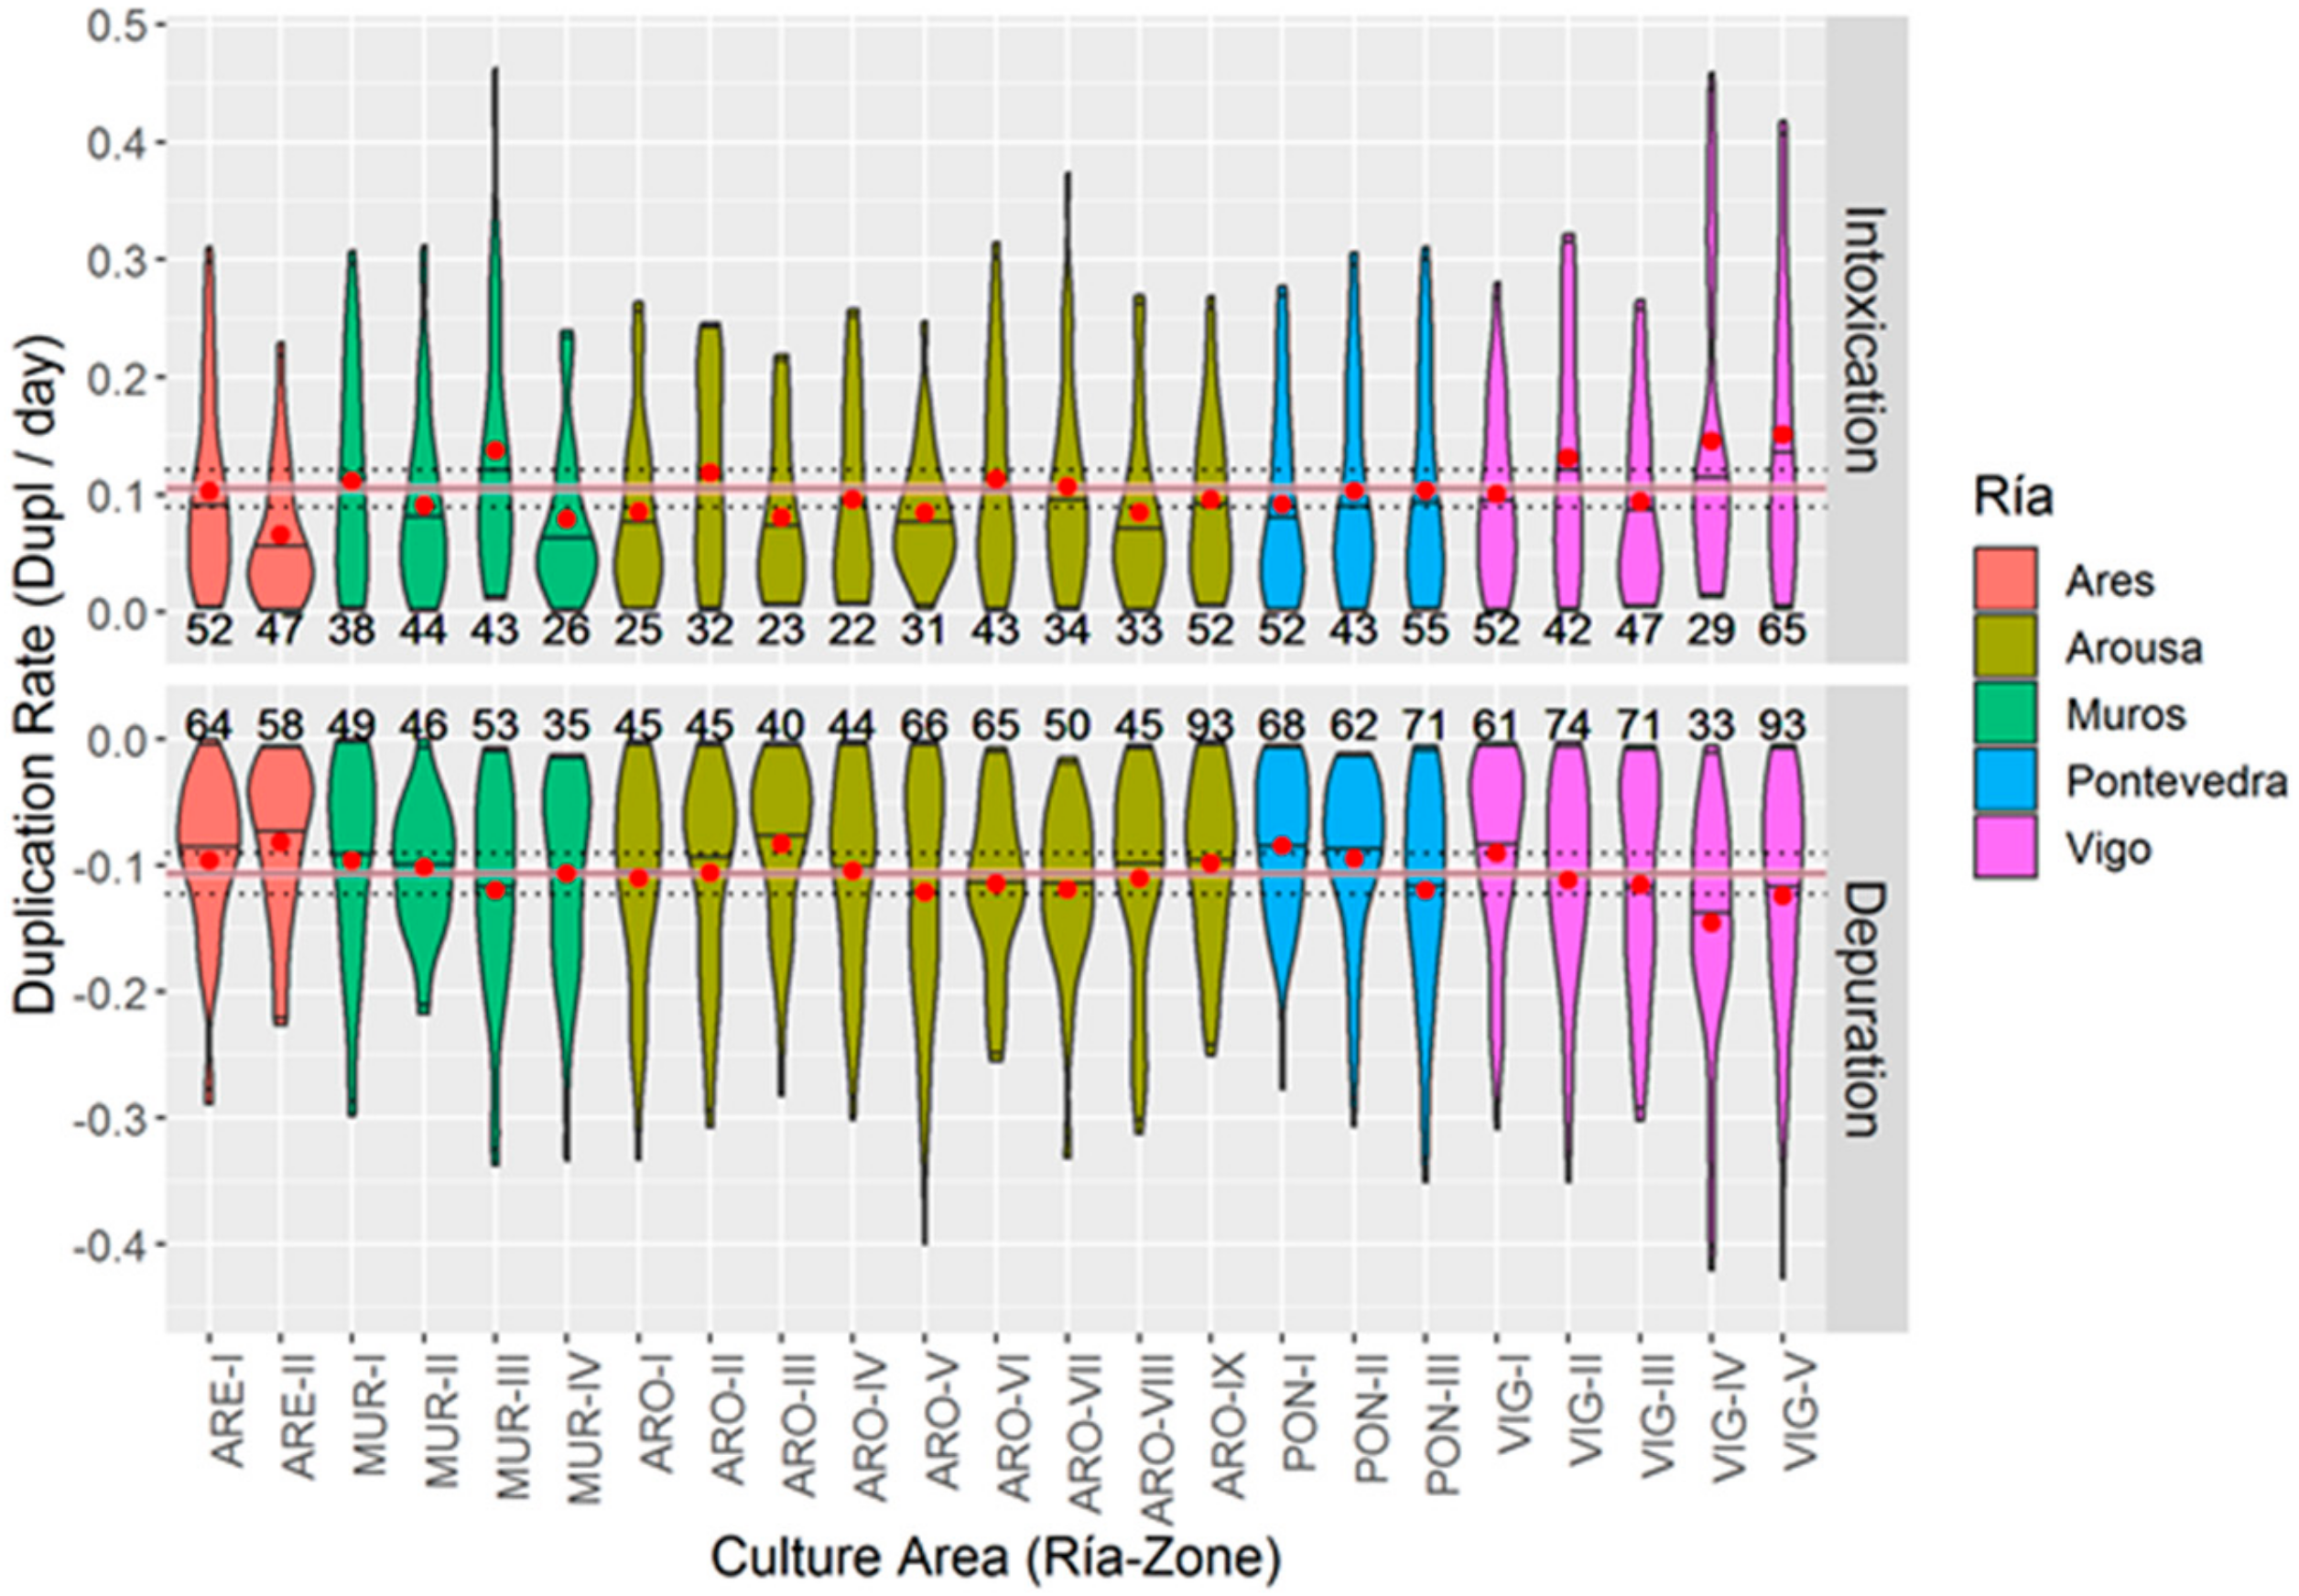
2.7.2. Differences as Compared with Culture Areas
Okadaic Acid
DTX2
3. Discussion
3.1. Incidence of Marine Toxins in Galician Production Areas
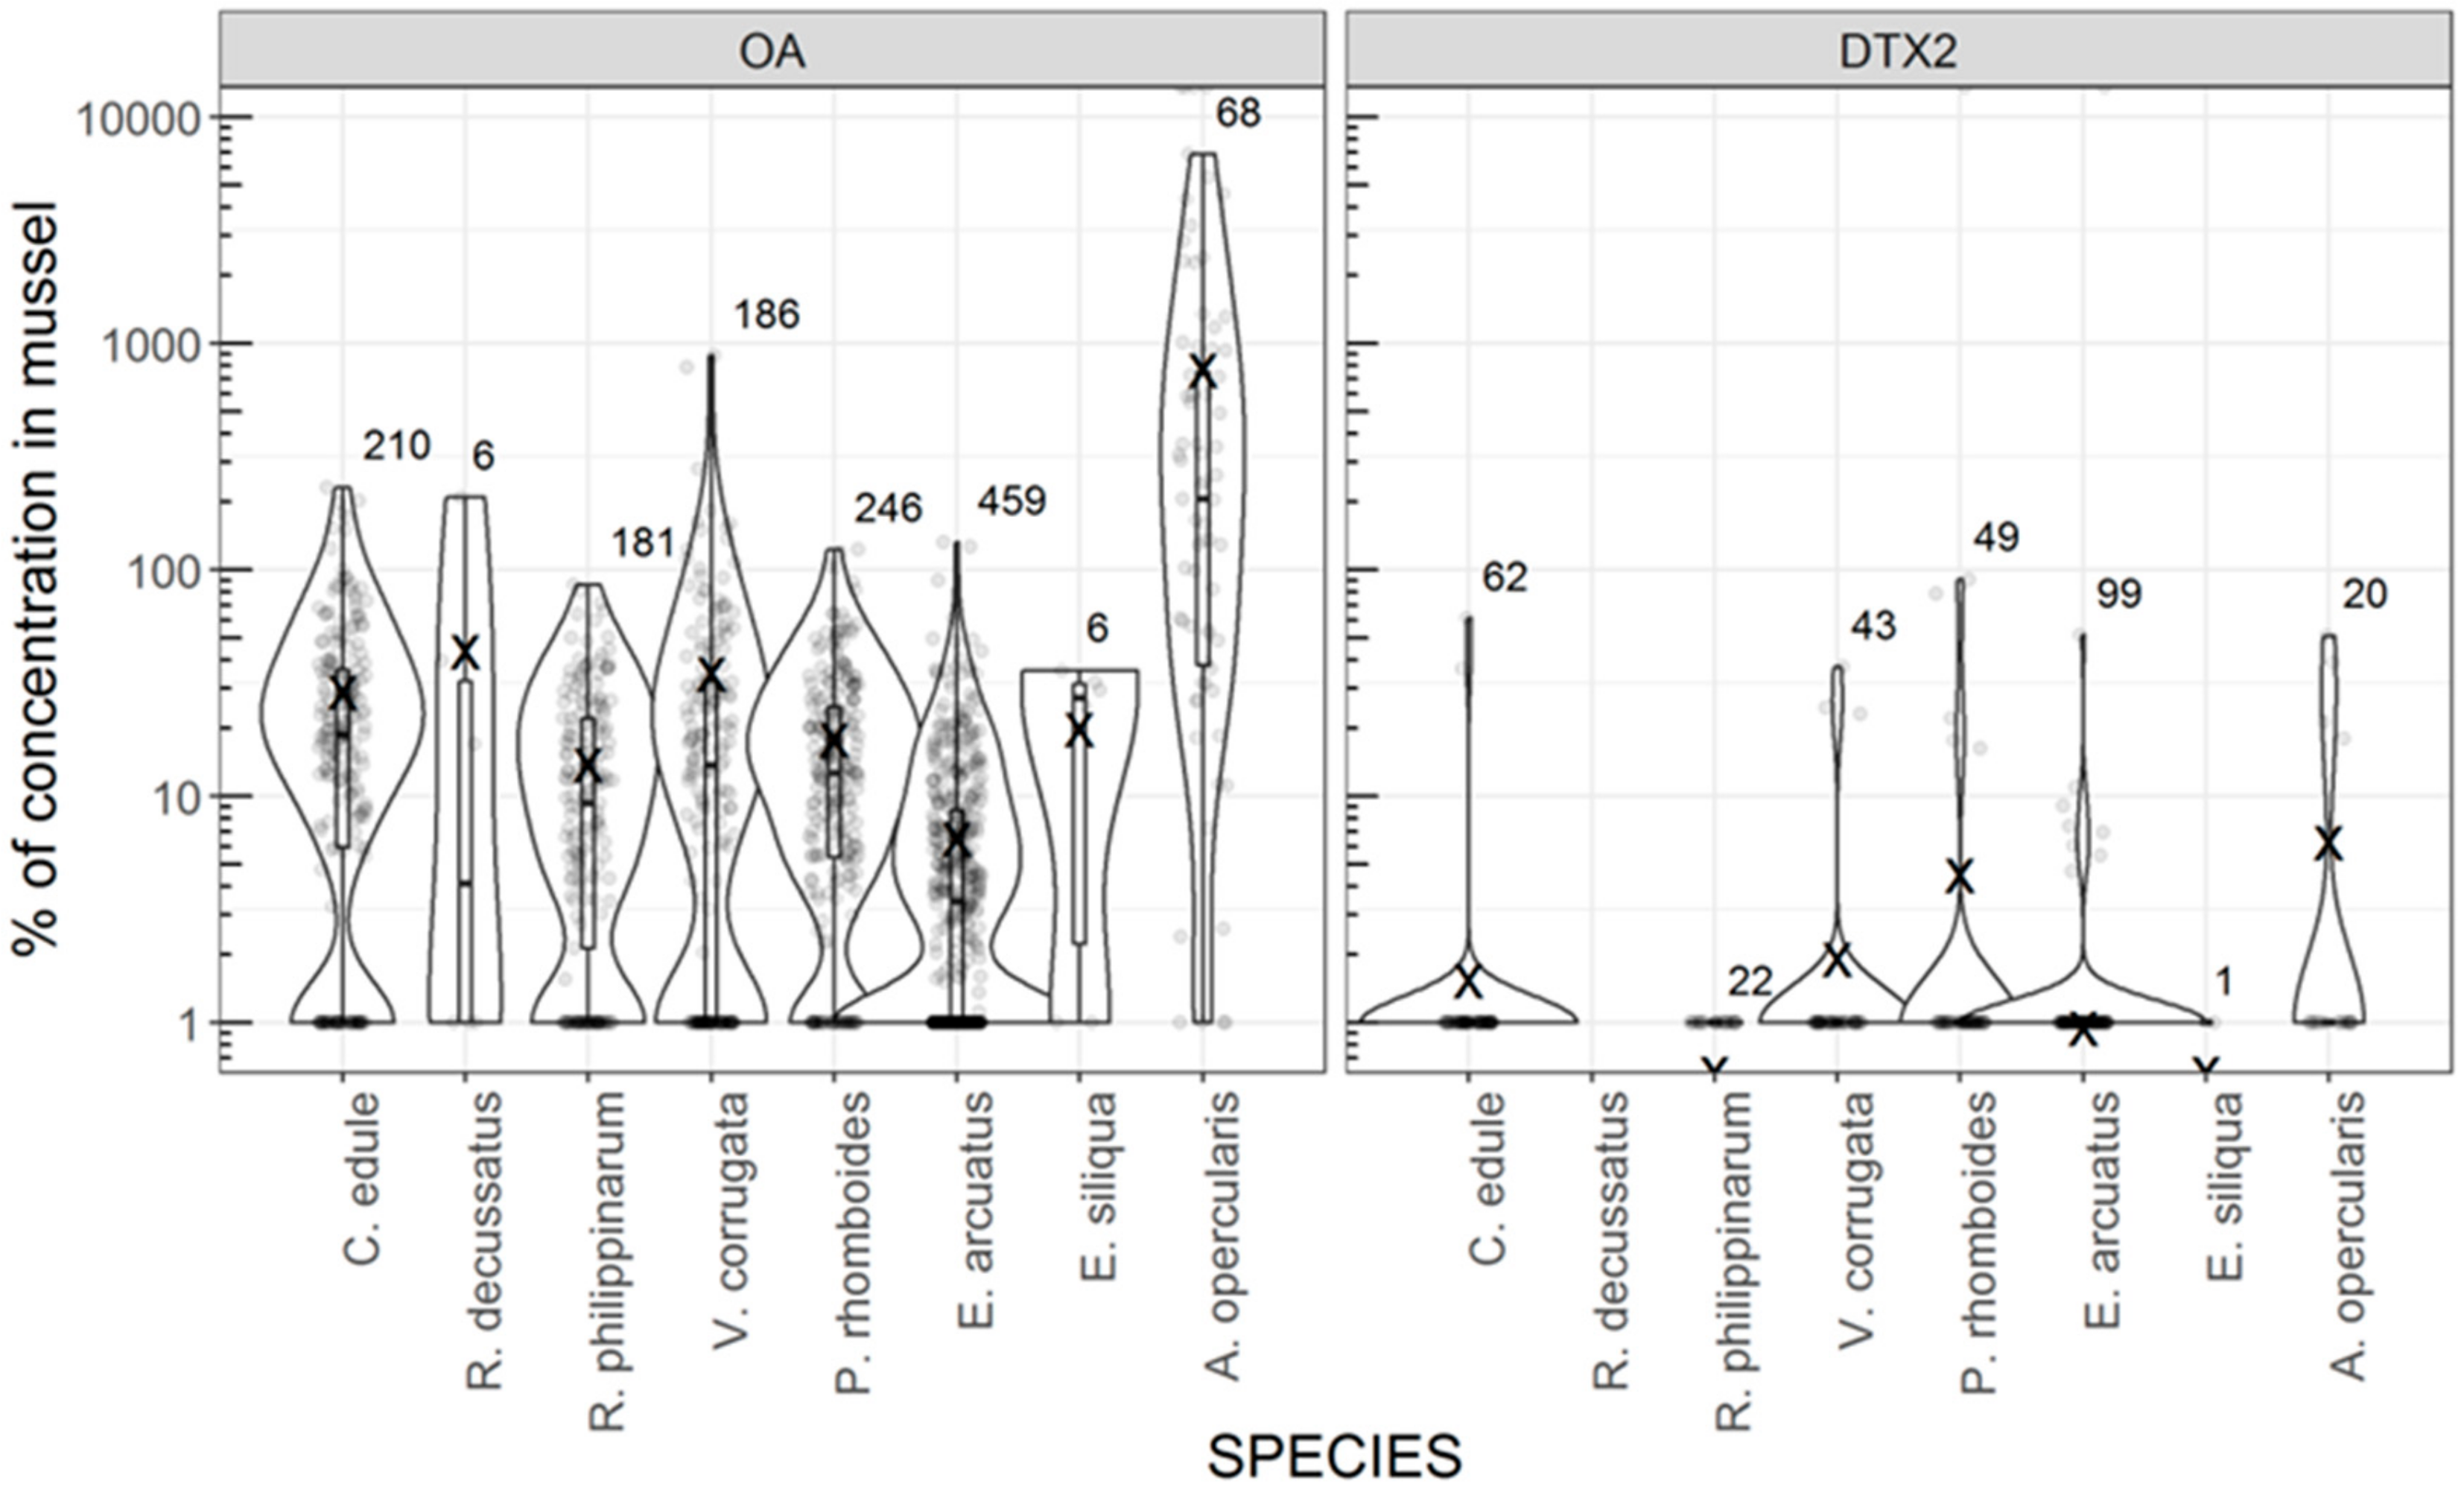
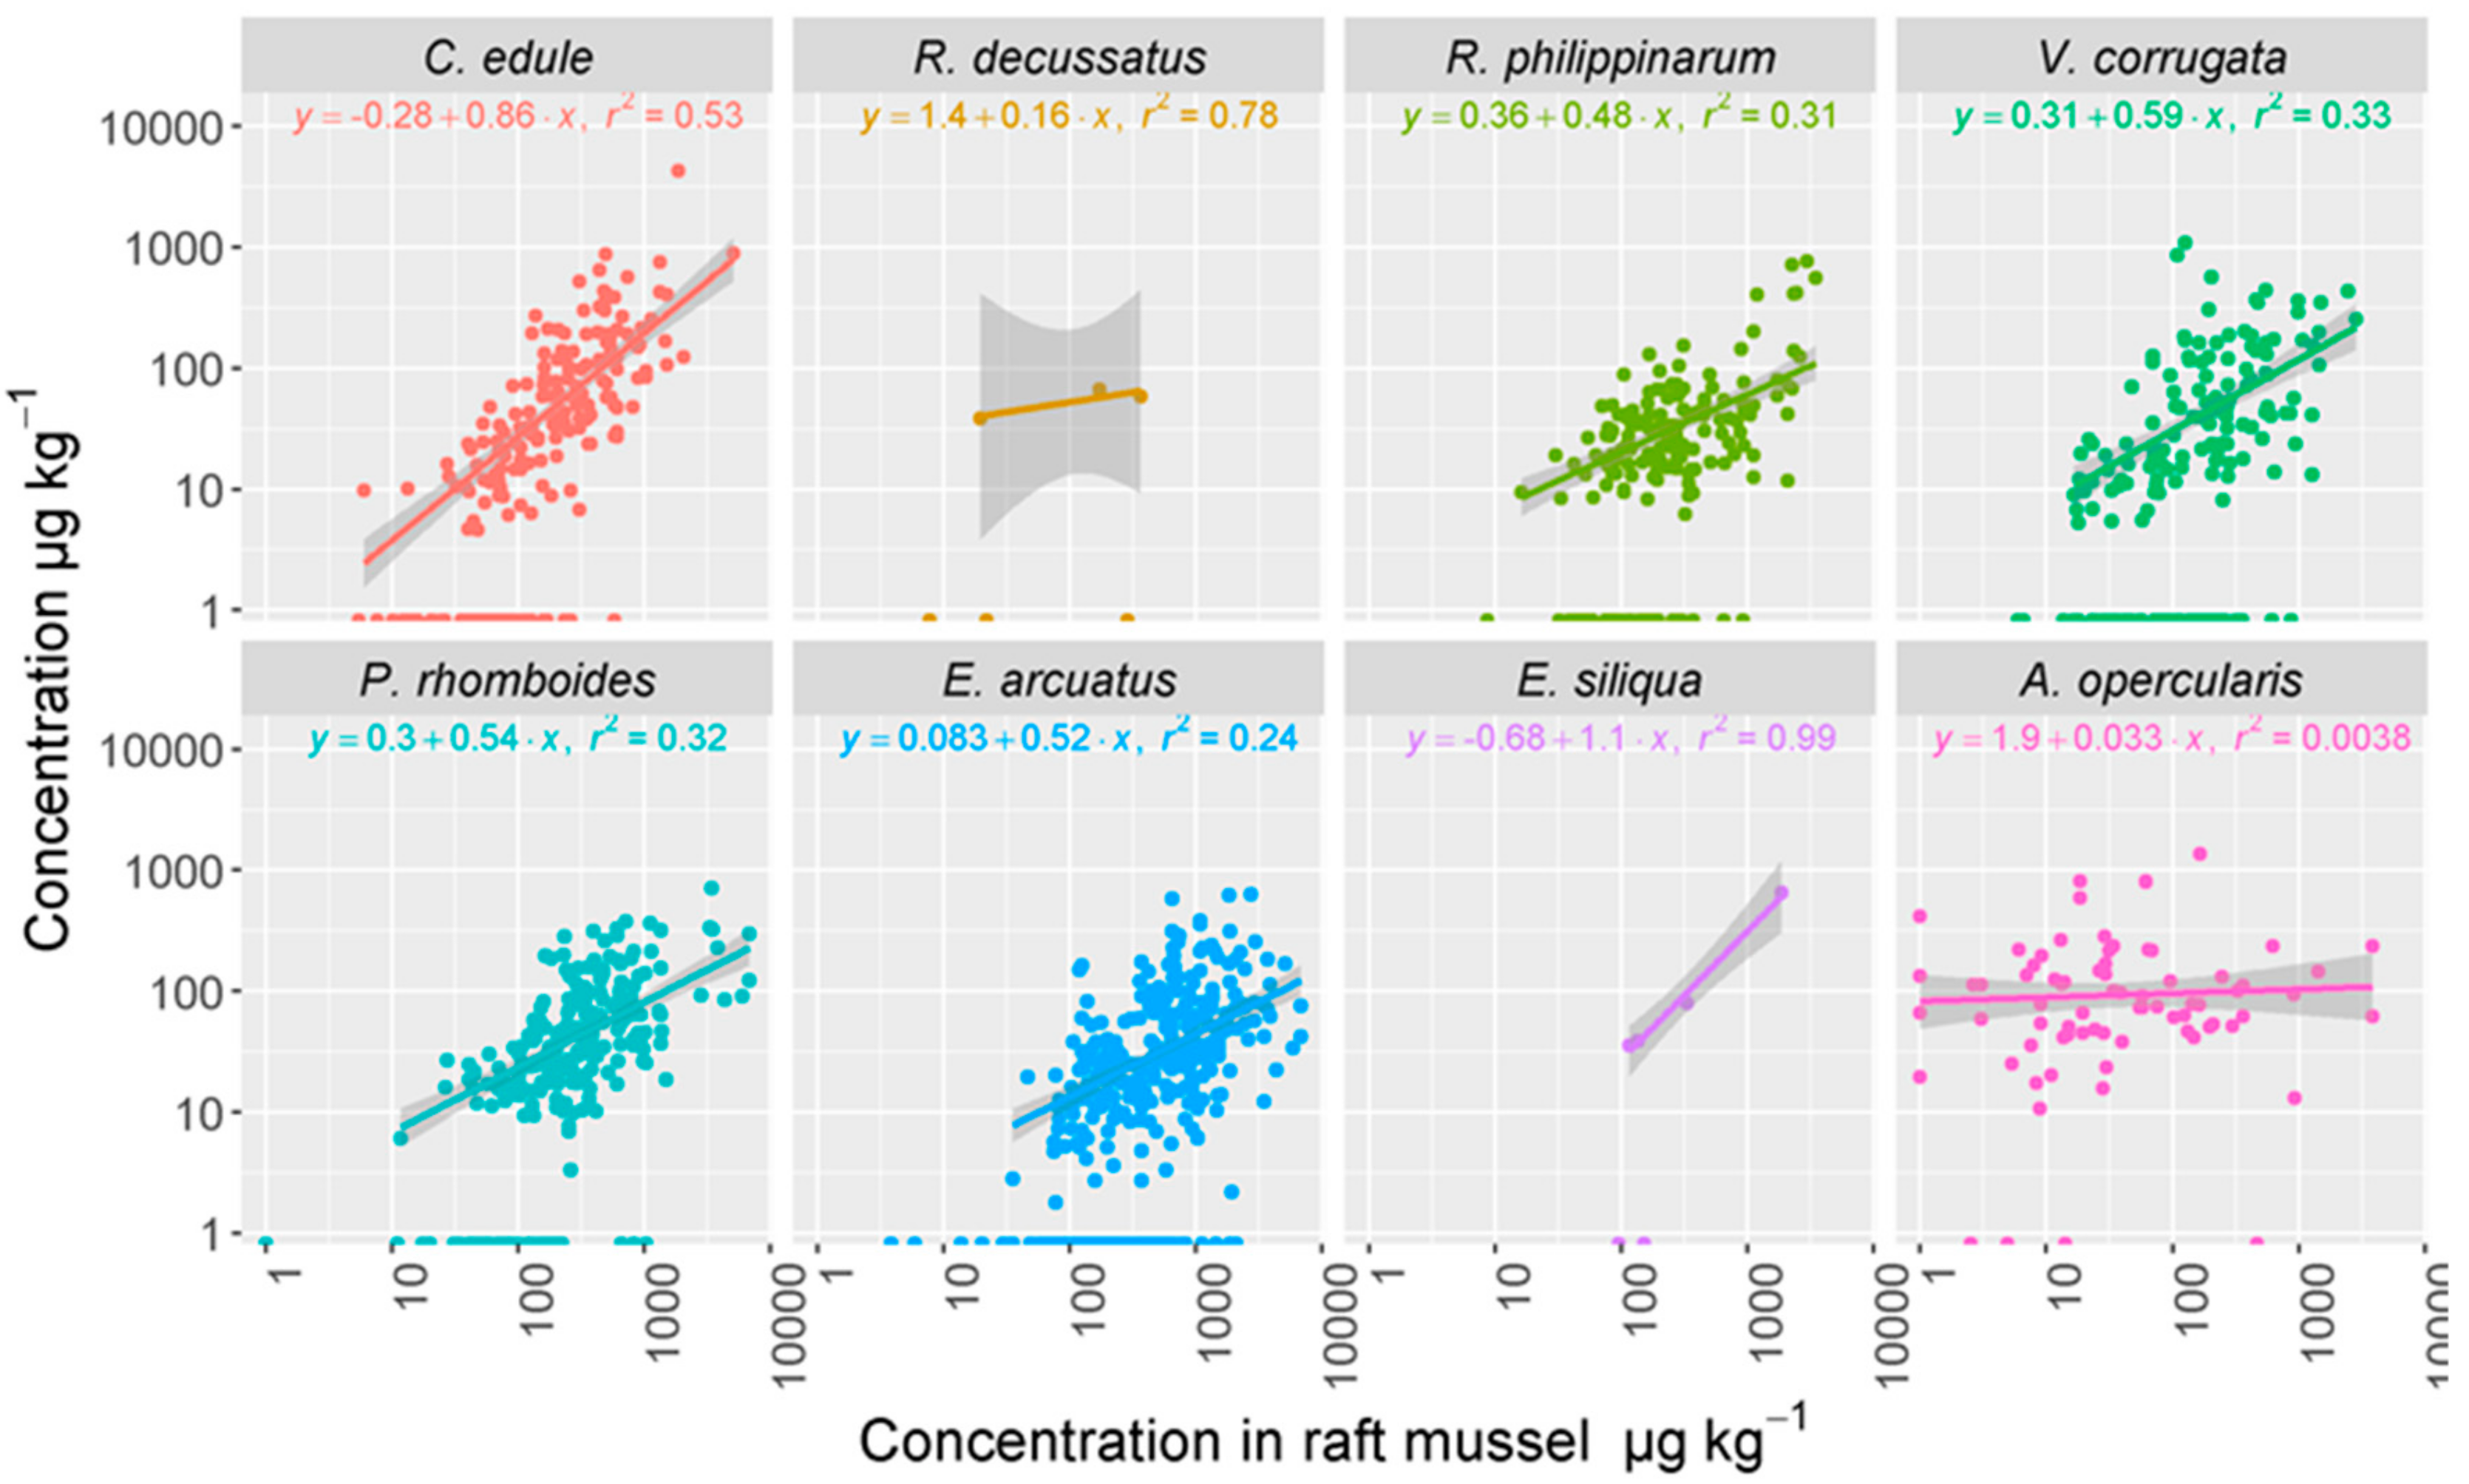
3.2. Incidence of Toxins in Commercially Important Bivalve Species
3.3. Temporal Variation and Patterns
3.4. Spatial Variation
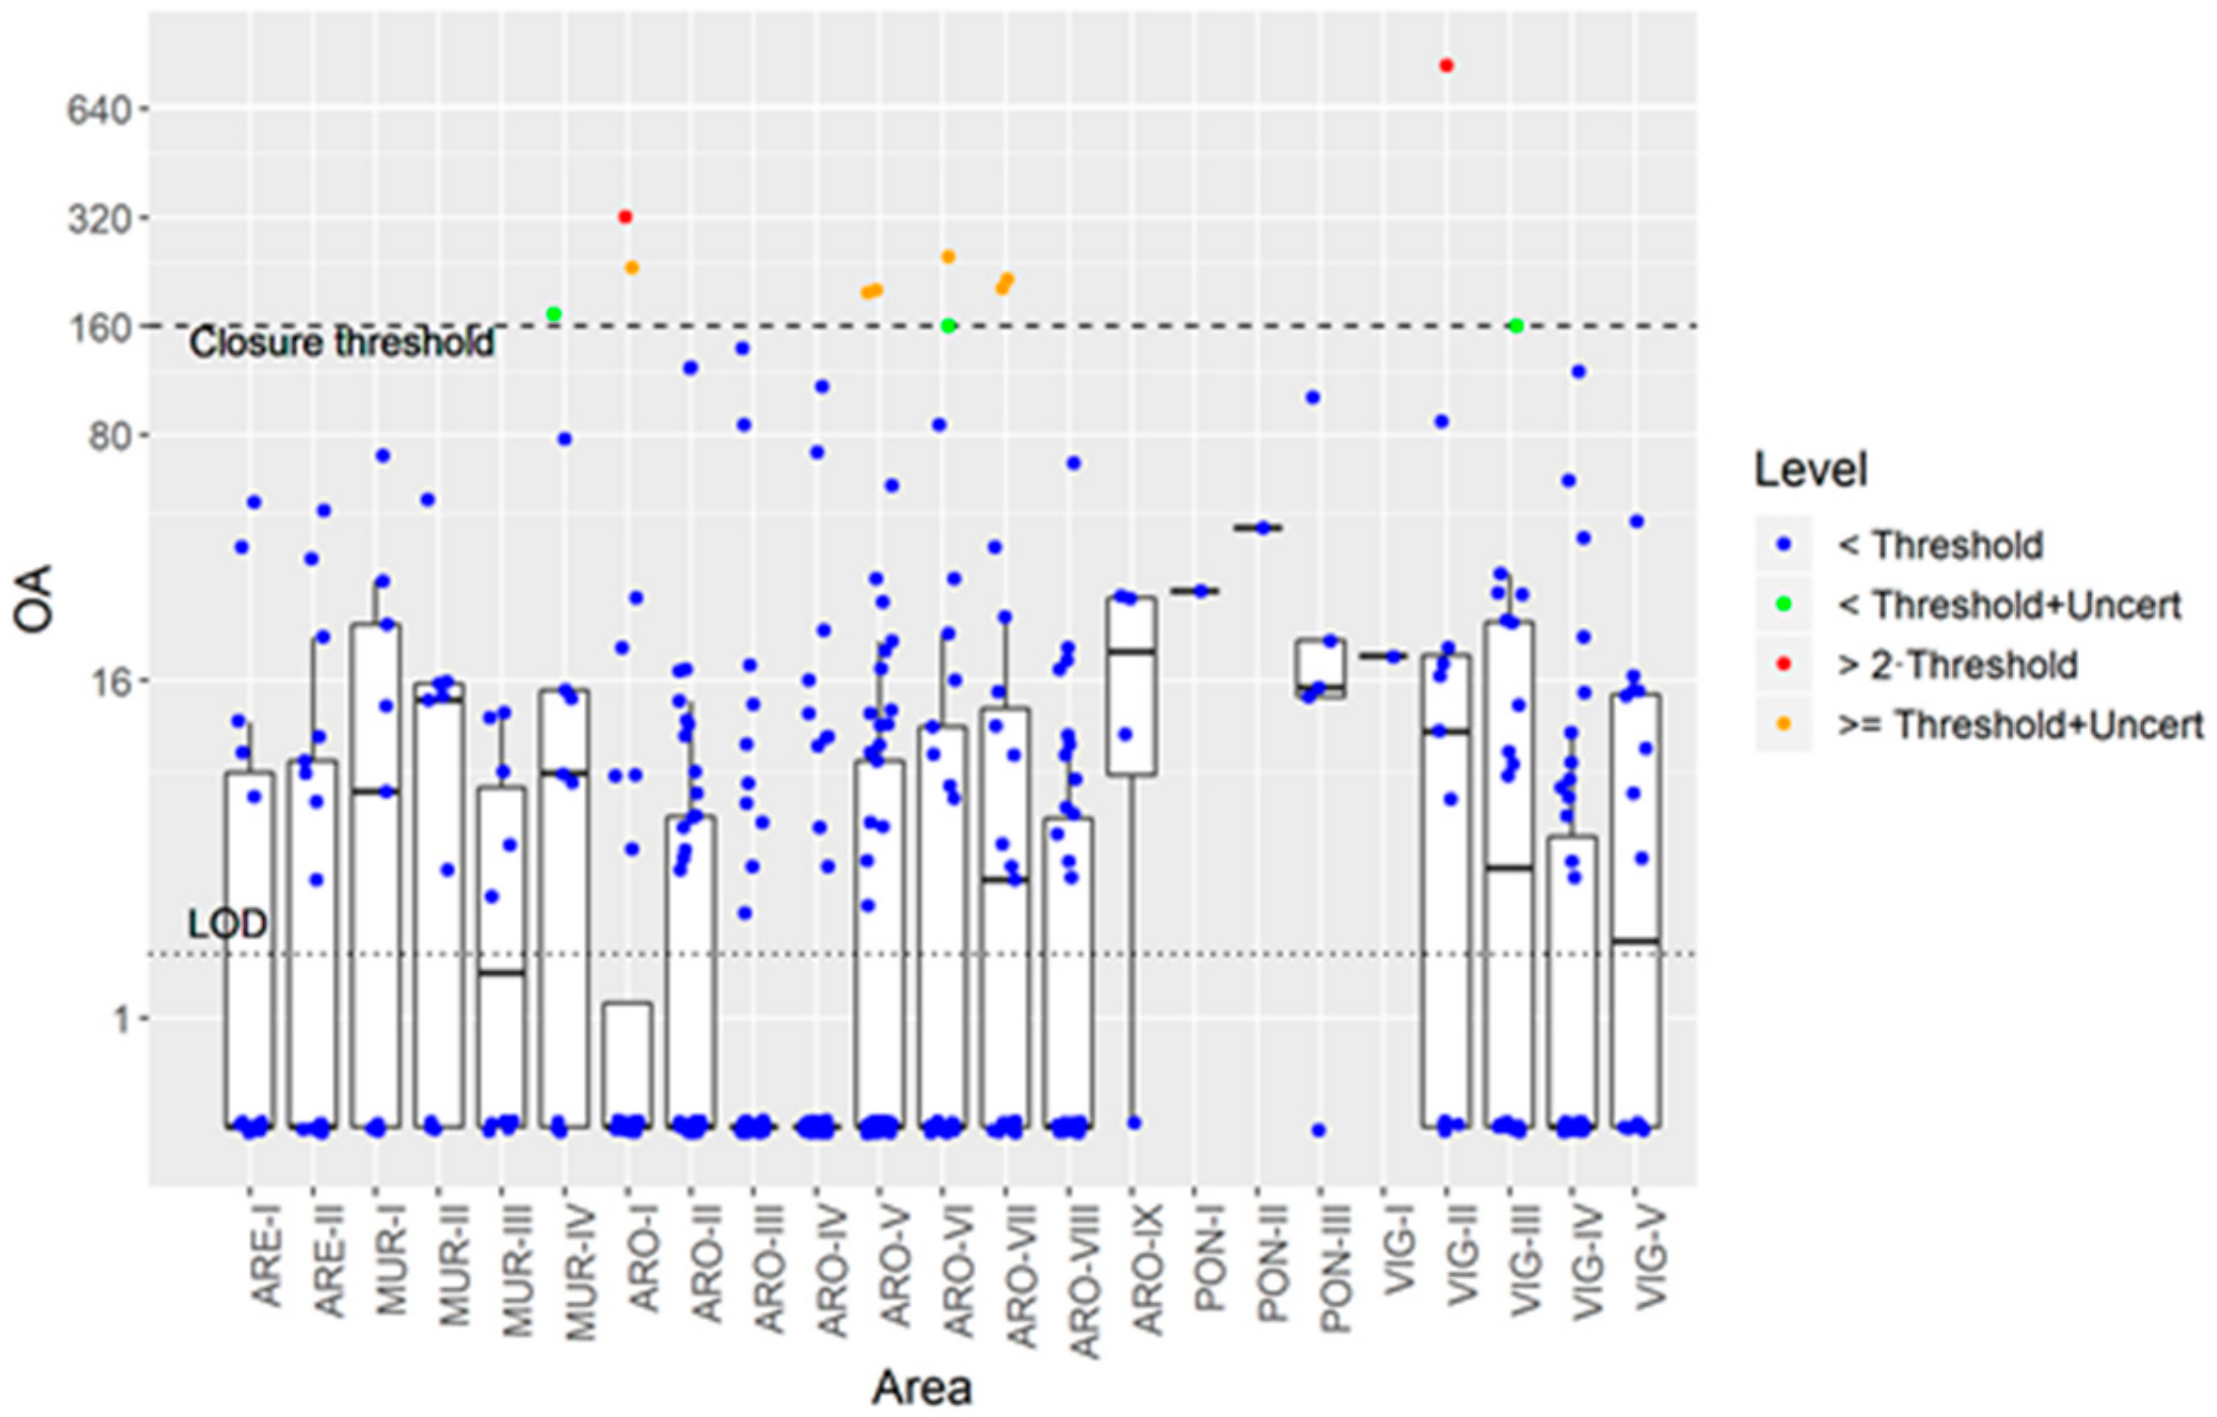
3.5. Intoxication, Depuration of OA, and the Monitoring System Risk
4. Conclusions
5. Material and Methods
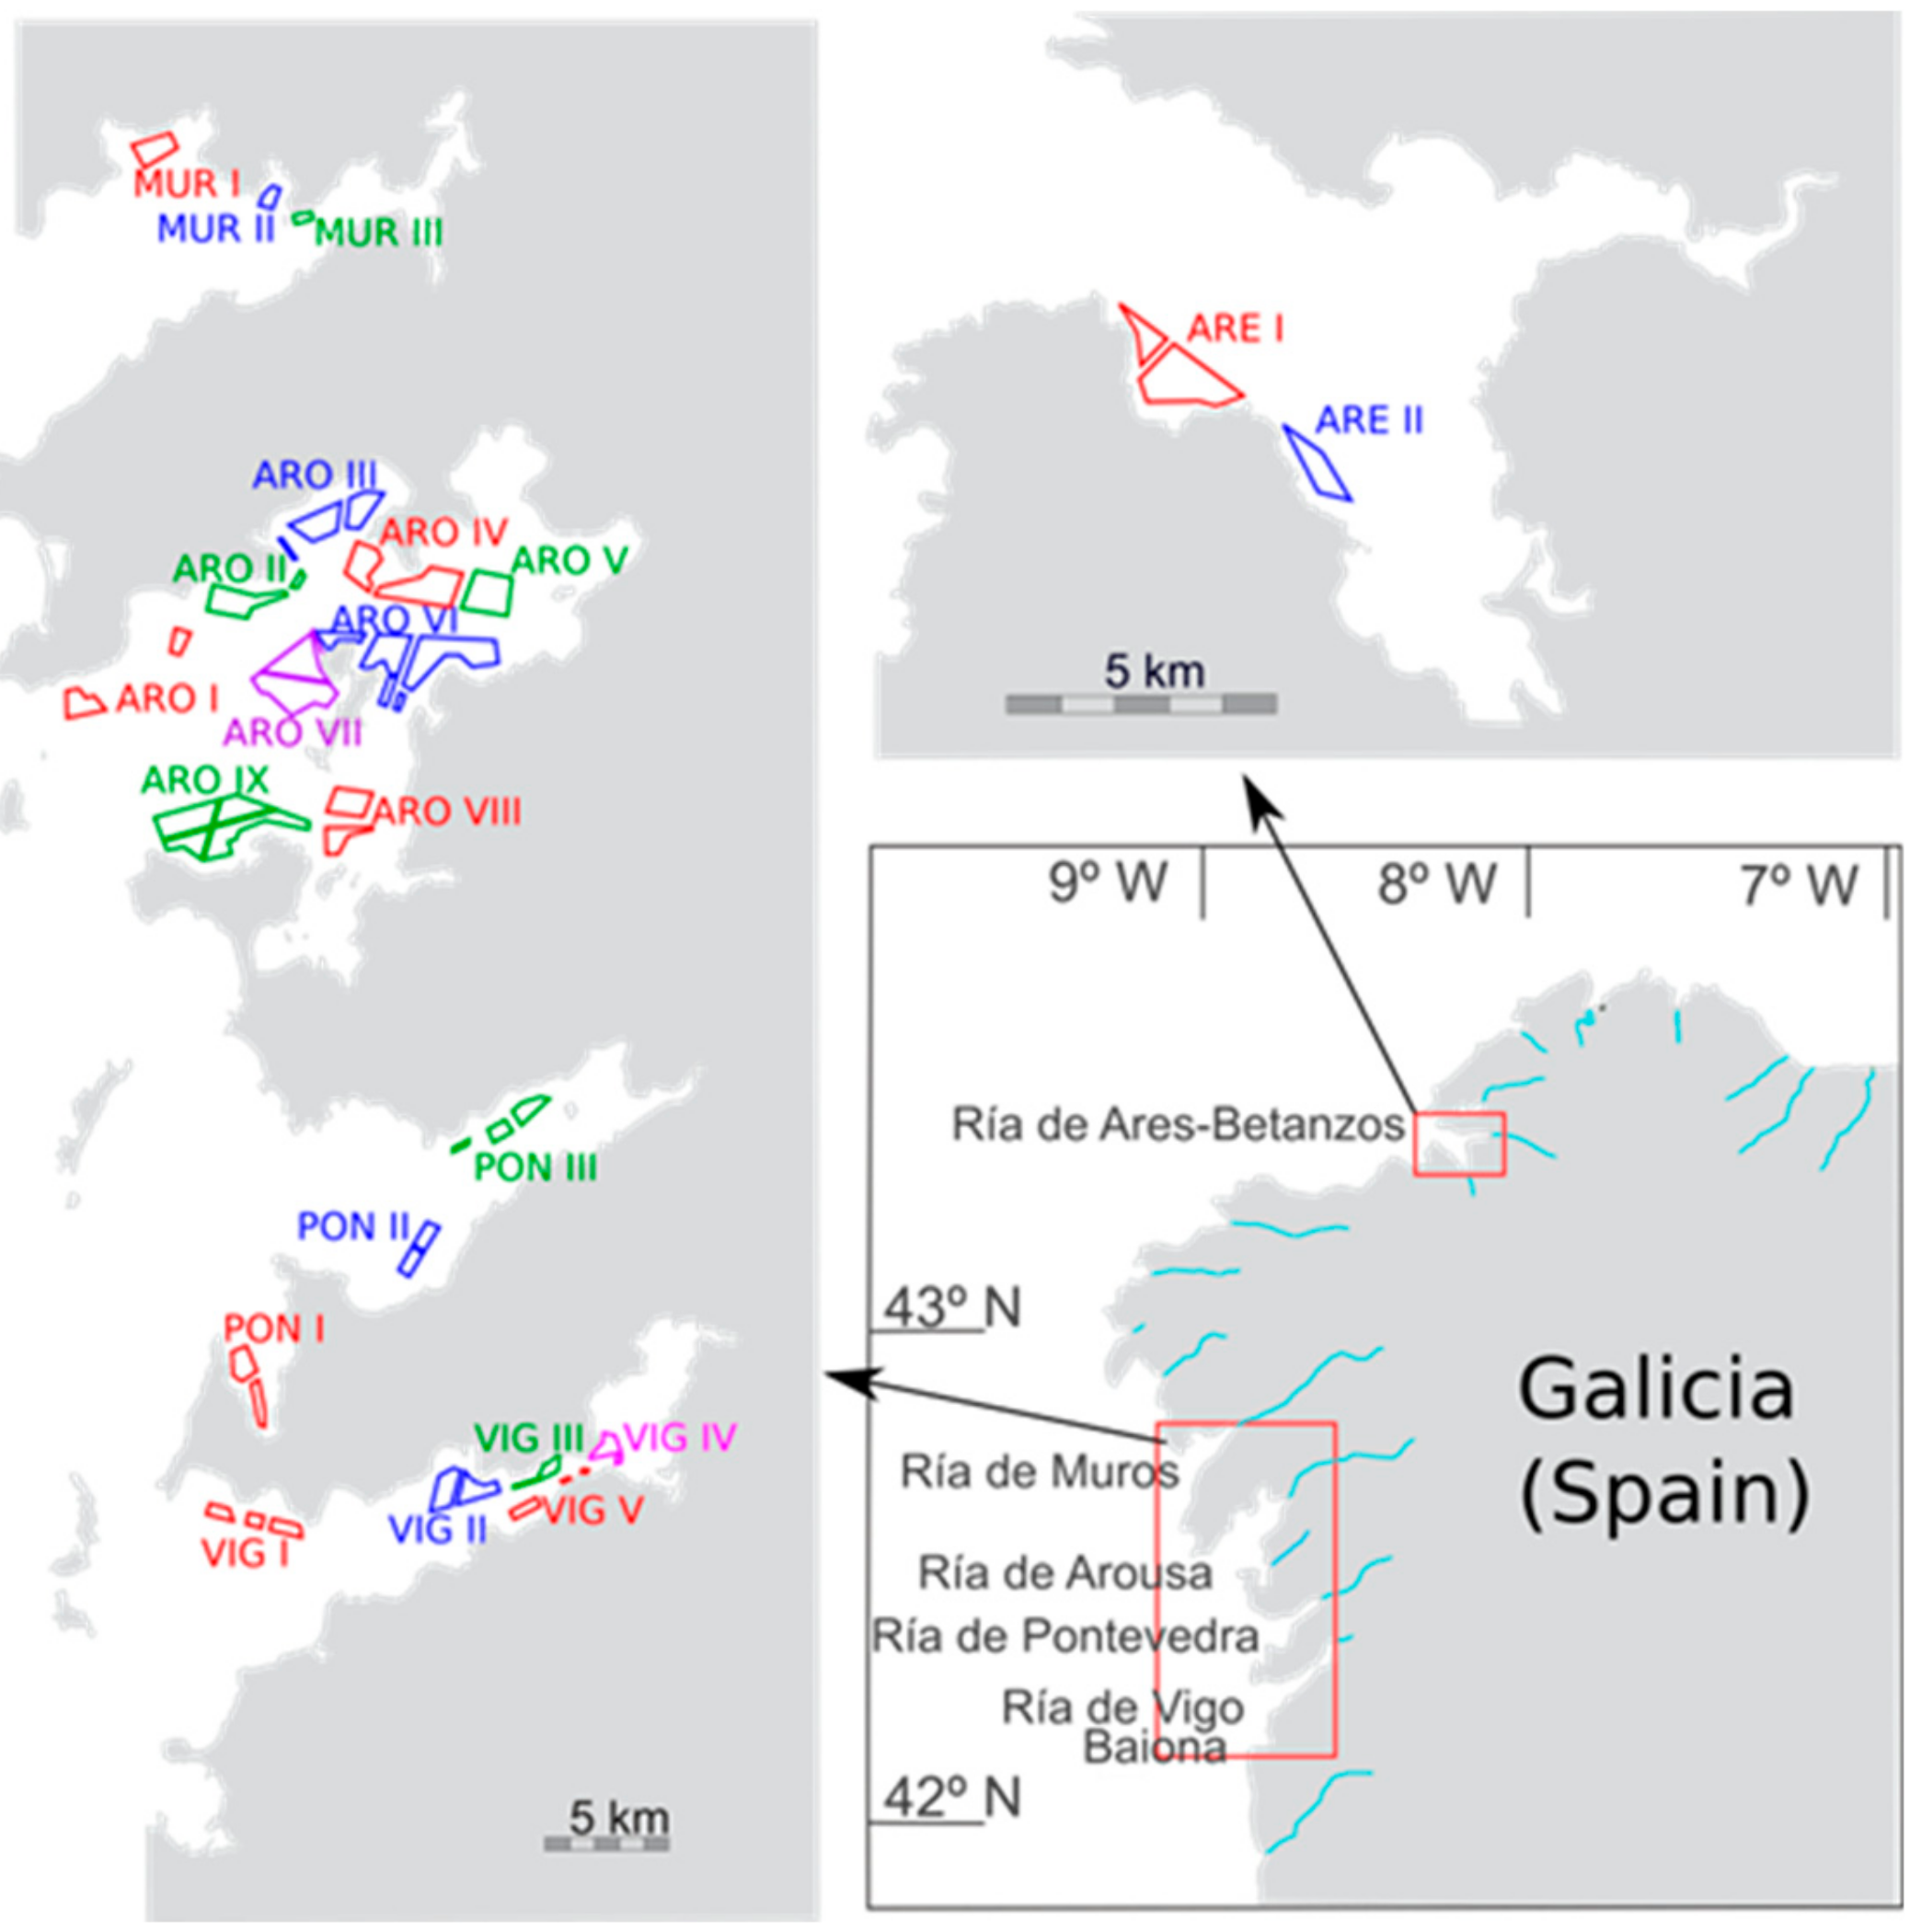
5.1. Sampling
5.2. Analysis
5.2.1. Extraction and Hydrolysis
5.2.2. LC-MS/MS
5.3. Computation and Dataset Limitations
5.4. Statistical Analysis
Supplementary Materials
Author Contributions
Funding
Acknowledgments
Conflicts of Interest
References
- Smayda, T.J. Harmful algal blooms: Their ecophysiology and general relevance to phytoplankton blooms in the sea. Limnol. Oceanogr. 1997, 42, 1137–1153. [Google Scholar] [CrossRef]
- Hallegraeff, G.M. Harmful algal blooms: A global overview. In Manual on Harmful Marine Microalgae; Hallegraeff, G.M., Anderson, D.M., Cembella, A.D., Eds.; Monographs on Oceanographic Methodology; Unesco Publishing: Paris, France, 2003; Volume 33, pp. 25–49. [Google Scholar]
- Blanco, J. Accumulation of Dinophysis Toxins in Bivalve Molluscs. Toxins 2018, 10, 453. [Google Scholar] [CrossRef] [PubMed]
- Gosling, E. How bivalves feed. In Marine Bivalve Molluscs; John Wiley & Sons, Ltd.: Chichester, UK, 2015; pp. 99–156. [Google Scholar]
- Møhlenberg, F.; Riisgård, H.U. Efficiency of particle retention in 13 species of suspension feeding bivalves. Ophelia 1978, 17, 239–246. [Google Scholar] [CrossRef]
- Riisgård, H.U. Efficiency of particle retention and filtration rate in 6 species of Northeast American bivalves. Mar. Ecol. Prog. Ser. Oldend. 1988, 45, 217–223. [Google Scholar] [CrossRef]
- Vahl, O. Particle retention and relation between water transport and oxygen uptake in Chlamys opercularis (L.) (Bivalvia). Ophelia 1972, 10, 67–74. [Google Scholar] [CrossRef]
- Jørgensen, C.B.; Goldberg, E.D. Particle filtration in some ascidians and lamellibranchs. Biol. Bull. 1953, 105, 477–489. [Google Scholar] [CrossRef]
- Morton, B. Feeding and digestion in Bivalvia. In The Mollusca. Physiology Part 2; Saleuddin, A.S.M., Wilbur, K.M., Eds.; Academic Press: Cambridge, MA, USA, 1983; pp. 65–147. [Google Scholar]
- Reguera, B.; Riobó, P.; Rodríguez, F.; Díaz, P.; Pizarro, G.; Paz, B.; Franco, J.; Blanco, J. Dinophysis Toxins: Causative Organisms, Distribution and Fate in Shellfish. Mar. Drugs 2014, 12, 394–461. [Google Scholar] [CrossRef]
- EFSA Panel on Contaminants in the Food Chain. Scientific Opinion of the Panel on Contaminants in the Food Chain on a request from the European Commission on Marine Biotoxins in Shellfish—Summary on regulated marine biotoxins. EFSA J. 2009, 1306, 1–23. [Google Scholar]
- Andersen, P.; Enevoldsen, H.; Anderson, D.M. Harmful algal monitoring programme and action plan design. In Manual on Harmful Marine Microalgae. United Nations Educational, Scientific and Cultural Organization; Hallegraeff, G.M., Anderson, A.D., Anderson, D.M., Eds.; UNESCO Publishing: Paris, France, 2003; pp. 627–647. [Google Scholar]
- Fernández, M.L.; Shumway, S.E.; Blanco, J. Management of shellfish resources. In Manual on Harmful Marine Microalgae; Hallegraeff, G.M., Anderson, A.D., Anderson, D.M., Eds.; UNESCO Publishing: Paris, France, 2003; pp. 657–692. [Google Scholar]
- Langlois, G.W.; Morton, S.L. Marine Biotoxin and Harmful Algae Monitoring and Management. In Harmful Algal Blooms; Shumway, S.E., Burkholder, J.A.M., Morton, S.L., Eds.; John Wiley & Sons, Ltd.: Chichester, UK, 2018; pp. 377–418. [Google Scholar]
- Kao, C.Y. Paralytic Shellfish Poisoning. In Algal Toxins in Seafood and Drinking Water; Falconer, I.R., Ed.; Academic Press: London, UK, 1993; pp. 75–86. [Google Scholar]
- García, C. Paralytic shellfish poisoning: Post-mortem analysis of tissue and body fluid samples from human victims in the Patagonia fjords. Toxicon 2004, 43, 149–158. [Google Scholar] [CrossRef]
- EFSA Panel on Contaminants in the Food Chain. Opinion of the Scientific Panel on Contaminants in the Food chain on a request from the European Commission on marine biotoxins in shellfish okadaic acid and analogues. EFSA J. 2008, 589, 1–62. [Google Scholar]
- Tachibana, K.; Scheuer, P.; Tsukitani, Y.; Kikuchi, H.; Enden, V.; Clardy, J.; Gopichand, Y.; Schmitz, F. Okadaic acid, a cytotoxic polyether from two marine sponges of the genus Halichondria. J. Am. Chem. Soc. 1981, 103, 2469–2471. [Google Scholar] [CrossRef]
- Yasumoto, T.; Oshima, Y.; Yamaguchi, M. Occurrence of a new type of shellfish poisoning in the Tohoku district. Bull. Jpn. Soc. Sci. Fish. 1978, 44, 1249–1255. [Google Scholar] [CrossRef]
- Yasumoto, T.; Oshima, Y.; Yamaguchi, M. Occurrence of a new type of toxic shellfish in Japan and chemical properties of the toxin. In Toxic Dinoflagellate Blooms; Taylor, D.L., Seliger, H.W., Eds.; Elsevier: New York, NY, USA, 1979; pp. 395–398. [Google Scholar]
- Blanco, J.; Correa, J.; Muñíz, S.; Mariño, C.; Martín, H.; Arévalo, F. Evaluación del impacto de los métodos y niveles utilizados para el control de toxinas en el mejillón. Rev. Galega Recur. Mar. 2013, 3, 1–55. [Google Scholar]
- Dhanji-Rapkova, M.; O’Neill, A.; Maskrey, B.H.; Coates, L.; Teixeira Alves, M.; Kelly, R.J.; Hatfield, R.G.; Rowland-Pilgrim, S.J.; Lewis, A.M.; Algoet, M.; et al. Variability and profiles of lipophilic toxins in bivalves from Great Britain during five and a half years of monitoring: Okadaic acid, dinophysis toxins and pectenotoxins. Harmful Algae 2018, 77, 66–80. [Google Scholar] [CrossRef]
- Stobo, L.A.; Lacaze, J.P.C.L.; Scott, A.C.; Petrie, J.; Turrell, E.A. Surveillance of algal toxins in shellfish from Scottish waters. Toxicon 2008, 51, 635–648. [Google Scholar] [CrossRef]
- Campos, M.J.; Fraga, S.; Mariño, J.; Sánchez, J. Red Tide Monitoring Programme in NW Spain. Report of 1977–1981 C.M.1982/L:27; International Council for the Exploration of the Sea: Copenhagen, Denmark, 1982; p. 8. [Google Scholar]
- Arévalo, F.; Pazos, Y.; Correa, J.; Salgado, C.; Moroño, A.; Paz, B.; Franco, J.M. First reported case of yessotoxins in mussels in the Galician Rías during a bloom of Lingulodinium polyedrum STEIN (Dodge). In Proceedings of the 5th International Conference on Molluscan Shellfish Safety, Galway, Ireland, 14–18 June 2004; Henshilwood, K., Deegan, B., McMahon, T., Cusack, C., Keaveney, S., Silke, J., O’Cinneide, M., Lyons, D., Hess, P., Henshilwood, K., et al., Eds.; Marine Institute: Galway, Ireland, 2006; pp. 184–189. [Google Scholar]
- Paz, B.; Blanco, J.; Franco, J.M. Yessotoxins production during the culture of Protoceratium reticulatum strains isolated from Galician Rias Baixas (NW Spain). Harmful Algae 2013, 21–22, 13–19. [Google Scholar] [CrossRef]
- Blanco, J.; Arévalo, F.; Moroño, A.; Correa, J.; Muñíz, S.; Mariño, C.; Martín, H. Presence of azaspiracids in bivalve molluscs from Northern Spain. Toxicon 2017, 137, 135–143. [Google Scholar] [CrossRef]
- Martín-Morales, E.; Mariño, C.; Arévalo, F.; Correa, J.; Moroño, Á.; Blanco, J. A prospective study of cyclic imines in two Galician aquaculture areas. In Proceedings of the Marine and Freshwater Toxins Analysis Fourth Joint Symposium and AOAC Task Force Meeting, Baiona, Spain, 5–9 May 2013. [Google Scholar] [CrossRef]
- Villar Gonzalez, A.; Rodriguez-Velasco, M.L.; Ben-Gigirey, B.; Botana, L.M. First evidence of spirolides in Spanish shellfish. Toxicon 2006, 48, 1068–1074. [Google Scholar] [CrossRef]
- Lamas, J.P.; Arévalo, F.; Moroño, Á.; Correa, J.; Muñíz, S.; Blanco, J. Detection and Spatio-Temporal Distribution of Pinnatoxins in Shellfish from the Atlantic and Cantabrian Coasts of Spain. Toxins 2019, 11, 340. [Google Scholar] [CrossRef]
- Vale, P.; Botelho, M.J.; Rodrigues, S.M.; Gomes, S.S.; de Sampayo, M.A.M. Two decades of marine biotoxin monitoring in bivalves from Portugal (1986–2006): A review of exposure assessment. Harmful Algae 2008, 7, 11–25. [Google Scholar] [CrossRef]
- Fernández, R.; Mamán, L.; Jaén, D.; Fernández Fuentes, L.; Ocaña, M.A.; Gordillo, M.M. Dinophysis Species and Diarrhetic Shellfish Toxins: 20 Years of Monitoring Program in Andalusia, South of Spain. Toxins 2019, 11, 189. [Google Scholar] [CrossRef] [PubMed]
- Tillmann, U.; Jaen, D.; Fernandez, L.; Gottschling, M.; Witt, M.; Blanco, J.; Krock, B. Amphidoma languida (Amphidomatacea, Dinophyceae) with a novel azaspiracid toxin profile identified as the cause of molluscan contamination at the Atlantic coast of southern Spain. Harmful Algae 2017, 62, 113–126. [Google Scholar] [CrossRef] [PubMed]
- Swan, S.C.; Turner, A.D.; Bresnan, E.; Whyte, C.; Paterson, R.F.; McNeill, S.; Mitchell, E.; Davidson, K. Dinophysis acuta in Scottish Coastal Waters and Its Influence on Diarrhetic Shellfish Toxin Profiles. Toxins 2018, 10, 399. [Google Scholar] [CrossRef] [PubMed]
- Carmody, E.P.; James, K.J.; Kelly, S.S. Dinophysistoxin-2: The predominant diarrhetic shellfish toxin in Ireland. Toxicon 1996, 34, 351–359. [Google Scholar] [CrossRef]
- Salas, R.; Clarke, D. Review of DSP Toxicity in Ireland: Long-Term Trend Impacts, Biodiversity and Toxin Profiles from a Monitoring Perspective. Toxins 2019, 11, 61. [Google Scholar] [CrossRef]
- Fernández, M.L.; Míguez, A.; Moroño, A.; Cacho, E.; Martínez, A.; Blanco, J. Detoxification of low polarity toxins (DTX3) from mussels Mytilus galloprovincialis in Spain. In Harmful Algae; Reguera, B., Blanco, J., Fernández, M.L., Wyatt, T., Eds.; Xunta de Galicia and Int. Oceanographic Com. of UNESCO: Santiago de Compostela, Spain, 1998; pp. 449–452. [Google Scholar]
- Vale, P. Differential Dynamics of Dinophysistoxins and Pectenotoxins Between Blue Mussel and Common Cockle: A Phenomenon Originating from the Complex Toxin Profile of Dinophysis acuta. Toxicon 2004, 44, 123–134. [Google Scholar] [CrossRef]
- Vale, P. Differential Dynamics of Dinophysistoxins and Pectenotoxins, Part II: Offshore Bivalve Species. Toxicon 2006, 47, 163–173. [Google Scholar] [CrossRef]
- Vale, P.; Sampayo, M.A. DTX-2 in Portuguese bivalves. In Harmful and Toxic Algal Blooms; Yasumoto, T., Oshima, Y., Fukuyo, Y., Eds.; IOC of UNESCO: Sendai, Japan, 1996; pp. 539–542. [Google Scholar]
- Vale, P.; Sampayo, M.A. Dinophysistoxin-2: A rare diarrhoeic toxin associated with Dinophysis acuta. Toxicon 2000, 38, 1599–1606. [Google Scholar] [CrossRef]
- Draisci, R.; Giannetti, L.; Lucentini, L.; Marchiafava, C.; James, K.J.; Bishop, A.G.; Healy, B.M.; Kelly, S.S. Isolation of a new okadaic acid analog from phytoplankton implicated in diarrhetic shellfish poisoning. J. Chromatogr. A 1998, 798, 137–145. [Google Scholar] [CrossRef]
- Fernández Puente, P.; Fidalgo Saez, M.J.; Hamilton, B.; Furey, A.; James, K.J. Studies of Polyether Toxins in the Marine Phytoplankton, Dinophysis acuta, in Ireland Using Multiple Tandem Mass Spectrometry. Toxicon 2004, 44, 919–926. [Google Scholar] [CrossRef]
- Reguera, B.; Garces, E.; Pazos, Y.; Bravo, I.; Ramilo, I.; GonzalezGill, S. Cell cycle patterns and estimates of in situ division rates of dinoflagellates of the genus Dinophysis by a postmitotic index. Mar. Ecol. Prog. Ser. 2003, 249, 117–131. [Google Scholar] [CrossRef]
- Pizarro, G.; Morono, A.; Paz, B.; Franco, J.M.; Pazos, Y.; Reguera, B. Evaluation of passive samplers as a monitoring tool for early warning of Dinophysis toxins in shellfish. Mar. Drugs 2013, 11, 3823–3845. [Google Scholar] [CrossRef] [PubMed]
- Escalera, L.; Reguera, B.; Pazos, Y.; Moroño, A.; Cabanas, J.M. Are different species of Dinophysis selected by climatological conditions? Afr. J. Mar. Sci. 2006, 28, 283–288. [Google Scholar] [CrossRef]
- Diaz, P.A.; Reguera, B.; Moita, T.; Bravo, I.; Ruiz-Villarreal, M.; Fraga, S. Mesoscale Dynamics and Niche Segregation of Two Dinophysis Species in Galician-Portuguese Coastal Waters. Toxins 2019, 11, 37. [Google Scholar] [CrossRef]
- James, K.J.; Bishop, A.G.; Gillman, M.; Kelly, S.S.; Roden, C.; Draisci, R.; Lucentini, L.; Giannetti, L.; Boria, P. Liquid chromatography with fluorometric, mass spectrometric and tandem mass spectrometric detection for the investigation of the seafood toxin-producing phytoplankton, Dinophysis acuta. J. Chromatogr. A 1997, 777, 213–221. [Google Scholar] [CrossRef]
- James, K.J.; Bishop, A.G.; Healy, B.M.; Roden, C.; Sherlock, I.R.; Twohig, M.; Draisci, R.; Giannetti, L.; Lucentini, L. Efficient isolation of the rare diarrheic shellfish toxin, dinophysistoxin-2, from marine phytoplankton. Toxicon 1999, 37, 343–357. [Google Scholar] [CrossRef]
- Fernández, M.L.; Reguera, B.; González-Gil, S.; Míguez, A. Pectenotoxin-2 in single-cell isolates of Dinophysis caudata and Dinophysis acuta from the Galician Rias (NW Spain). Toxicon 2006, 48, 477–490. [Google Scholar] [CrossRef]
- Vale, P.; de Sampayo, M.A.M. Pectenotoxin-2 seco acid, 7-epi-pectenotoxin-2 seco acid and pectenotoxin-2 in shellfish and plankton from Portugal. Toxicon 2002, 40, 979–987. [Google Scholar] [CrossRef]
- Pizarro, G.; Paz, B.; Franco, J.; Suzuki, T.; Reguera, B. First detection of Pectenotoxin-11 and confirmation of OA-D8 diol-ester in Dinophysis acuta from European waters by LC-MS/MS. Toxicon 2008, 52, 889–896. [Google Scholar] [CrossRef]
- Lindegarth, S.; Torgersen, T.; Lundve, B.; Sandvik, M. Differential Retention of Okadaic Acid (Oa) Group Toxins and Pectenotoxins (Ptx) in The Blue Mussel, Mytilus edulis (L.), and European Flat Oyster, Ostrea edulis (L.). J. Shellfish Res. 2009, 28, 313–323. [Google Scholar] [CrossRef]
- Torgersen, T.; Sandvik, M.; Lundve, B.; Lindegarth, S. Profiles and levels of fatty acid esters of okadaic acid group toxins and pectenotoxins during toxin depuration. Part II: Blue mussels (Mytilus edulis) and flat oyster (Ostrea edulis). Toxicon 2008, 52, 418–427. [Google Scholar] [CrossRef] [PubMed]
- Fux, E.; Bire, R.; Hess, P. Comparative accumulation and composition of lipophilic marine biotoxins in passive samplers and in mussels (M. edulis) on the West Coast of Ireland. Harmful Algae 2009, 8, 523–537. [Google Scholar] [CrossRef]
- Wilkins, A.L.; Rehmann, N.; Torgersen, T.; Rundberget, T.; Keogh, M.; Petersen, D.; Hess, P.; Rise, F.; Miles, C.O. Identification of fatty acid esters of pectenotoxin-2 seco acid in blue mussels (Mytilus edulis) from Ireland. J. Agric. Food Chem. 2006, 54, 5672–5678. [Google Scholar] [CrossRef] [PubMed]
- Miles, C.O.; Wilkins, A.L.; Munday, R.; Dines, M.H.; Hawkes, A.D.; Briggs, L.R.; Sandvik, M.; Jensen, D.J.; Cooney, J.M.; Holland, P.T.; et al. Isolation of Pectenotoxin-2 from Dinophysis acuta and Its Conversion to Pectenotoxin-2 Seco Acid, and Preliminary Assessment of Their Acute Toxicities. Toxicon 2004, 43, 1–9. [Google Scholar] [CrossRef]
- Suzuki, T.; Mackenzie, L.; Stirling, D.; Adamson, J. Pectenotoxin-2 seco acid: A toxin converted from pectenotoxin-2 by the New Zealand Greenshell mussel, Perna canaliculus. Toxicon 2001, 39, 507–514. [Google Scholar] [CrossRef]
- Suzuki, T.; Mackenzie, L.; Stirling, D.; Adamson, J. Conversion of pectenotoxin-2 to pectenotoxin-2 seco acid in the New Zealand scallop, Pecten novaezelandiae. Fish. Sci. 2001, 67, 506–510. [Google Scholar] [CrossRef]
- Blanco, J.; Alvarez, G.; Rengel, J.; Diaz, R.; Marino, C.; Martin, H.; Uribe, E. Accumulation and Biotransformation of Dinophysis Toxins by the Surf Clam Mesodesma donacium. Toxins 2018, 10, 314. [Google Scholar] [CrossRef]
- Aasen, J.; Samdal, I.A.; Miles, C.O.; Dahl, E.; Briggs, L.R.; Aune, T. Yessotoxins in Norwegian Blue Mussels (Mytilus edulis): Uptake from Protoceratium reticulatum, Metabolism and Depuration. Toxicon 2005, 45, 265–272. [Google Scholar] [CrossRef]
- Mackenzie, L.; Suzuki, T.; Adamson, J. Elimination and differential transformation of Yessotoxin by the greenshell mussel Perna canaliculus and the blue mussel Mytilus galloprovincialis. In Harmful Algal Blooms 2000; Hallegraeff, G.M., Blackburn, S.I., Bolch, C.J., Lewis, R.J., Eds.; IOC of UNESCO: Paris, France, 2001; pp. 371–374. [Google Scholar]
- Amzil, Z.; Sibat, M.; Royer, F.; Savar, V. First report on azaspiracid and yessotoxin groups detection in French shellfish. Toxicon 2008, 52, 39–48. [Google Scholar] [CrossRef] [Green Version]
- Suzuki, T.; Mitsuya, T. Comparison of dinophysistoxin-1 and esterified dinophysistoxin-1 (dinophysistoxin-3) contents in the scallop Patinopecten yessoensis and the mussel Mytilus galloprovincialis. Toxicon 2001, 39, 905–908. [Google Scholar] [CrossRef]
- Vale, P.; de Sampayo, M.A.M. Seasonality of diarrhetic shellfish poisoning at a coastal lagoon in Portugal: Rainfall patterns and folk wisdom. Toxicon 2003, 41, 187–197. [Google Scholar] [CrossRef]
- Vale, P.; de Sampayo, M.A.M. Esterification of DSP toxins by Portuguese bivalves from the northwest coast determined by LC-MS-a widespread phenomenon. Toxicon 2002, 40, 33–42. [Google Scholar] [CrossRef]
- Reizopoulou, S. Okadaic acid accumulation in macrofilter feeders subjected to natural blooms of Dinophysis acuminata. Harmful Algae 2008, 7, 228–234. [Google Scholar] [CrossRef]
- Garcia-Portela, M.; Reguera, B.; Sibat, M.; Altenburger, A.; Rodriguez, F.; Hess, P. Metabolomic Profiles of Dinophysis acuminata and Dinophysis acuta Using Non-Targeted High-Resolution Mass Spectrometry: Effect of Nutritional Status and Prey. Mar. Drugs 2018, 16, 143. [Google Scholar] [CrossRef] [PubMed]
- Garcia-Portela, M.; Riobo, P.; Reguera, B.; Garrido, J.L.; Blanco, J.; Rodriguez, F. Comparative ecophysiology of Dinophysis acuminata and D-acuta (Dinophyceae, Dinophysiales): Effect of light intensity and quality on growth, cellular toxin content, and photosynthesis. J. Phycol. 2018, 54, 899–917. [Google Scholar] [CrossRef]
- Sibat, M.; Garcia-Portela, M.; Hess, P. First identification of a C9-diol-ester of okadaic acid in Dinophysis acuta from Galician Rias Baixas (NW Spain). Toxicon 2018, 153, 19–22. [Google Scholar] [CrossRef]
- McMahon, G.; Silke, J.; Nixon, E.; Taaffe, B.; Nolan, A.; McGovern, I.; Doyle, J. Seasonal variation in diarrhetic shellfish toxins in mussels from the southwest coast of Ireland in 1994. In Irish Marine Science 95; Keegan, B.F., O’Connor, R., Eds.; Galway University Press: Galway, Spain, 1996; pp. 417–432. [Google Scholar]
- Pescadegalicia.com. Available online: https://www.pescadegalicia.gal/cotizaciones/ventas.aspx (accessed on 4 April 2019).
- Prego, R.; Fraga, F. A simple model to calculate the residual flows in a Spanish ria. Hydrographic consequences in the ria of Vigo. Estuar. Coast. Shelf Sci. 1992, 34, 603–615. [Google Scholar] [CrossRef]
- Álvarez-Salgado, X.A.; Gago, J.; Míguez, B.M.; Gilcoto, M.; Pérez, F.F. Surface Waters of the NW Iberian Margin: Upwelling on the Shelf versus Outwelling of Upwelled Waters from the Rías Baixas. Estuar. Coast. Shelf Sci. 2000, 51, 821–837. [Google Scholar] [CrossRef]
- Crespo, B.; Figueiras, F.; Porras, P.; Teixeira, I. Downwelling and dominance of autochthonous dinoflagellates in the NW Iberian margin: The example of the Ría de Vigo. Harmful Algae 2006, 5, 770–781. [Google Scholar] [CrossRef]
- Figueiras, F.G.; Jones, K.J.; Mosquera, A.M.; Alvarez-Salgado, X.A.; Edwards, A.; MacDougall, N. Red tide assemblage formation in an estuarine upwelling ecosystem: Ria de Vigo. J. Plankton Res. 1994, 16, 857–878. [Google Scholar] [CrossRef]
- Seeyave, S.; Probyn, T.; Álvarez-Salgado, X.A.; Figueiras, F.G.; Purdie, D.A.; Barton, E.D.; Lucas, M. Nitrogen uptake of phytoplankton assemblages under contrasting upwelling and downwelling conditions: The Ría de Vigo, NW Iberia. Estuar. Coast. Shelf Sci. 2013, 124, 1–12. [Google Scholar] [CrossRef]
- European Commission. Regulation (EC) No 854/2004 of the European Parliament and of the Council of 29 April 2004 laying down specific rules for the organisation of official controls on products of animal origin intended for human consumption. Off. J. Eur. Union 2004, L155, 206. [Google Scholar]
- EFSA Panel on Contaminants in the Food Chain. Marine biotoxins in shellfish—Okadaic acid and analogues. Scientific Opinion of the Panel on Contaminants in the Food chain. EFSA J. 2008, 6, 589. [Google Scholar] [CrossRef]
- European Commission. Commission Implementing Regulation (EU) 2019/627 of 15 March 2019 laying down uniform practical arrangements for the performance of official controls on products of animal origin intended for human consumption in accordance with Regulation (EU) 2017/625 of the European Parliament and of the Council and amending Commission Regulation (EC) No 2074/2005 as regards official controls. Off. J. Eur. Union 2019, L131, 51. [Google Scholar]
- Mariño, J.; Maneiro, J.; Blanco, J. The harmful algae monitoring programme of Galicia: Good value for money. In Harmful Algae; Reguera, B., Blanco, J., Fernández, M.L., Wyatt, T., Eds.; Xunta de Galicia and Intergovernmental Oceanographic Commission of UNESCO: Santiago de Compostela, Spain, 1998; pp. 229–232. [Google Scholar]
- Maneiro, J.; Arévalo, F.; Bermúdez, M.; Salgado, C.; Moroño, A.; Pazos, Y. El sistema de control de episodios tóxicos de Galicia: Predicción y gestión de la advección de una floración de Dinophysis acuminata. In VI Reunión Ibérica sobre Fitoplancton Tóxico y Biotoxinas; Márquez, I., Ed.; Junta de Andalucía: Sevilla, Spain, 2000; pp. 29–39. [Google Scholar]
- EURLMB. EU-Harmonised Standard Operating Procedure for Determination of Lipophilic Marine Biotoxins in Molluscs by LC-MS/MS. Version 4. Available online: http://aesan.msssi.gob.es/CRLMB/docs/docs/metodos_analiticos_de_desarrollo/EU-Harmonised-SOP-LIPO-LCMSMS_Version4.pdf (accessed on 15 April 2014).
- Gerssen, A.; Mulder, P.P.J.; McElhinney, M.A.; de Boer, J. Liquid chromatography–tandem mass spectrometry method for the detection of marine lipophilic toxins under alkaline conditions. J. Chromatogr. A 2009, 1216, 1421–1430. [Google Scholar] [CrossRef] [PubMed]
- Gerssen, A.; van Olst, E.H.W.; Mulder, P.P.J.; de Boer, J. In-house validation of a liquid chromatography tandem mass spectrometry method for the analysis of lipophilic marine toxins in shellfish using matrix-matched calibration. Anal. Bioanal. Chem. 2010, 397, 3079–3088. [Google Scholar] [CrossRef] [Green Version]
- Regueiro, J.; Rossignoli, A.E.; Alvarez, G.; Blanco, J. Automated on-line solid-phase extraction coupled to liquid chromatography tandem mass spectrometry for determination of lipophilic marine toxins in shellfish. Food Chem. 2011, 129, 533–540. [Google Scholar] [CrossRef]
- R. Core Team. R: A Language and Environment for Statistical Computing; R Foundation for Statistical Computing: Vienna, Austria, 2014. [Google Scholar]
- Wickham, H. ggplot2: Elegant Graphics for Data Analysis; Springer: Berlin/Heidelberg, Germany, 2016. [Google Scholar]
- Buuren, S.V.; Groothuis-Oudshoorn, K. Mice: Multivariate Imputation by Chained Equations in R. J. Stat. Softw. 2011, 45, 1–67. [Google Scholar] [CrossRef]
- Josse, J.; Husson, F. missMDA: A Package for Handling Missing Values in Multivariate Data Analysis. J. Stat. Softw. 2016, 70, 1–31. [Google Scholar] [CrossRef]
- Galili, T. dendextend: An R package for visualizing, adjusting, and comparing trees of hierarchical clustering. Bioinformatics 2015, 31, 3718–3720. [Google Scholar] [CrossRef]
- De Mendiburu, F. Agricolae: Statistical Procedures for Agricultural Research; R package version 1.3-1. Available online: https://CRAN.R-project.org/package=agricolae (accessed on 20 October 2019).
- Hothorn, T.; Bretz, F.; Westfall, P. Simultaneous Inference in General Parametric Models. Biom. J. 2008, 50, 346–363. [Google Scholar] [CrossRef] [PubMed] [Green Version]
- Warton, D.I.; Duursma, R.A.; Falster, D.S.; Taskinen, S. Smatr 3—An R package for estimation and inference about allometric lines. Methods Ecol. Evol. 2012, 3, 257–259. [Google Scholar] [CrossRef]


| Toxin | ESI | Precursor Ion (m/z) | Product Ion (m/z) | Collision Energy (eV) | Cone Voltage (V) | LOQ | LOD |
|---|---|---|---|---|---|---|---|
| OA | - | 803.5 | 255.2 * | 46 | 86 | 40 µg OA-eq·kg−1 | 2 µg OA-eq·kg−1 |
| 113 | 56 | 86 | |||||
| DTX2 | - | 803.5 | 255.2 * | 46 | 86 | 24 µg OA-eq·kg−1 | 2 µg OA-eq·kg−1 |
| 113 | 56 | 86 | |||||
| DTX1 | - | 817.5 | 563.4 | 43 | 86 | 40 µg OA-eq·kg−1 | 2 µg OA-eq·kg−1 |
| 255.2 * | 48 | 86 | |||||
| YTX | - | 570.4 | 467.4 * | 30 | 45 | 0.06 mg YTX-eq·kg−1 | 0.001 mg YTX-eq·kg−1 |
| 396.3 | 35 | 45 | |||||
| 45OH-YTX | - | 578.4 | 467.4 * | 30 | 45 | 0.06 mg YTX-eq·kg−1 | 0.001 mg YTX-eq·kg−1 |
| 396.4 | 30 | 45 | |||||
| HomoYTX | - | 577.5 | 474.4 * | 30 | 48 | 0.06 mg YTX-eq·kg−1 | 0.001 mg YTX-eq·kg−1 |
| 403.4 | 30 | 48 | |||||
| 45OH-homoYTX | - | 585.5 | 403.4 | 30 | 45 | 0.06 mg YTX-eq·kg·1 | 0.001 mg YTX-eq·kg−1 |
| 474.4 * | 30 | 45 | |||||
| PTX1 | + | 892.5 | 839.5 | 25 | 36 | 40 µg OA-eq·kg−1 | 0.4 µg OA-eq·kg−1 |
| 821.5 * | 25 | 36 | |||||
| PTX2 | + | 876.5 | 841.5 | 20 | 36 | 40 µg OA-eq·kg−1 | 0.4 µg OA-eq·kg−1 |
| 823.5 * | 25 | 36 | |||||
| AZA1 | + | 842.5 | 654.5 * | 55 | 50 | 40 µg AZA1-eq·kg−1 | 4 µg AZA1-eq·kg−1 |
| 362.2 | 50 | 50 | |||||
| AZA2 | + | 856.5 | 672.5 * | 45 | 27 | 42 µg AZA1-eq·kg−1 | 4 µg AZA1-eq·kg−1 |
| 654.5 | 45 | 27 | |||||
| AZA3 | + | 828.5 | 640.4 | 55 | 47 | 41 µg AZA1-eq·kg−1 | 4 µg AZA1-eq·kg−1 |
| 362.2 * | 55 | 47 |
© 2019 by the authors. Licensee MDPI, Basel, Switzerland. This article is an open access article distributed under the terms and conditions of the Creative Commons Attribution (CC BY) license (http://creativecommons.org/licenses/by/4.0/).
Share and Cite
Blanco, J.; Arévalo, F.; Correa, J.; Moroño, Á. Lipophilic Toxins in Galicia (NW Spain) between 2014 and 2017: Incidence on the Main Molluscan Species and Analysis of the Monitoring Efficiency. Toxins 2019, 11, 612. https://0-doi-org.brum.beds.ac.uk/10.3390/toxins11100612
Blanco J, Arévalo F, Correa J, Moroño Á. Lipophilic Toxins in Galicia (NW Spain) between 2014 and 2017: Incidence on the Main Molluscan Species and Analysis of the Monitoring Efficiency. Toxins. 2019; 11(10):612. https://0-doi-org.brum.beds.ac.uk/10.3390/toxins11100612
Chicago/Turabian StyleBlanco, Juan, Fabiola Arévalo, Jorge Correa, and Ángeles Moroño. 2019. "Lipophilic Toxins in Galicia (NW Spain) between 2014 and 2017: Incidence on the Main Molluscan Species and Analysis of the Monitoring Efficiency" Toxins 11, no. 10: 612. https://0-doi-org.brum.beds.ac.uk/10.3390/toxins11100612