2.1. Patient Characteristics
Table 1,
Table 2 and
Table 3 present the demographic and clinical characteristics of the 95 CKD patients, the 10 HD patients and the 10 healthy controls with normal renal function, respectively. Besides differences in renal function among the CKD stages, no dissimilarities were observed among the different CKD stages for age, gender, body mass index (BMI), diabetes mellitus (DM) and albumin concentration.
Table 1.
Demographic and clinical characteristics of the CKD patients.
Table 1.
Demographic and clinical characteristics of the CKD patients.
| Characteristics | CKD patients |
|---|
| CKD 2 to 5 | CKD 2 | CKD 3 | CKD 4 | CKD 5 |
|---|
| Number, n (%) | 95 (100) | 11 (11.5) | 37 (39) | 37 (39) | 10 (10.5) |
| Age (years) | 69 (59;76) | 62 (59;71) | 74 (61;77) | 69 (55;74) | 79 (60;83) |
| Male gender, n (%) | 59 (62) | 9 (82) | 24 (65) | 22 (60) | 4 (40) |
| BMI (kg/m2) | 29 (25;32) | 27 (21;29) | 29 (25;32) | 29 (26;34) | 25 (23;30) |
| DM, n (%) | 45 (47) | 4 (36) | 19 (51) | 18 (49) | 4 (40) |
| Albumin (g/L) | 39 (35;44) | 42 (37;47) | 38 (35;42) | 41 (35;44) | 33 (28;39) |
| Renal function 1 (mL/min) | 32 (20;49) | 67 (63;71) | 45 (35;51) | 22 (19;25) °,+ | 11 (9;13) °,+ |
Table 2.
Demographic and clinical characteristics of the HD patients.
Table 2.
Demographic and clinical characteristics of the HD patients.
| Characteristics | HD patients |
|---|
| Age (years) | 72 (61;78) |
| Male gender, n (%) | 8 (80) |
| Ultrafiltration (mL/min) | 4.8 (3.5;8.9) |
| BMI (kg/m2) | 28 (25;28) |
| DM, n (%) | 5 (50) |
| Total protein (g/L) | 60 (58;67) |
| Renal function (mL/min) | 2.6 (0.0;4.1) |
Table 3.
Demographic and clinical characteristics of the healthy controls.
Table 3.
Demographic and clinical characteristics of the healthy controls.
| Characteristics | Healthy controls |
|---|
| Age (years) | 40 (33;57) |
| Male gender, n (%) | 4 (40) |
| BMI (kg/m2) | 23 (19;27) |
The median percentage protein binding (%PB), the free and total concentration of
p-cresylglucuronide (
pCG), hippuric acid (HA), indole-3-acetic acid (IAA), indoxyl sulfate (IS) and
p-cresylsulfate (
pCS) are shown in
Table 4 for an increasing degree of kidney failure,
i.e., consecutively for the healthy controls, the CKD patients and the HD patients. Since the three groups differ in origin, nutrition and hospital center, they were not statistically compared to each other.
For the healthy controls, the free and total concentration of pCG were below the limit of quantification (LOQ), and the %PB could not be calculated. The median %PB was 34% (HA), 83% (IAA), 84% (IS) and 94% (pCS).
Table 4.
Percentage protein binding (%PB), free (CF) and total (CT) concentration of protein-bound solutes in healthy controls with normal renal function, in CKD and HD patients (pre-dialysis).
Table 4.
Percentage protein binding (%PB), free (CF) and total (CT) concentration of protein-bound solutes in healthy controls with normal renal function, in CKD and HD patients (pre-dialysis).
| Uremic Toxin | %PB or Concentration | Healthy controls | CKD | HD |
|---|
| CKD 2 | CKD 3 | CKD 4 | CKD 5 |
|---|
| pCG | %PB CF (mg/dL) CT (mg/dL) | - <LOQ <LOQ | 7(3;24) 0.03(0.03;0.04) 0.03(0.03;0.05) | 10(6;14) 0.03(0.03;0.04) 0.04(0.03;0.04) | 9(6;16) 0.04(0.03;0.07) 0.05(0.03;0.08) | 8(5;20) 0.20(0.07;0.25) °,+ 0.25(0.08;0.28) °,+,# | 12(9;19) 0.31(0.22;0.85) 0.35(0.25;0.99) |
| HA | %PB CF (mg/dL) CT (mg/dL) | 34(22;39) 0.13(0.10;0.16) 0.17(0.11;0.25) | 38(34;42) 0.23(0.18;0.38) 0.39(0.32;0.58) | 38(34;43) 0.20(0.18;0.32) 0.33(0.27;0.53) | 38(35;44) 0.30(0.21;0.42) 0.51(0.33;0.53) | 43(36;45) 0.54(0.34;0.69) + 0.93(0.51;1.25) + | 39(32;54) 1.59(0.73;3.30) 2.41(1.57;5.42) |
| IAA | %PB CF (mg/dL) CT (mg/dL) | 83(78;84) 0.01(0.01;0.01) 0.04(0.03;0.05) | 60(56;66) 0.02(0.02;0.02) 0.06(0.05;0.07) | 67(61;75) 0.03(0.02;0.03) 0.08(0.06;0.12) | 66(61;72) 0.03(0.03;0.03) °,(+) 0.09(0.07;0.11) ° | 68(65;71) 0.03(0.03;0.04) °,+ 0.11(0.10;0.15) ° | 69(63;80) 0.07(0.04;0.11) 0.19(0.13;0.33) |
| IS | %PB CF (mg/dL)CT (mg/dL) | 84(77;88) 0.02(0.01;0.02) 0.10(0.06;0.14) | 77(71;83) 0.03(0.03;0.03) 0.16(0.11;0.18) | 86(80;90) 0.03(0.03;0.03) 0.23(0.16;0.35) | 89(87;92) °,+ 0.04(0.03;0.04) °,+ 0.36(0.28;0.55) °,+ | 92(90;95) °,+ 0.06(0.03;0.08) °,+ 0.79(0.31;1.50) °,+ | 93(90;95) 0.08(0.04;0.21) 1.40(0.69;2.18) |
| pCS | %PB CF (mg/dL) CT (mg/dL) | 94(87;96) 0.02(0.01;0.02) 0.31(0.08;0.47) | 93(89;96) 0.05(0.03;0.07) 0.47(0.38;0.70) | 97(96;97) ° 0.04(0.02;0.05) 0.95(0.59;1.37) | 96(95;97) 0.05(0.03;0.12) 1.19(0.65;2.52) ° | 94(93;95) + 0.21(0.12;0.31) +,# 3.29(1.52;4.47) °,+ | 95(93;97) 0.06(0.04;0.10) 2.06(1.14;2.87) |
In the different stages of CKD, the free and total concentrations of the weakly-bound solutes pCG and HA were only increased in CKD 5 patients, and for the stronger bound solutes IAA, IS and pCS, already at CKD Stage 4. The median percentage protein binding was in the range 7% to 8% (pCG), 38% to 43% (HA), 60% to 68% (IAA), 77% to 92% (IS) and 93% to 94% (pCS). For the highly-bound IS, %PB was increased in CKD 4 and 5 patients with respect to CKD 2 and 3 patients, while for pCS, %PB showed some variation, but without a clear trend. The median %PB in the HD patients was 12% (pCG), 39% (HA), 69% (IAA), 93% (IS) and 95% (pCS).
2.2. CKD Patients
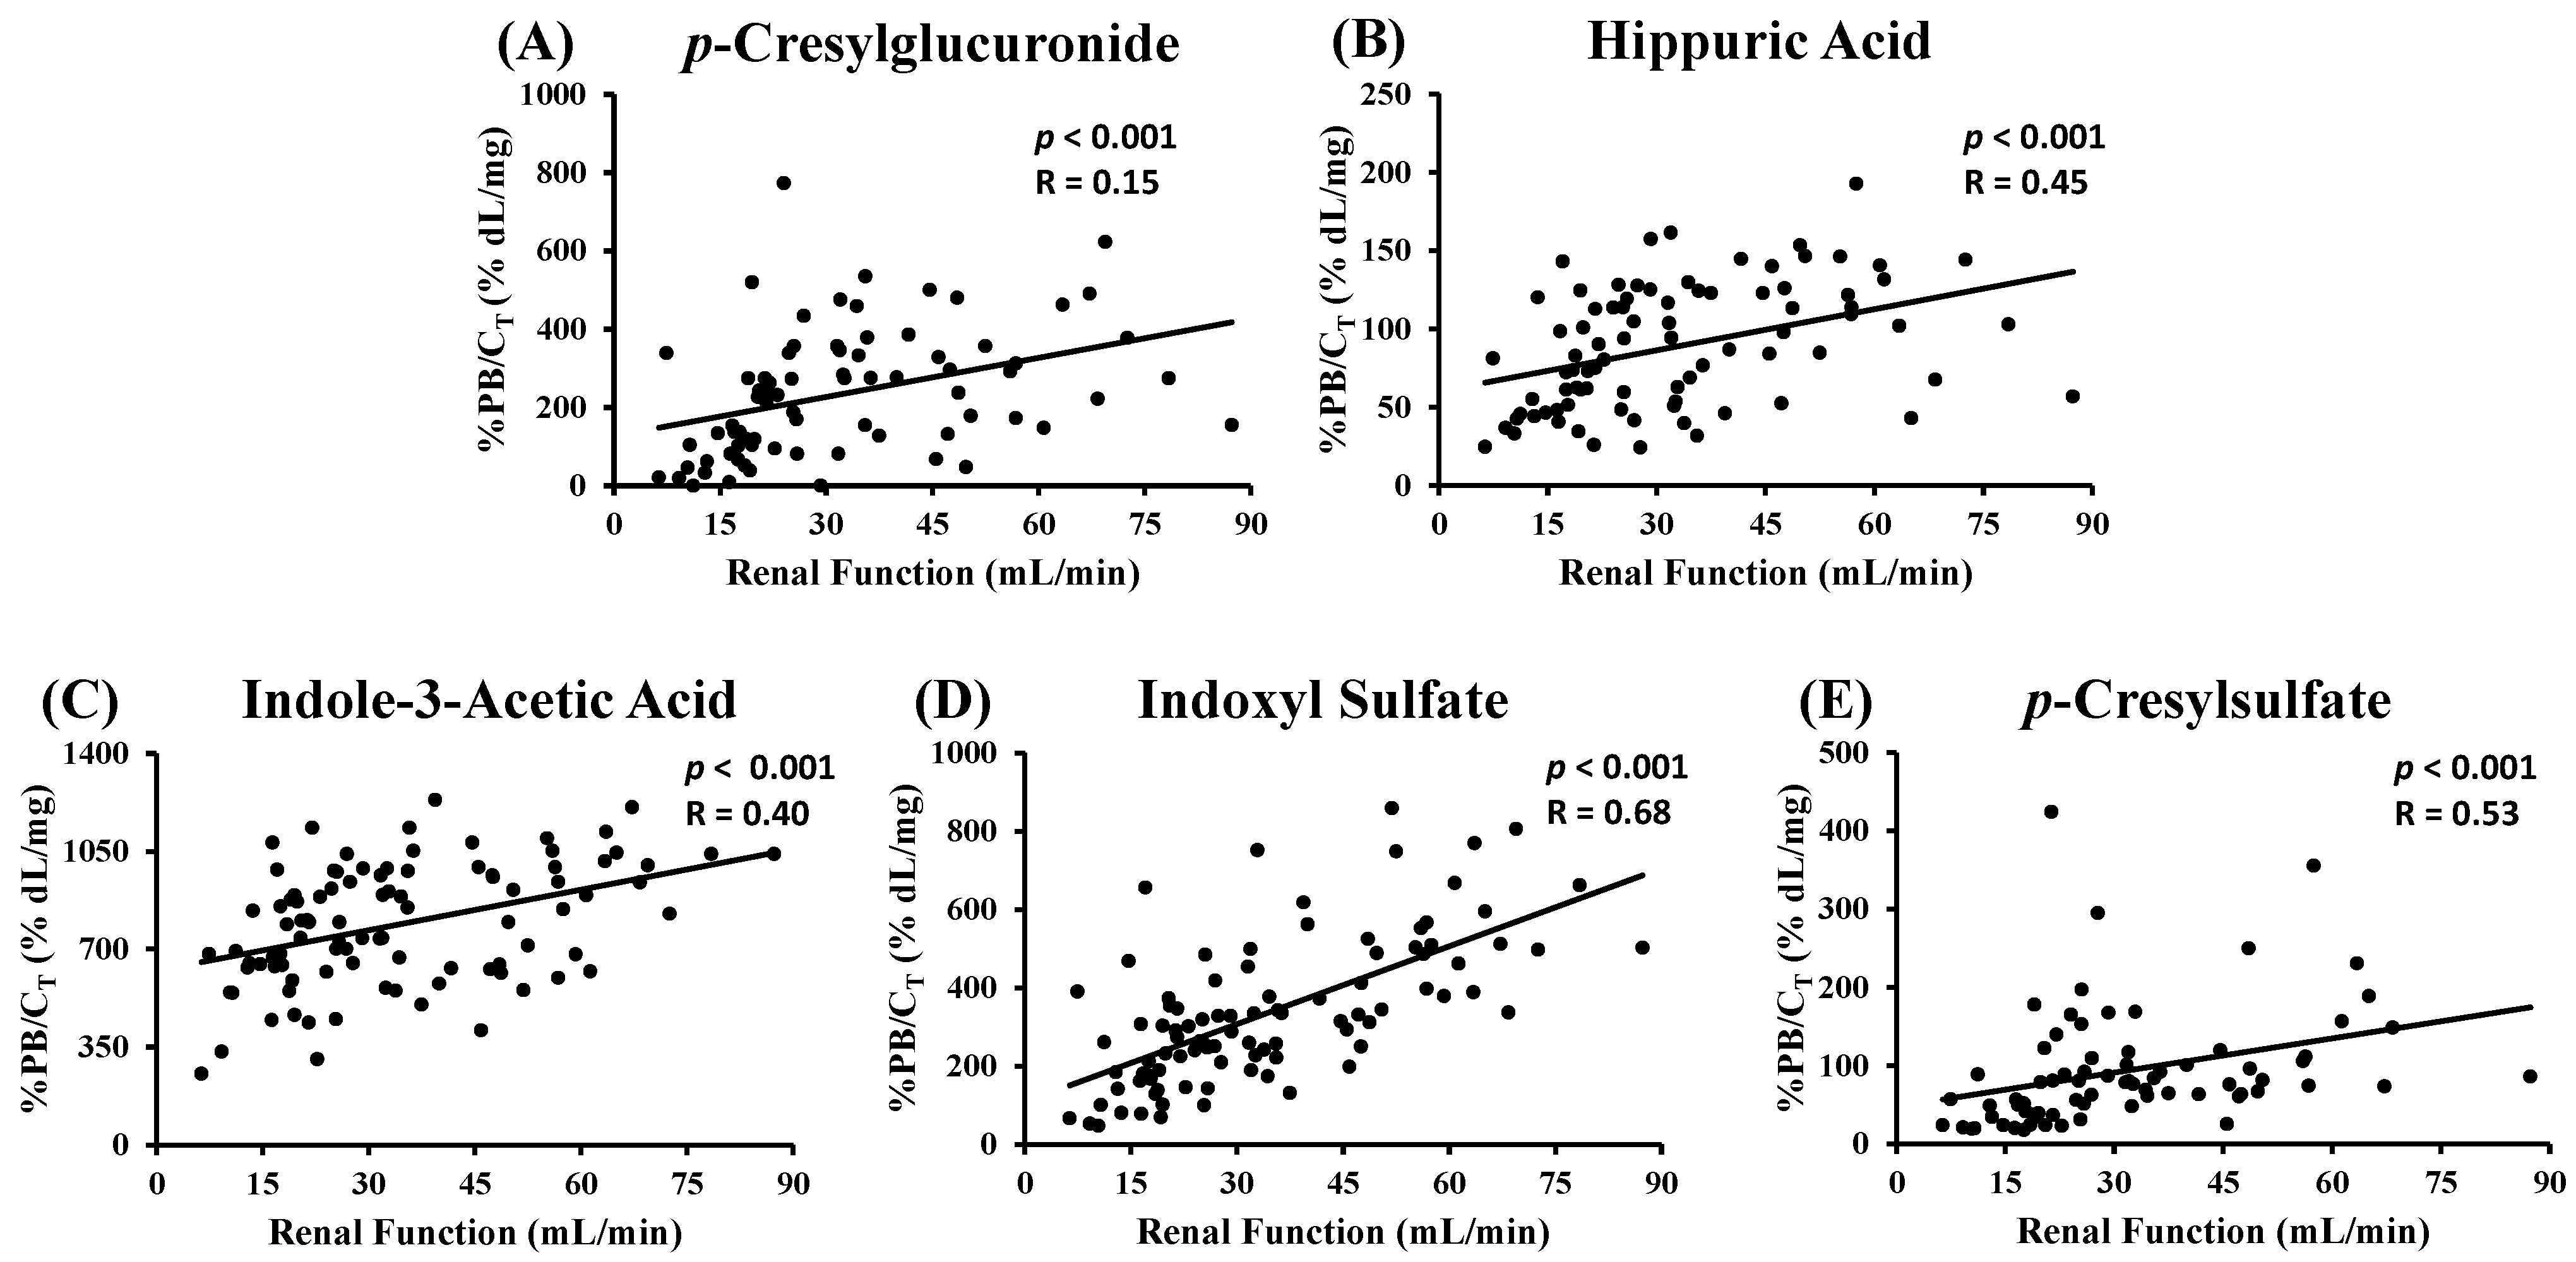
Considering the 95 CKD patients, only %PB of IS showed an (inverse) correlation with renal function (
R = −0.64;
p < 0.001) (
Figure S1 in the Supplementary Materials and
Table 5). Normalizing %PB for total toxin concentration, however, resulted in a positive correlation (all
p < 0.001) with renal function for all five uremic toxins (
Figure 1).
Figure 1.
Percentage protein binding (%PB) normalized for total toxin concentration (CT) versus renal function of CKD patients for: (A) p-cresylglucuronide; (B) hippuric acid; (C) indole-3-acetic acid; (D) indoxyl sulfate; and (E) p-cresylsulfate.
Figure 1.
Percentage protein binding (%PB) normalized for total toxin concentration (CT) versus renal function of CKD patients for: (A) p-cresylglucuronide; (B) hippuric acid; (C) indole-3-acetic acid; (D) indoxyl sulfate; and (E) p-cresylsulfate.
Table 5 shows the
p- and
R2-values of the correlation test between %PB and renal function in the 95 CKD patients. The influence of added covariates C
T, diabetes mellitus and the albumin concentration was checked, as shown in
Table 5.
The total toxin concentration improved the model (all
p < 0.05), except for
pCG (
Table 5). This result is in line with the correlations found in
Figure 1.
When diabetes mellitus was added to the model, only an improvement was found for IAA and IS (
Table 5). However, a lower
R2-value was given compared to C
T.
Including albumin concentration did not improve the correlation between %PB and renal function (
Table 5), neither did it correlate with %PB (
Figure S2). Therefore, the albumin concentration (in this range) did not have an influence on the %PB, as already published for other compounds in the literature [
13,
14].
Table 5.
p- and R2-values of the correlations between %PB and renal function for pCG, HA, IAA, IS and pCS and the influence of added covariates total toxin concentration (CT), diabetes mellitus (DM) and albumin concentration in CKD patients.
Table 5.
p- and R2-values of the correlations between %PB and renal function for pCG, HA, IAA, IS and pCS and the influence of added covariates total toxin concentration (CT), diabetes mellitus (DM) and albumin concentration in CKD patients.
| Uremic Toxin | %PB versus RF | Covariates |
|---|
| CT | DM | Albumin |
|---|
| p | R2 | p | R2 | p | R2 | p | R2 |
|---|
| pCG | 0.65 | - | 0.081 | - | 0.288 | - | 0.91 | - |
| HA | 0.40 | - | 0.008 | 0.23 | 0.623 | - | 0.49 | - |
| IAA | 0.18 | - | 0.002 | 0.71 | 0.028 | 0.034 | 0.85 | - |
| IS | <0.001 | 0.41 | <0.001 | 0.67 | <0.001 | 0.317 | 0.77 | - |
| pCS | 0.12 | - | 0.004 | 0.16 | 0.843 | - | 0.62 | - |
It is known that post-translational modifications of proteins increase as CKD progresses, with carbamylation, oxidation, glycosylation and guanidinylation as the most relevant processes [
7,
15]. Whether our result is influenced by these structural changes in the proteins or whether this is the result of competitive binding, leading to an enhanced free toxin concentration, remains unclear. Anyway, the presented results are in line with those for highly (around 90%) protein-bound compounds, like valproic acid or phenytoin, also showing a decreased protein binding in patients with renal failure [
16,
17].
2.3. HD Patients
In hemodialysis patients, median pre-dialysis %PB was 12% (
pCG), 39% (HA), 69% (IAA), 93% (IS) and 95% (
pCS).
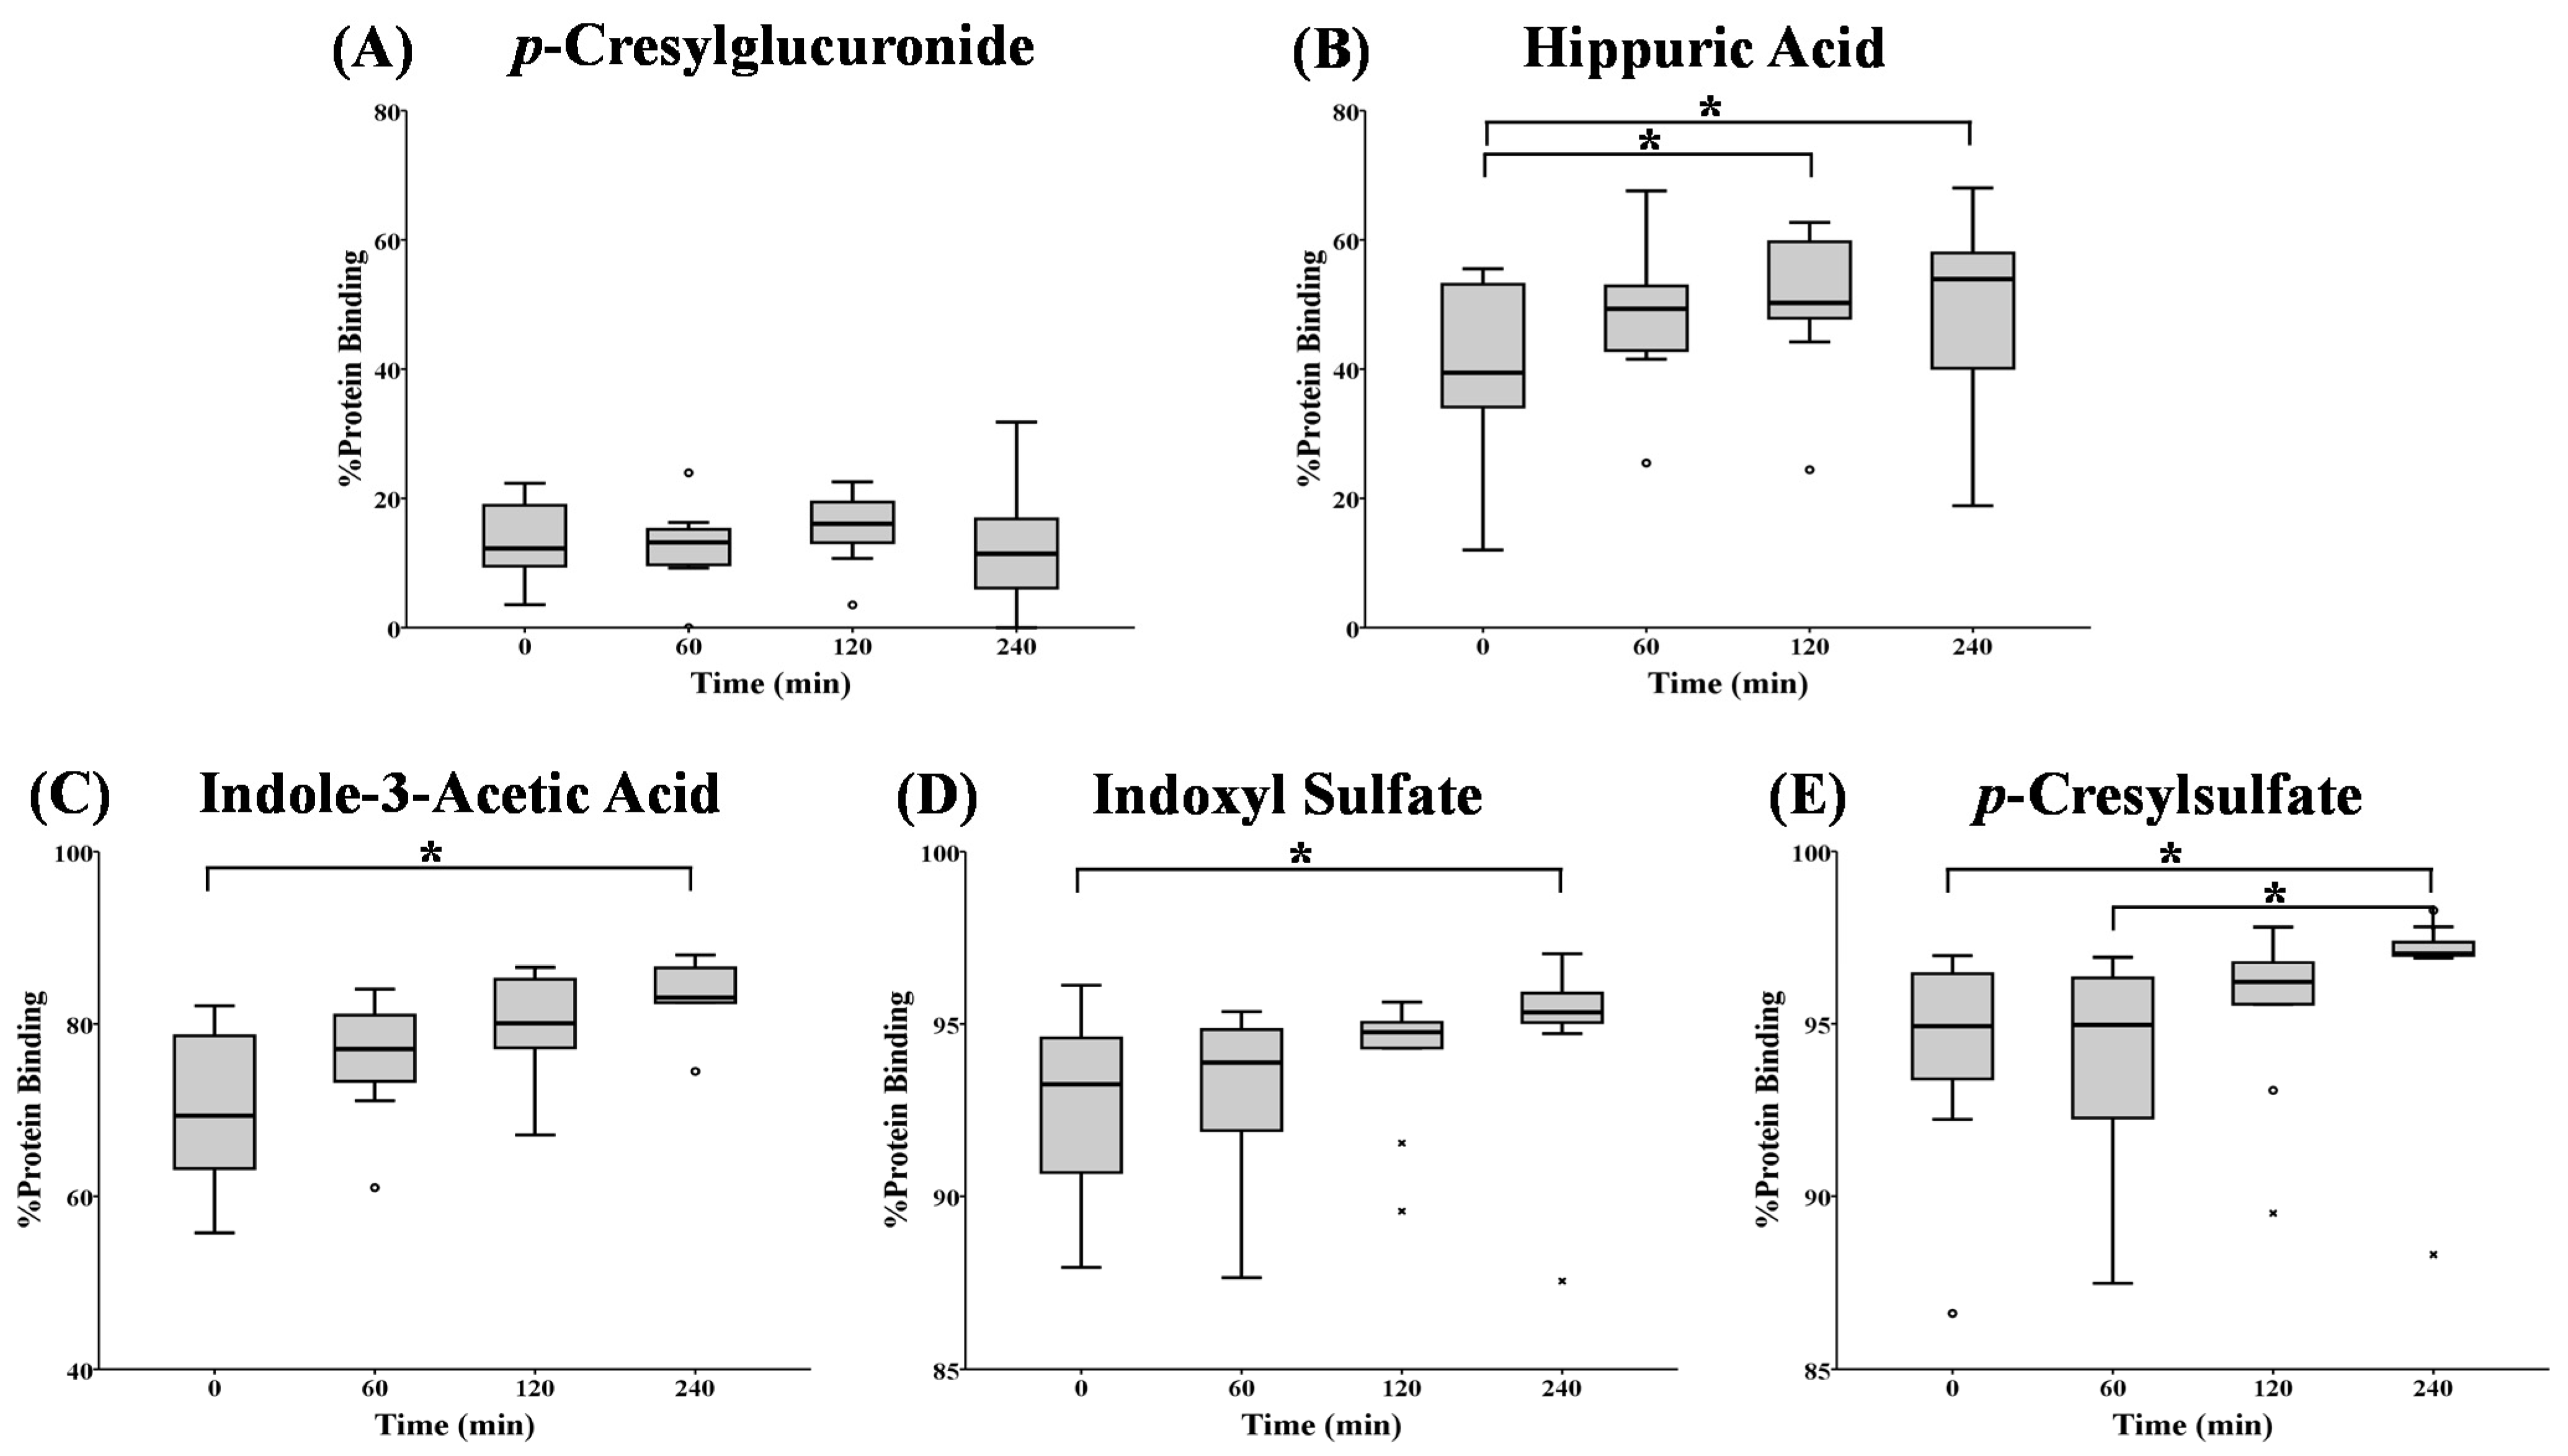
Figure 2 and
Table 6 show %PB determined at the inlet of the dialyzer, at the start (0 min) of the hemodialysis session and after 60, 120 and 240 min.
The total and free toxin concentrations were decreased from 120 min on for
pCG, HA and
pCS. For IAA, only the total concentration decreased from 120 min on and for IS, only the free concentration (
Table 6). No differences in %PB were observed during the HD session for the weakly-bound
pCG. For HA, %PB was increased after 120 and 240 min
versus HD start, while for the stronger (IAA) and highly-bound (IS and
pCS) solutes, this increase was only significant after 240 min (
Figure 2 and
Table 6).
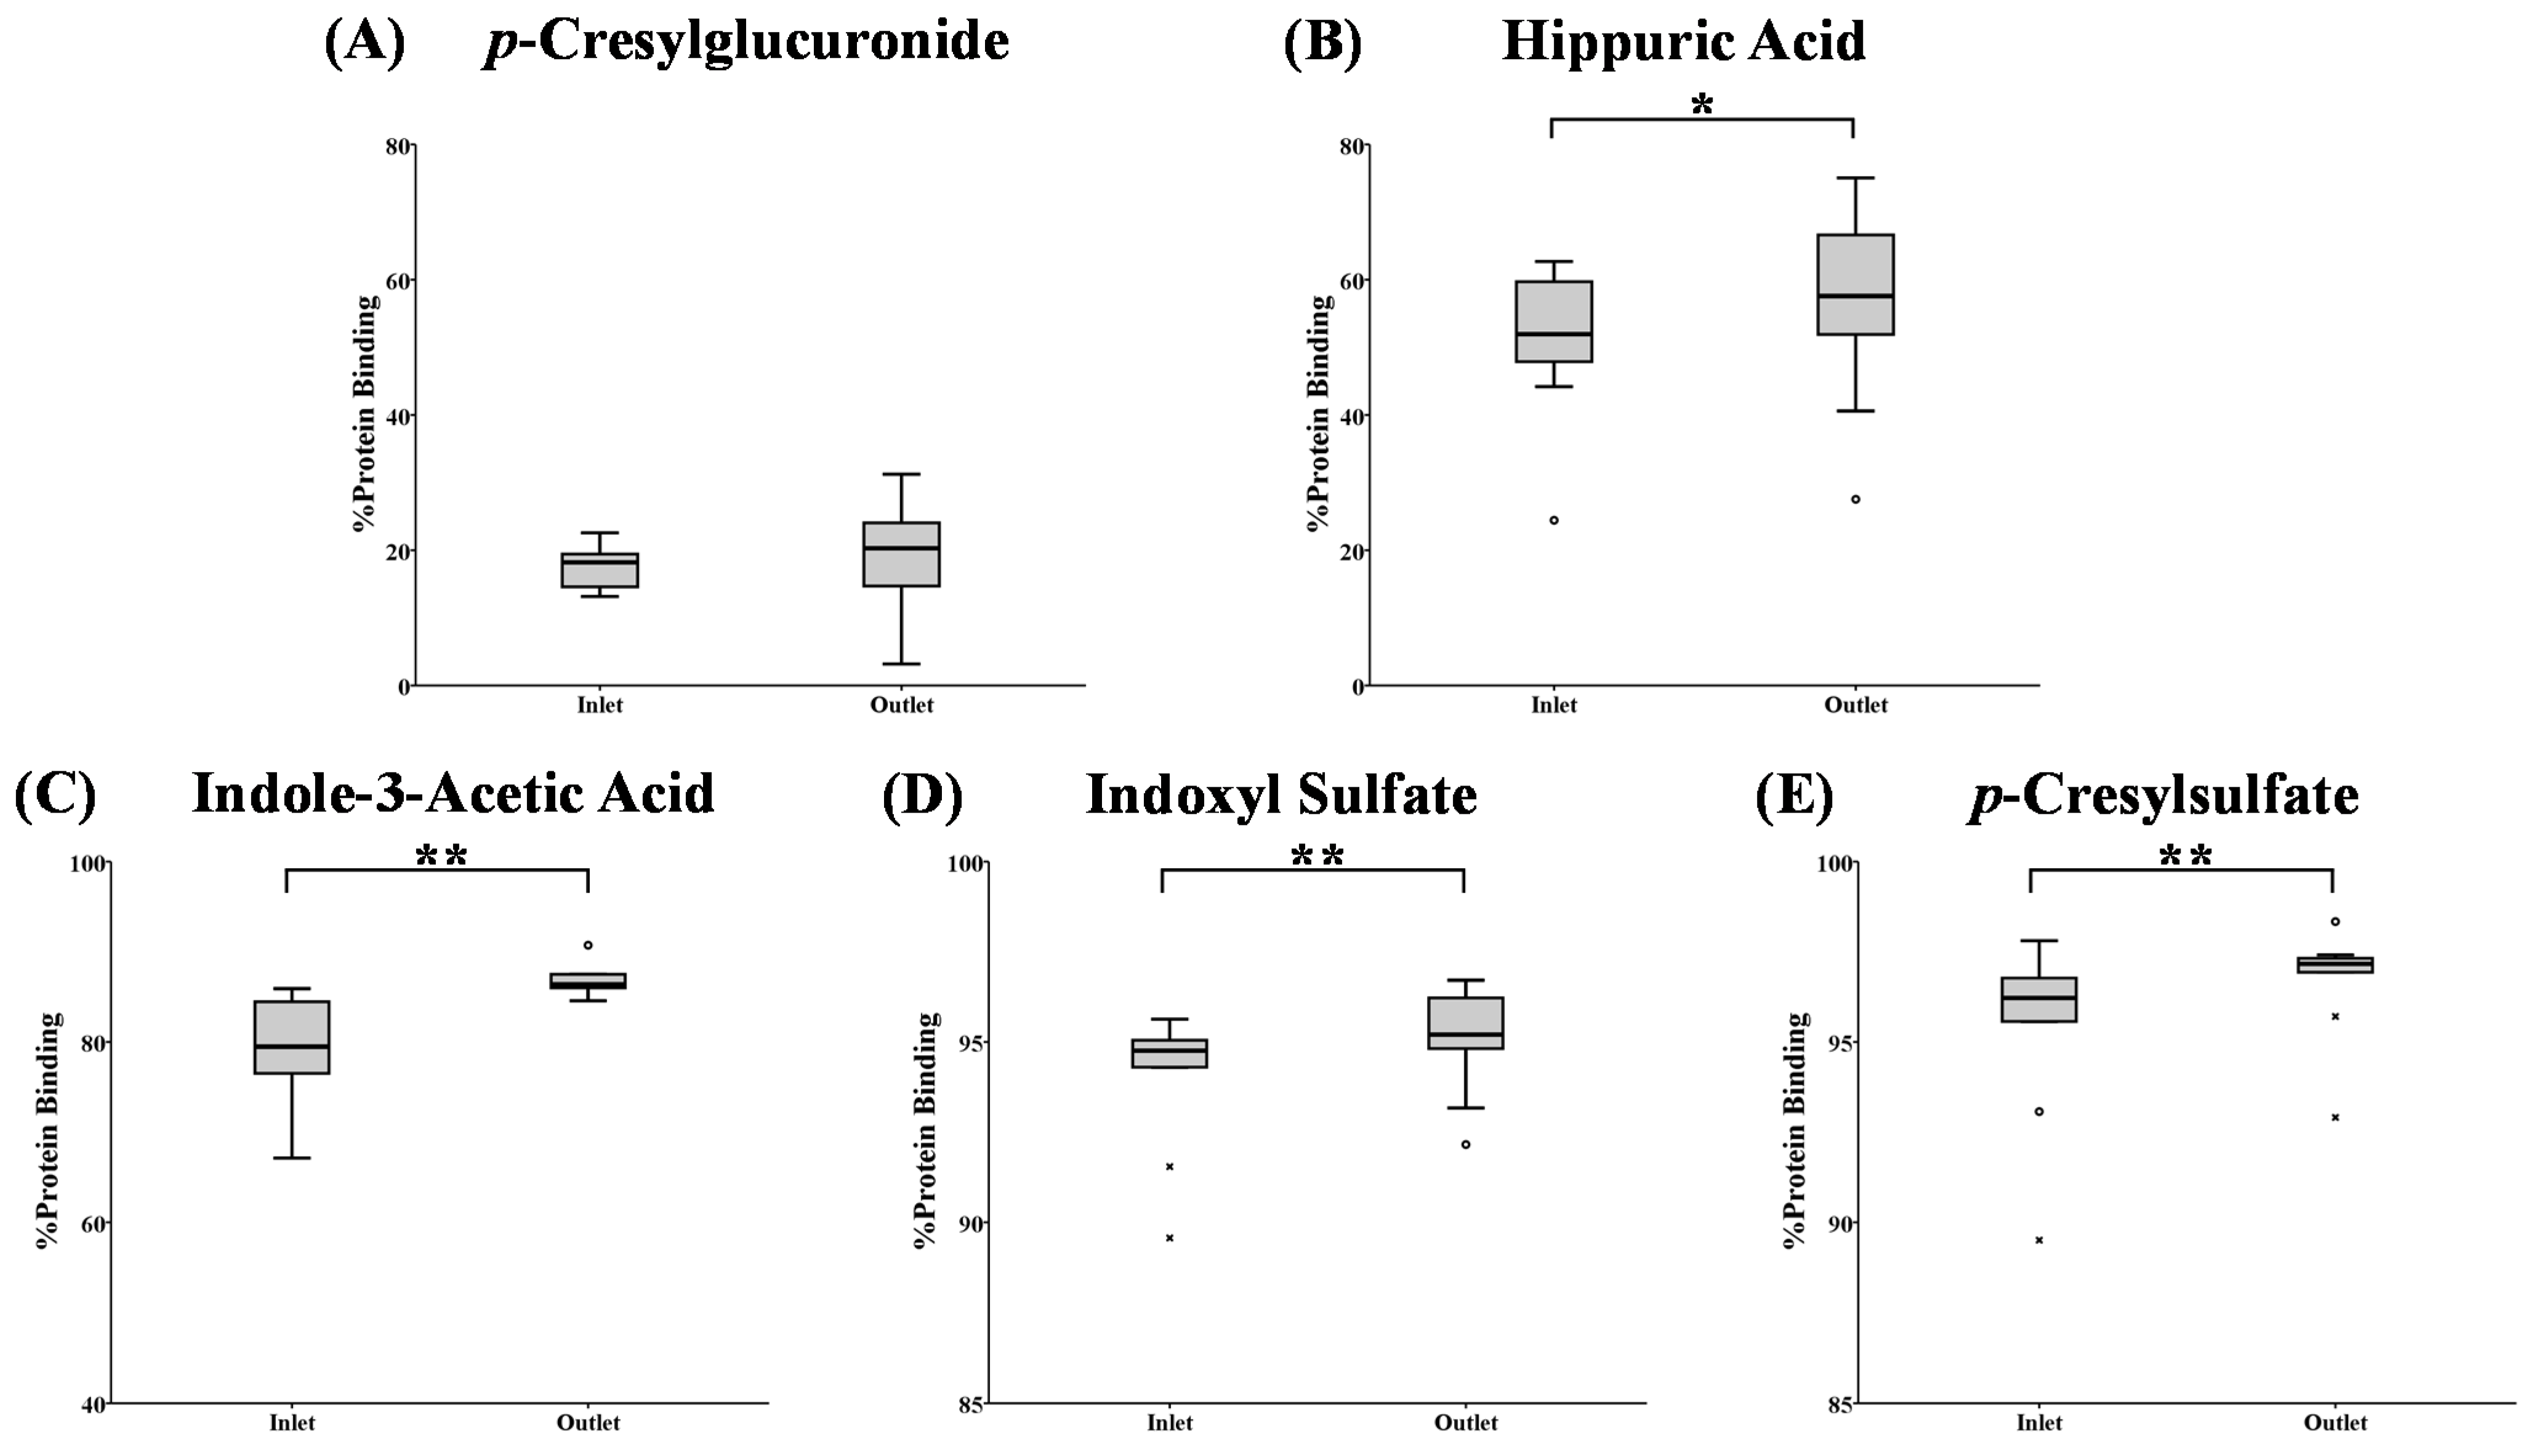
Changes in percentage protein binding from the dialyzer inlet towards the outlet as measured at 120 min after dialysis start are depicted in
Figure 3. For the weakly-bound
pCG, passage through the dialyzer did not influence the percentage binding. For HA, the %PB was increased with a borderline significance (
p = 0.066). The percentage protein binding for the stronger (IAA) and the highly-bound (IS and
pCS) solutes was significantly increased from dialyzer inlet to outlet at 120 min.
Figure 2.
Percentage protein binding at different time points during a hemodialysis (HD) session for: (A) p-cresylglucuronide; (B) hippuric acid; (C) indole-3-acetic acid; (D) indoxyl sulfate; and (E) p-cresylsulfate. * p < 0.05; o: outlier; x: extreme.
Figure 2.
Percentage protein binding at different time points during a hemodialysis (HD) session for: (A) p-cresylglucuronide; (B) hippuric acid; (C) indole-3-acetic acid; (D) indoxyl sulfate; and (E) p-cresylsulfate. * p < 0.05; o: outlier; x: extreme.
Table 6.
Percentage protein binding, free and total concentration of protein-bound solutes in HD patients at different time points during an HD session.
Table 6.
Percentage protein binding, free and total concentration of protein-bound solutes in HD patients at different time points during an HD session.
| Uremic Toxin | %PB or Concentration | 0 min | 60 min | 120 min | 240 min |
|---|
| pCG | %PB CF (mg/dL) CT (mg/dL) | 12(9;19) 0.31(0.22;0.85) 0.35(0.25;0.99) | 13(10;15) 0.14(0.11;0.44) 0.17(0.12;0.45) | 10(13;20) 0.11(0.07;0.29) ° 0.14(0.08;0.36) ° | 11(5;19) 0.08(0.04;0.16) °,+ 0.10(0.05;0.19) °,+ |
| HA | %PB CF (mg/dL) CT (mg/dL) | 39(32;54) 1.59(0.73;3.30) 2.41(1.57;5.42) | 49(43;54) 0.91(0.41;1.84) 1.42(0.99;3.52) | 50(47;60) ° 0.70(0.44;1.37) °1.37(0.97;2.55) ° | 54(39;58) ° 0.42(0.32;0.82) °,+ 0.95(0.61;1.49) °,+ |
| IAA | %PB CF (mg/dL) CT (mg/dL) | 69(63;80) 0.07(0.04;0.11) 0.19(0.13;0.33) | 77(72;82) 0.04(0.02;0.08) 0.14(0.10;0.26) | 80(77;86) 0.03(0.02;0.06) 0.13(0.10;0.23) ° | 83(78;87) °0.03(0.02;0.07) ° 0.10(0.08;0.16) °,+ |
| IS | %PB CF (mg/dL) CT (mg/dL) | 93(90;95) 0.08(0.04;0.21) 1.40(0.69;2.18) | 94(91;95) 0.06(0.04;0.16) 1.14(0.60;1.97) | 95(94;95) 0.06(0.03;0.12) ° 1.06(0.56;1.75) | 95(95;96) ° 0.03(0.02;0.07) °,+ 0.72(0.48;1.47) °,+ |
| pCS | %PB CF (mg/dL) CT (mg/dL) | 95(93;97) 0.12(0.10;0.24) 2.76(1.75;4.25) | 95(92;96) 0.13(0.09;0.19) 2.46(1.45;3.70) | 96(95;97) 0.09(0.07;0.14) ° 2.27(1.32;3.41) ° | 97(97;97) °,+ 0.06(0.04;0.10) °,+ 2.06(1.14;2.87) °,+ |
Figure 3.
Percentage protein binding at the dialyzer inlet versus outlet after 120 min since dialysis start for: (A) p-cresylglucuronide; (B) hippuric acid; (C) indole-3-acetic acid; (D) indoxyl sulfate; and (E) p-cresylsulfate. ** p < 0.05 versus the inlet; * p = 0.066 versus the inlet; o: outlier; x: extreme.
This is the first time that it has been demonstrated that the percentage protein binding for stronger bound solutes changes during dialysis, and this is both within the dialyzer itself during a single passage and within a patient (
i.e., during the course of the dialysis session). The influence of hemoconcentration on these observations was checked by a correlation test between the change in %PB and the change in total protein concentration at the inlet and outlet of the dialyzer, but no significant correlation was found (
Figure S3). Neither can this be explained by changes in pH, since we only observed limited pH changes during the course of a dialysis session.
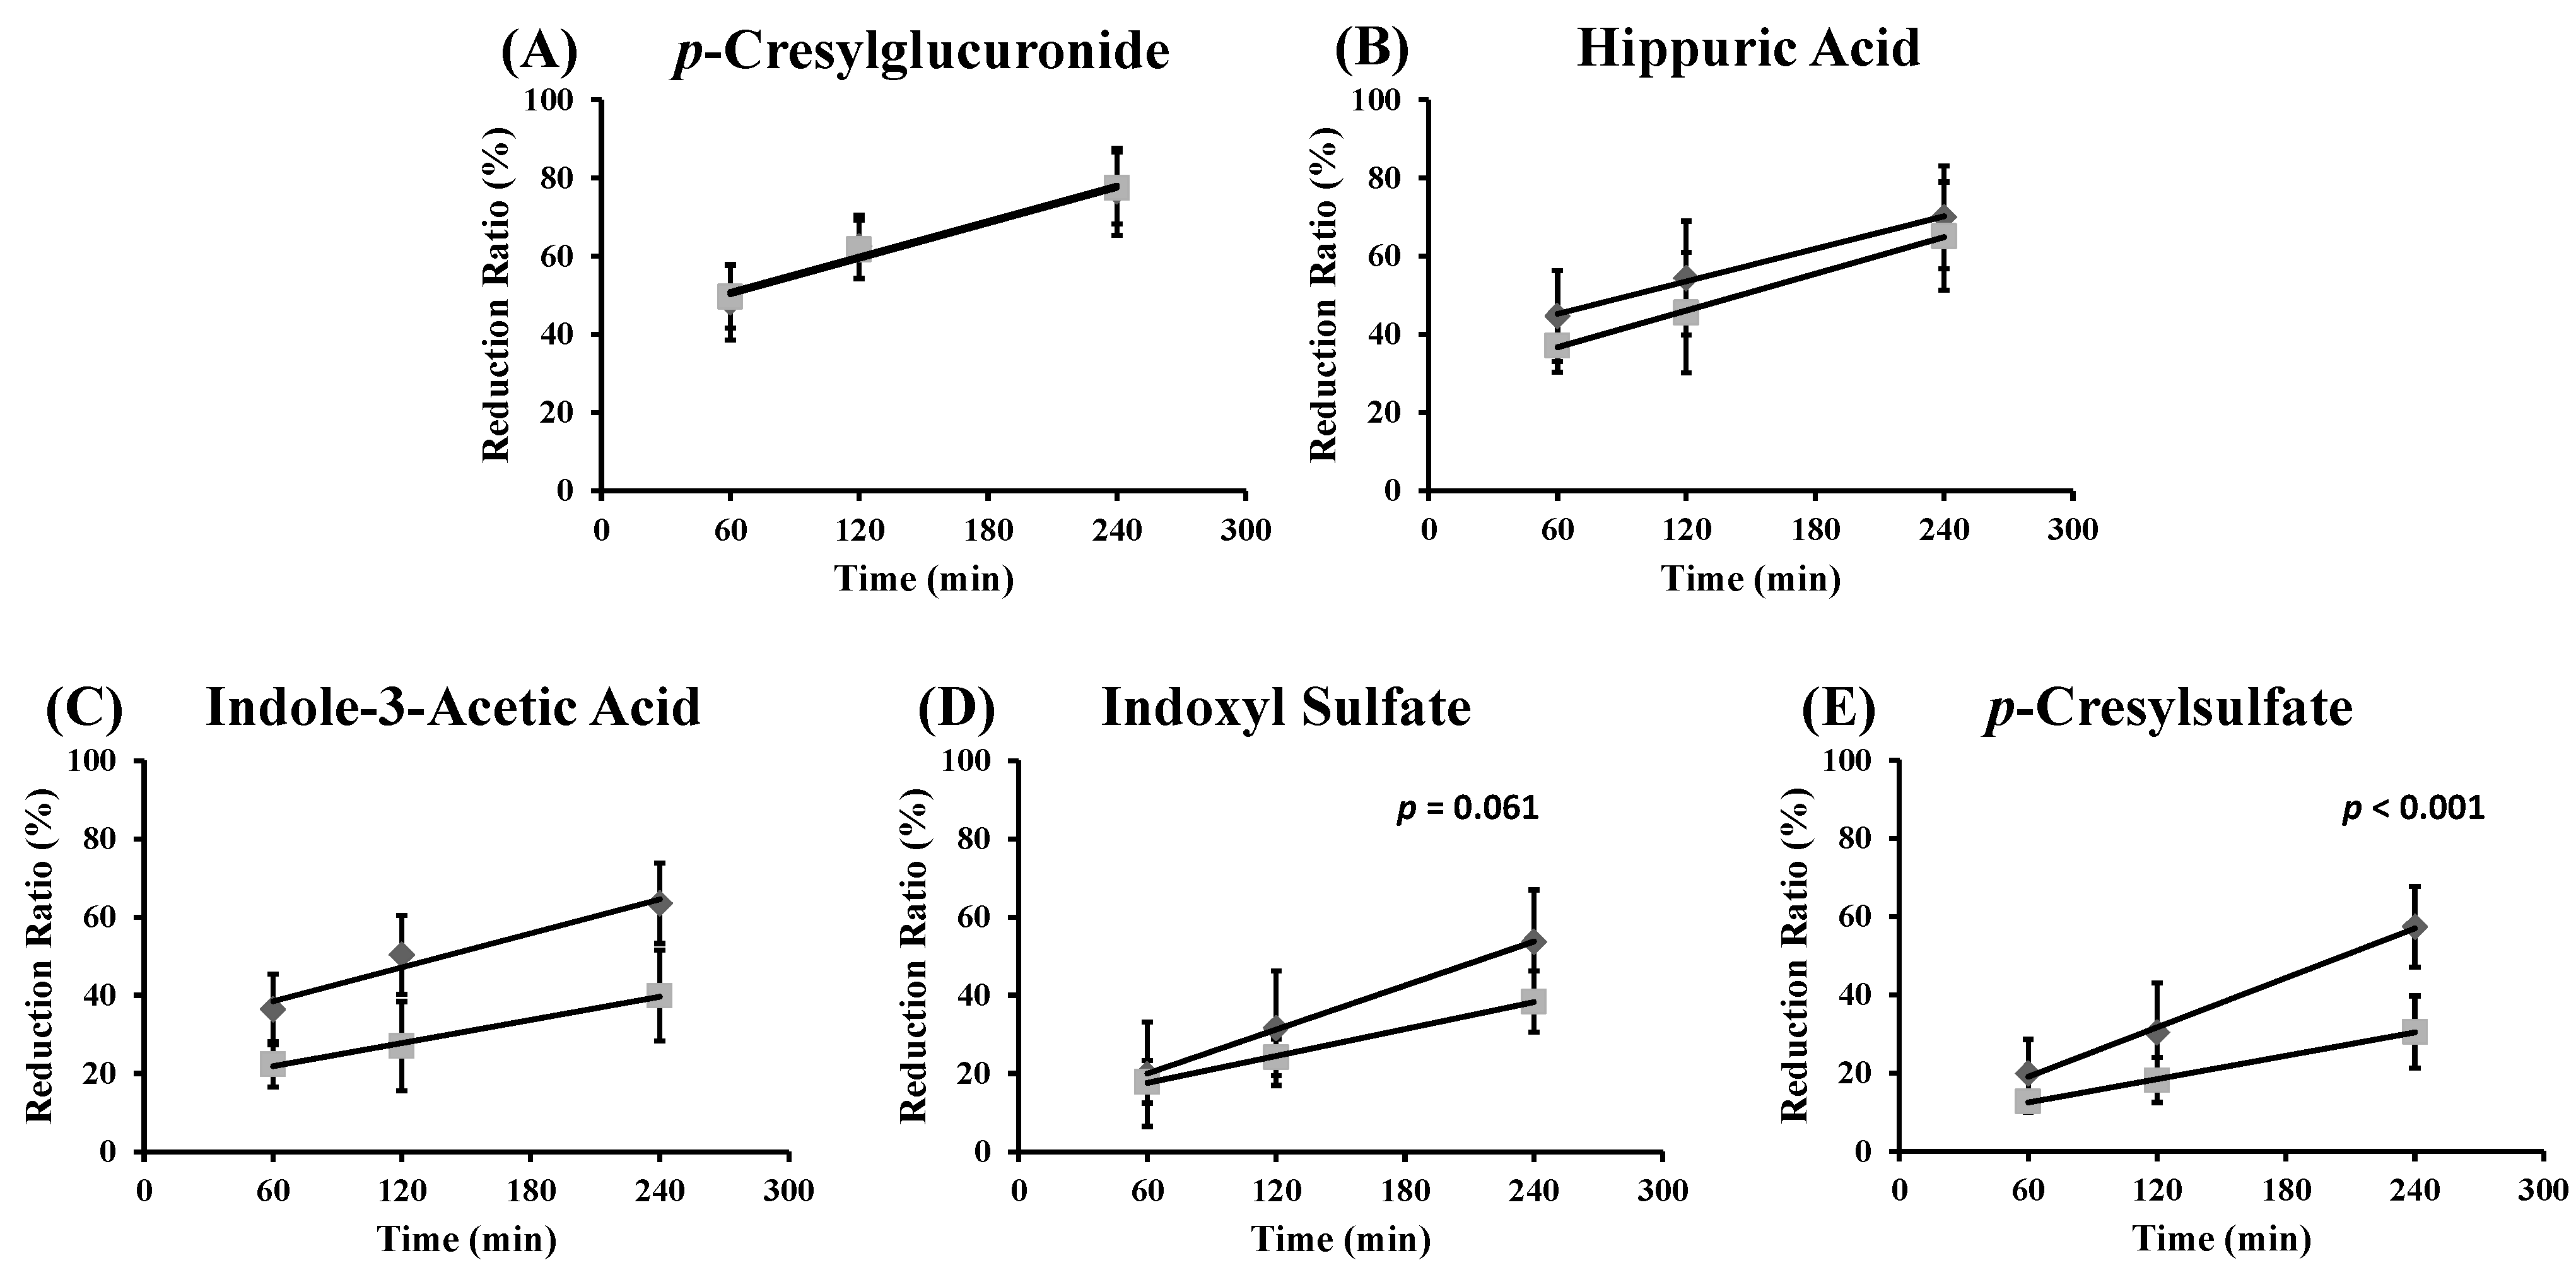
A possible explanation might be found in the hypothesis that the physicochemical bond of the toxin with its protein is strong. As a consequence, the equilibrium reaction is too slow to restore the free toxin concentration within the time frame of a single passage through the dialyzer and even within the time frame of a dialysis session once the pool of available pre-dialysis free fraction has been removed. Therefore, we calculated the reduction ratio (RR) for both total and free toxin concentration to check this hypothesis. The RR is graphically presented in
Figure 4 for
pCG, HA, IAA, IS and
pCS at 60, 120 and 240 min since the start of the dialysis session. The slopes of free and total RR are borderline significant for IS (
p = 0.061) and significantly different for
pCS (
p < 0.001).
The difference in RR between free and total concentrations might imply that the equilibrium could not be formed during the course of the dialysis session. For the weakly-bound
pCG, for example, around 90% of the total concentration is unbound and is thus easily removed by the dialyzer, resulting in a comparable total and free reduction ratio. The RR of the highly-bound
pCS, on the other hand, is different for free and total concentrations, and within the four hours of dialysis, the RR of the total concentration cannot follow the RR of the free concentration (around 4%). The equilibrium between free and bound
pCS is continuously disturbed because of the dynamic process of dialysis. Therefore, the equilibrium (as it was pre-dialysis) cannot be restored during the dialysis session and explains the observations in
Figure 2 and
Figure 3.
Figure 4.
Reduction ratio for total (
![Toxins 07 03933 i001]()
) and free (
![Toxins 07 03933 i002]()
) toxin concentration at different time points during an HD session for: (
A)
p-cresylglucuronide (free: y = 0.15x + 41;
R2 = 0.96; total: y = 0.15x + 42;
R2 = 0.99); (
B) hippuric acid (free: y = 0.14x + 37;
R2 = 1.00; total: y = 0.16x + 27;
R2 = 1.00); (
C) indole-3-acetic acid (free: y = 0.14x + 30;
R2 = 0.96; total: y = 0.10x + 16;
R2 = 0.99); (
D) indoxyl sulfate (free: y = 0.19x + 8.7;
R2 = 1.00; total: y = 0.11x + 11;
R2 = 1.00); and (
E)
p-cresylsulfate (free: y = 0.21x + 6.4;
R2 = 1.00; total: y = 0.10x + 6.5;
R2 = 1.00).
Both aspects,
i.e., (i) only the free fraction can be removed and (ii) the bound fraction is released slowly, are the main determinants for the limited removal of solutes during dialysis. This fits with the multi-pass device observations, as described by Eloot
et al., where removal of protein-bound solutes was limited to the first two hours of dialysis [
18]. In a kinetic modelling study from our group [
19] based on intradialytic concentrations, we found an inverse correlation between dialyzer clearance and the %PB. Furthermore, total distribution volumes and intercompartment clearances (except for
pCG), which are representative for solute retardation inside the patients, were also inversely correlated with the %PB. Thus, the present findings are in full agreement with those in the kinetic analysis.
It can be stated that during dialysis, first the free fraction will be removed and will cause a disequilibrium with the bound fraction, as well as with concentrations in the extra vascular spaces. This results in a continuous release of the bound fraction, respectively inflow from the extravascular space. These kinetics of protein-bound solutes were already extensively studied by our group showing the multi-compartmental behavior with vascular and extravascular spaces [
20].
Enhancing the filtration of proteins is cumbersome, as this would result in hypoproteinemia. However, it can be hoped that strategies could be developed that change the strength of the physical bond between the toxin and its ligand, to increase the free (dialyzable) solute concentration.
Recent research suggested a novel approach to increase the free fraction of the protein-bound solutes phenyl acetic acid (PAA), indoxyl sulfate and
p-cresylsulfate during dialysis by infusing a hypertonic solution at the dialyzer inlet [
10,
11,
12]. This increased the local ionic strength at the blood inlet of the dialyzer, resulting in an enhanced release of uremic toxin from its protein binding site, most pronounced for the middle bound PAA (%PB around 60%). With this approach, the clearance during
in vitro dialysis was relatively most beneficial for the highly-bound IS and
pCS [
10]. These
in vitro results might be promising, but the absence of hemolysis due to hyperosmolarity needs to be further investigated
in vivo.


 ,
, 


 ) and free (
  ) toxin concentration at different time points during an HD session for: (A) p-cresylglucuronide (free: y = 0.15x + 41; R2 = 0.96; total: y = 0.15x + 42; R2 = 0.99); (B) hippuric acid (free: y = 0.14x + 37; R2 = 1.00; total: y = 0.16x + 27; R2 = 1.00); (C) indole-3-acetic acid (free: y = 0.14x + 30; R2 = 0.96; total: y = 0.10x + 16; R2 = 0.99); (D) indoxyl sulfate (free: y = 0.19x + 8.7; R2 = 1.00; total: y = 0.11x + 11; R2 = 1.00); and (E) p-cresylsulfate (free: y = 0.21x + 6.4; R2 = 1.00; total: y = 0.10x + 6.5; R2 = 1.00).
