A Rapid Magnetic Solid Phase Extraction Method Followed by Liquid Chromatography-Tandem Mass Spectrometry Analysis for the Determination of Mycotoxins in Cereals

 ,
, 

Abstract
:
1. Introduction
2. Results and Discussion
2.1. The Magnetic GCB Adsorbent Material
2.2. Samples
2.3. Sample Preparation
2.4. Liquid Chromatography-Tandem Mass Spectrometry Analysis
2.5. Reuse of MGCB
2.6. Method Performance
2.7. Sample Analysis
3. Conclusions
4. Materials and Methods
4.1. Chemicals and Reagents
Safety Considerations
4.2. Magnetic Graphitized Carbon Black Preparation
4.3. Characterization of Graphitized Carbon Black Material
4.4. Samples and Extraction Protocol
4.5. Liquid Chromatography-Tandem Mass Spectrometry Conditions
4.6. Analytical Method Performance
4.6.1. Process Efficiency (Recovery and Matrix Effect)
4.6.2. Calibration Graphs
4.6.3. Trueness and Precision
4.6.4. Method Limits of Detection and Quantification
Supplementary Materials
Acknowledgments
Author Contributions
Conflicts of Interest
References
- Capriotti, A.L.; Caruso, G.; Cavaliere, C.; Foglia, P.; Samperi, R.; Lagana, A. Multiclass mycotoxin analysis in food, environmental and biological matrices with chromatography/mass spectrometry. Mass Spectrom. Rev. 2012, 31, 466–503. [Google Scholar] [CrossRef] [PubMed]
- Zöllner, P.; Mayer-Helm, B. Trace mycotoxin analysis in complex biological and food matrices by liquid chromatography–atmospheric pressure ionisation mass spectrometry. J. Chromatogr. A 2006, 1136, 123–169. [Google Scholar] [CrossRef] [PubMed]
- Turner, N.W.; Bramhmbhatt, H.; Szabo-Vezse, M.; Poma, A.; Coker, R.; Piletsky, S.A. Analytical methods for determination of mycotoxins: An update (2009–2014). Anal. Chim. Acta 2015, 901, 12–33. [Google Scholar] [CrossRef] [PubMed]
- Cavaliere, C.; Foglia, P.; Samperi, R.; Laganà, A. Determination of Aflatoxins and Ochratoxin A in Olive Oil. In Olives and Olive Oil in Health and Disease Prevention; Elsevier: Amsterdam, The Netherlands, 2010; pp. 645–652. [Google Scholar]
- International Agency for Research on Cancer; Working Group on the Evaluation of Carcinogenic Risks to Humans. Some traditional herbal medicines, some mycotoxins, naphthalene and styrene. In IARC Monographs on the Evaluation of Carcinogenic Risks to Humans; IARC: Lyon, France, 2002. [Google Scholar]
- Marin, S.; Ramos, A.J.; Cano-Sancho, G.; Sanchis, V. Mycotoxins: Occurrence, toxicology, and exposure assessment. Food Chem. Toxicol. 2013, 60, 218–237. [Google Scholar] [CrossRef] [PubMed]
- Anfossi, L.; Giovannoli, C.; Baggiani, C. Mycotoxin detection. Curr. Opin. Biotechnol. 2016, 37, 120–126. [Google Scholar] [CrossRef] [PubMed]
- Belen Serrano, A.; Capriotti, A.L.; Cavaliere, C.; Piovesana, S.; Samperi, R.; Ventura, S.; Lagana, A. Development of a Rapid LC-MS/MS Method for the Determination of Emerging Fusarium mycotoxins Enniatins and Beauvericin in Human Biological Fluids. Toxins 2015, 7, 3554–3571. [Google Scholar] [CrossRef] [PubMed]
- Edite Bezerra da Rocha, M.; da Chagas Oliveira Freire, F.; Erlan Feitosa Maia, F.; Izabel Florindo Guedes, M.; Rondina, D. Mycotoxins and their effects on human and animal health. Food Control 2014, 36, 159–165. [Google Scholar] [CrossRef]
- International Agency for Research on Cancer; Working Group on the Evaluation of Carcinogenic Risks to Humans. IARC monographs on the evaluation of carcinogenic risks to humans. In Chemical Agents and Related Occupations; Weltgesundheitsorganisation, Ed.; IARC: Lyon, France, 2012; Volume 100 F. [Google Scholar]
- Bui-Klimke, T.R.; Wu, F. Ochratoxin A and Human Health Risk: A Review of the Evidence. Crit. Rev. Food Sci. Nutr. 2015, 55, 1860–1869. [Google Scholar] [CrossRef] [PubMed]
- Pinotti, L.; Ottoboni, M.; Giromini, C.; Dell’Orto, V.; Cheli, F. Mycotoxin Contamination in the EU Feed Supply Chain: A Focus on Cereal Byproducts. Toxins 2016, 8. [Google Scholar] [CrossRef] [PubMed]
- European Commission. The Rapid Alert System for Food and Feed (RASFF)—2015 Annual Report. Health and Food Safety—2016. Available online: https://ec.europa.eu/food/safety/rasff_en (accessed on 9 January 2017).
- European Commission. Commission Regulation (EC) No. 1881/2006 of 19 December 2006 setting maximum levels for certain contaminants in foodstuffs (Text with EEA relevance). Off. J. Eur. Union 2006, 364, 5–24. [Google Scholar]
- Ríos, A.; Zougagh, M.; Bouri, M. Magnetic (nano)materials as an useful tool for sample preparation in analytical methods. A review. Anal. Methods 2013, 5, 4558–4573. [Google Scholar] [CrossRef]
- Wierucka, M.; Biziuk, M. Application of magnetic nanoparticles for magnetic solid-phase extraction in preparing biological, environmental and food samples. TrAC Trends Anal. Chem. 2014, 59, 50–58. [Google Scholar] [CrossRef]
- Mashhadizadeh, M.H.; Amoli-Diva, M.; Pourghazi, K. Magnetic nanoparticles solid phase extraction for determination of ochratoxin A in cereals using high-performance liquid chromatography with fluorescence detection. J. Chromatogr. A 2013, 1320, 17–26. [Google Scholar] [CrossRef] [PubMed]
- Hashemi, M.; Taherimaslak, Z.; Rashidi, S. Application of magnetic solid phase extraction for separation and determination of aflatoxins B1 and B2 in cereal products by high performance liquid chromatography-fluorescence detection. J. Chromatogr. B 2014, 960, 200–208. [Google Scholar] [CrossRef] [PubMed]
- Capriotti, A.L.; Cavaliere, C.; Foglia, P.; La Barbera, G.; Samperi, R.; Ventura, S.; Laganà, A. Mycoestrogen determination in cow milk: Magnetic solid-phase extraction followed by liquid chromatography and tandem mass spectrometry analysis: Sample Preparation. J. Sep. Sci. 2016, 39, 4794–4804. [Google Scholar] [CrossRef] [PubMed]
- Cavaliere, C.; Foglia, P.; Pastorini, E.; Samperi, R.; Lagana, A. Development of a multiresidue method for analysis of major Fusarium mycotoxins in corn meal using liquid chromatography/tandem mass spectrometry. Rapid Commun. Mass Spectrom. 2005, 19, 2085–2093. [Google Scholar] [CrossRef] [PubMed]
- Cavaliere, C.; Foglia, P.; Guarino, C.; Nazzari, M.; Samperi, R.; Laganà, A. A sensitive confirmatory method for aflatoxins in maize based on liquid chromatography/electrospray ionization tandem mass spectrometry. Rapid Commun. Mass Spectrom. RCM 2007, 21, 550–556. [Google Scholar] [CrossRef] [PubMed]
- Amoli-Diva, M.; Pourghazi, K.; Hajjaran, S. Dispersive micro-solid phase extraction using magnetic nanoparticle modified multi-walled carbon nanotubes coupled with surfactant-enhanced spectrofluorimetry for sensitive determination of lomefloxacin and ofloxacin from biological samples. Mater. Sci. Eng. C 2016, 60, 30–36. [Google Scholar] [CrossRef] [PubMed]
- Chen, X.H.; Pan, S.D.; Ye, M.J.; Li, X.P.; Zhao, Y.G.; Jin, M.C. Magnetic solid-phase extraction based on a triethylenetetramine-functionalized magnetic graphene oxide composite for the detection of ten trace phenolic environmental estrogens in environmental water: Sample Preparation. J. Sep. Sci. 2016, 39, 762–768. [Google Scholar] [CrossRef] [PubMed]
- Jouany, J.P. Methods for preventing, decontaminating and minimizing the toxicity of mycotoxins in feeds. Anim. Feed Sci. Technol. 2007, 137, 342–362. [Google Scholar] [CrossRef]
- Cavaliere, C.; D’Ascenzo, G.; Foglia, P.; Pastorini, E.; Samperi, R.; Lagana, A. Determination of type B trichothecenes and macrocyclic lactone mycotoxins in field contaminated maize. Food Chem. 2005, 92, 559–568. [Google Scholar] [CrossRef]
- Capriotti, A.L.; Cavaliere, C.; Foglia, P.; Samperi, R.; Stampachiacchiere, S.; Ventura, S.; Lagana, A. Multiclass analysis of mycotoxins in biscuits by high performance liquid chromatography-tandem mass spectrometry. Comparison of different extraction procedures. J. Chromatogr. A 2014, 1343, 69–78. [Google Scholar] [CrossRef] [PubMed]
- Faberi, A.; Foglia, P.; Pastorini, E.; Samperi, R.; Laganà, A. Determination of type B fumonisin mycotoxins in maize and maize-based products by liquid chromatography/tandem mass spectrometry using a QqQ linear ion trap mass spectrometer: LC/MS/MS of type B fumonisin mycotoxins in maize-based products. Rapid Commun. Mass Spectrom. 2005, 19, 275–282. [Google Scholar] [CrossRef] [PubMed]
- European Commission. Commission Decision 657/2002/EC of 12 August 2002 implementing Council Directive 96/23/EC concerning the performance of analytical methods and the interpretation of results. Off. J. Eur. Union 2002, 221, 8–36. [Google Scholar]
- Capriotti, A.L.; Cavaliere, C.; La Barbera, G.; Piovesana, S.; Samperi, R.; Zenezini Chiozzi, R.; Laganà, A. Polydopamine-coated magnetic nanoparticles for isolation and enrichment of estrogenic compounds from surface water samples followed by liquid chromatography-tandem mass spectrometry determination. Anal. Bioanal. Chem. 2016, 408, 4011–4020. [Google Scholar] [CrossRef] [PubMed]
- Moreno, V.; Zougagh, M.; Ríos, Á. Hybrid nanoparticles based on magnetic multiwalled carbon nanotube-nanoC18SiO2 composites for solid phase extraction of mycotoxins prior to their determination by LC-MS. Microchim. Acta 2016, 183, 871–880. [Google Scholar] [CrossRef]
- Manafi, M.H.; Allahyari, M.; Pourghazi, K.; Amoli-Diva, M.; Taherimaslak, Z. Surfactant-enhanced spectrofluorimetric determination of total aflatoxins from wheat samples after magnetic solid-phase extraction using modified Fe3O4 nanoparticles. Spectrochim. Acta A Mol. Biomol. Spectrosc. 2015, 146, 43–49. [Google Scholar] [CrossRef] [PubMed]
- Yan, Y.; Zheng, Z.; Deng, C.; Zhang, X.; Yang, P. Selective enrichment of phosphopeptides by titania nanoparticles coated magnetic carbon nanotubes. Talanta 2014, 118, 14–20. [Google Scholar] [CrossRef] [PubMed]
- Capriotti, A.L.; Cavaliere, C.; Piovesana, S.; Stampachiacchiere, S.; Samperi, R.; Ventura, S.; Laganà, A. Simultaneous Determination of Naturally Occurring Estrogens and Mycoestrogens in Milk by Ultrahigh-Performance Liquid Chromatography-Tandem Mass Spectrometry Analysis. J. Agric. Food Chem. 2015, 63, 8940–8946. [Google Scholar] [CrossRef] [PubMed]


| Analyte | ACN/H2O 50:50 | ACN/H2O 80:20 | MeOH/H2O 80:20 | |||
|---|---|---|---|---|---|---|
| RE | ME | RE | ME | RE | ME | |
| AFG2 | 44 | 78 | 55 | 68 | 61 | 72 |
| AFG1 | 53 | 74 | 50 | 73 | 61 | 70 |
| AFB2 | 49 | 77 | 62 | 66 | 53 | 76 |
| AFB1 | 45 | 73 | 67 | 56 | 64 | 65 |
| OTA | 61 | 63 | 64 | 68 | 56 | 66 |
| ZEN | 83 | 86 | 78 | 82 | 81 | 89 |
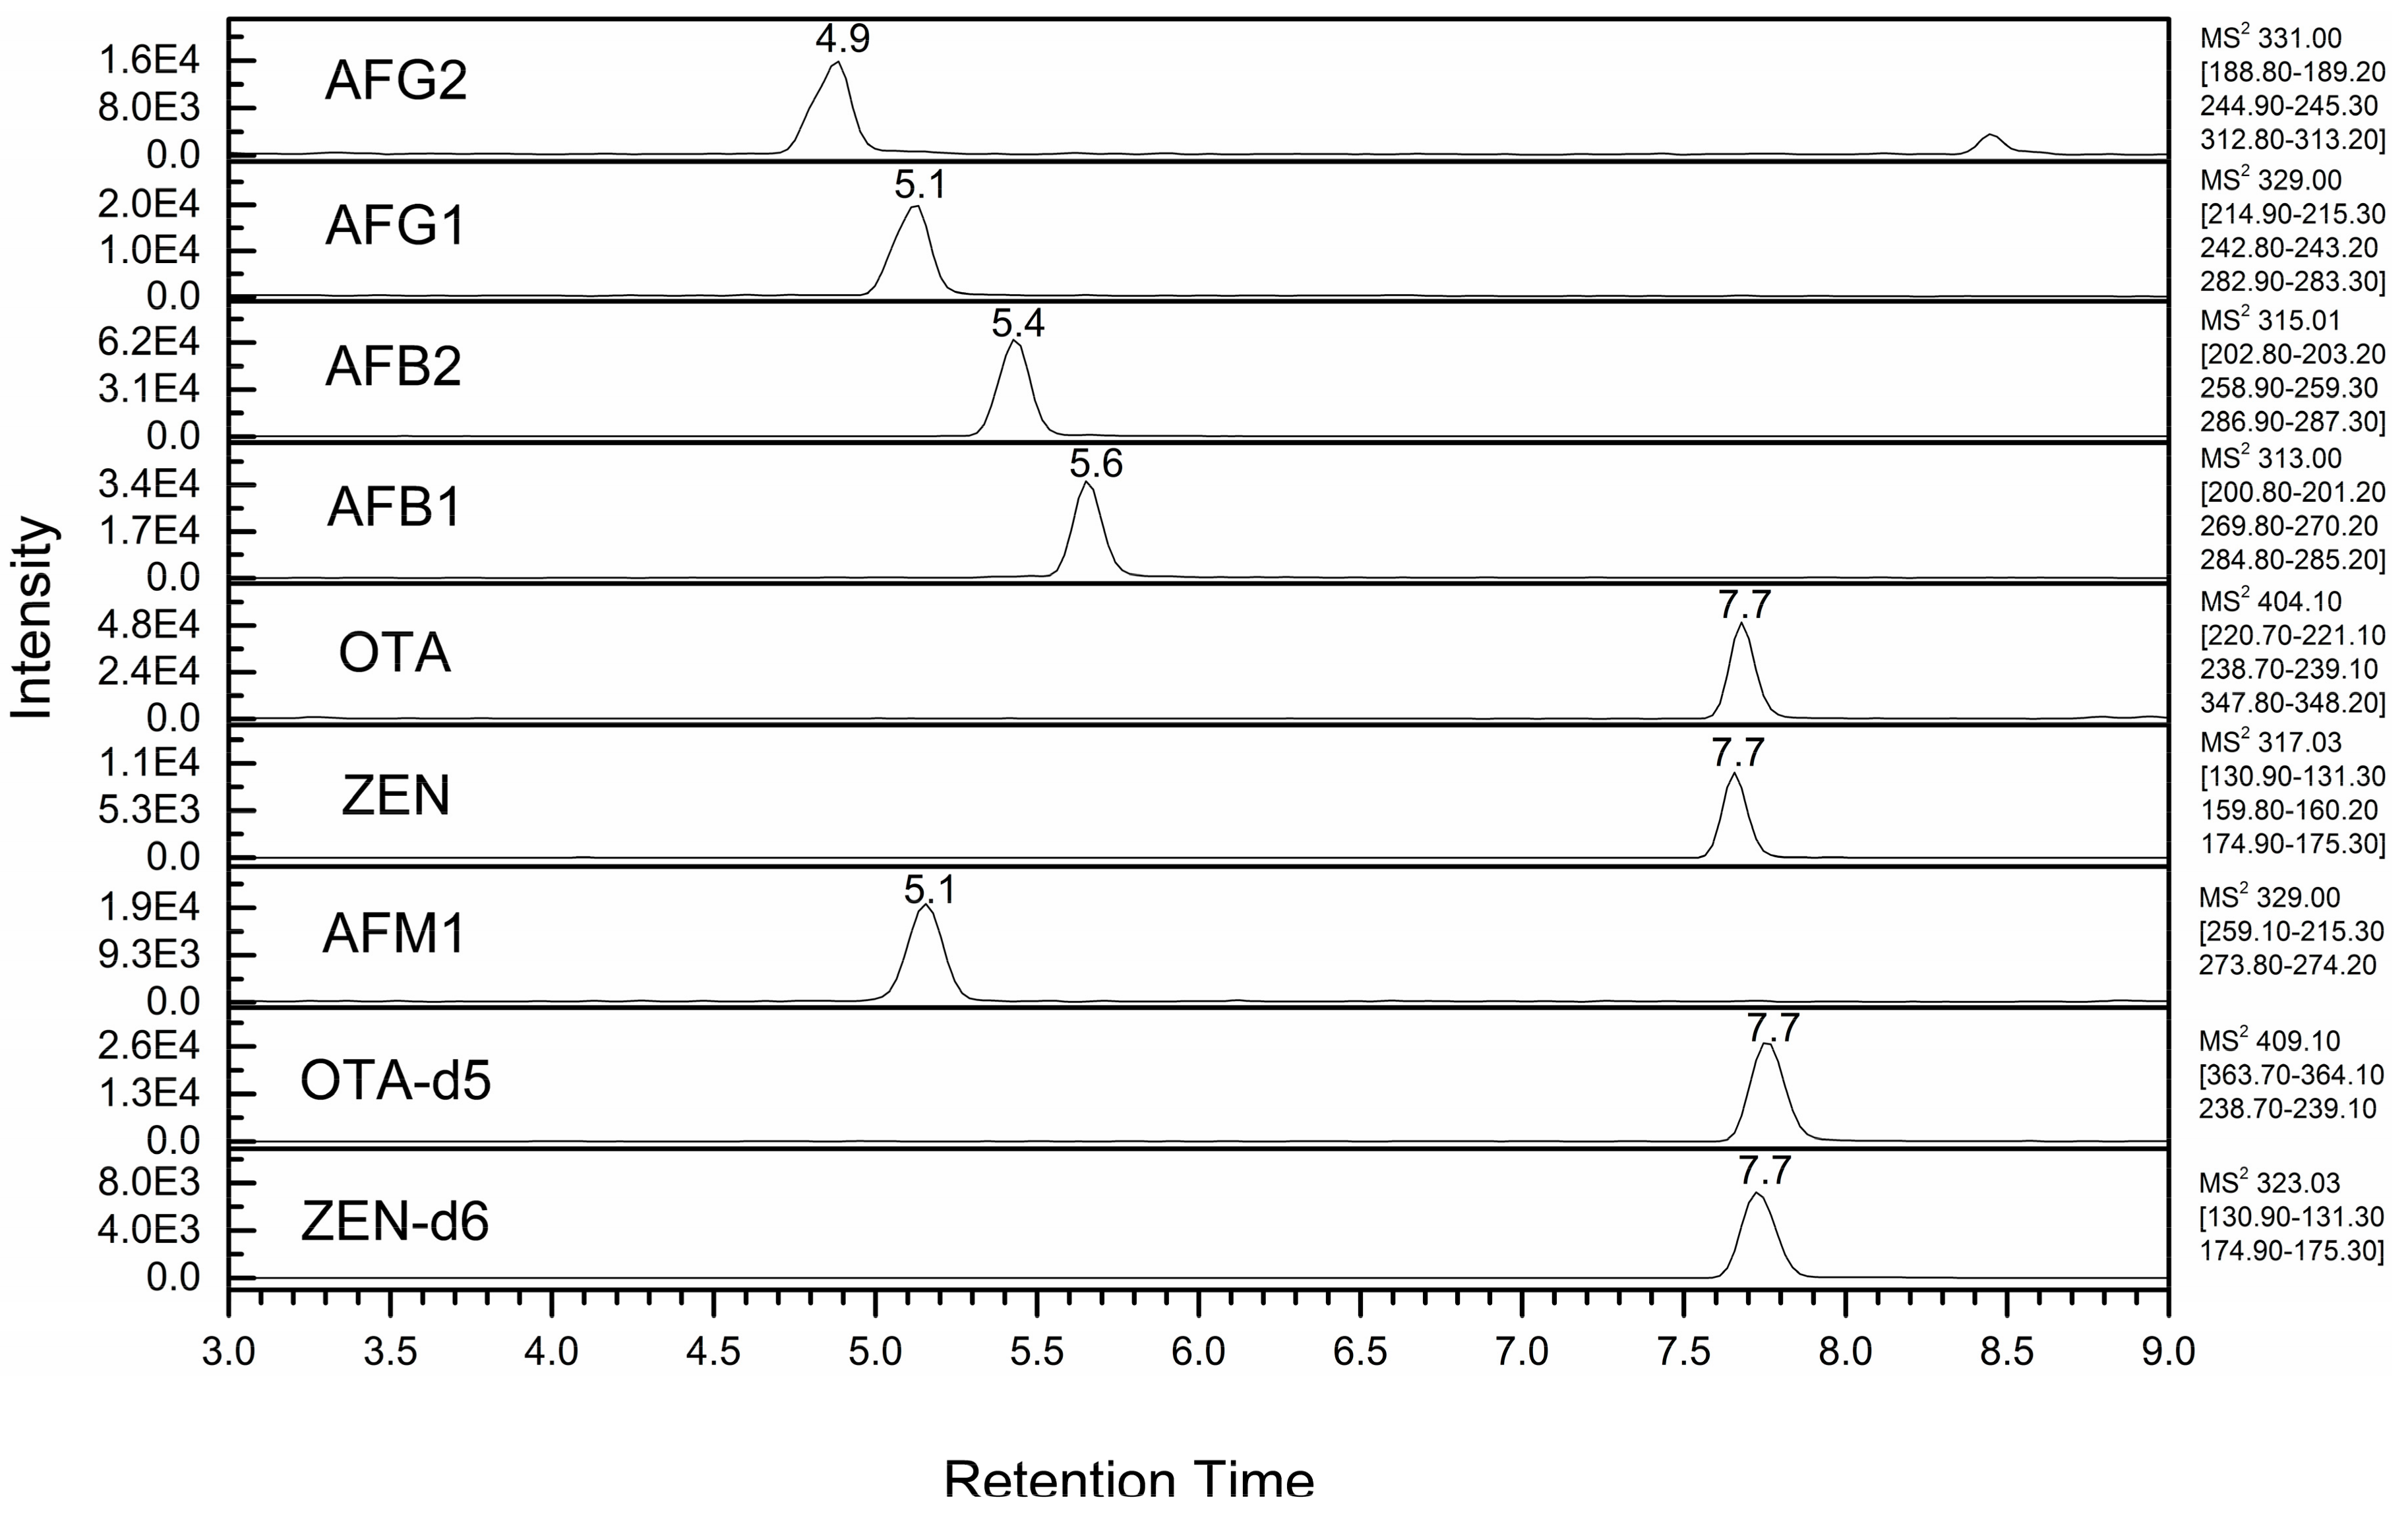
| Mycotoxin | Retention Time (Min) | Precursor Ion (m/z) | Product Ion 1 (m/z) (CE 2, eV) | S-Lens (V) |
|---|---|---|---|---|
| Positive polarity | [M + H]+ | |||
| AFG2 | 4.9 | 331 | 189 (42), 245 (31), 313 (25) | 145 |
| AFM1 (IS) | 5.1 | 329 | 259 (34), 273 (25) | 145 |
| AFG1 | 5.4 | 329 | 215 (33), 243 (27), 283 (24) | 145 |
| AFB2 | 5.6 | 315 | 203 (36), 259 (33), 287 (24) | 155 |
| AFB1 | 4.6 | 313 | 201 (30), 270 (26), 285 (23) | 150 |
| OTA-d5 (IS) | 7.7 | 409 | 363 (25), 239 (27) | |
| OTA | 7.7 | 404 | 221 (36), 239 (26), 348 (13) | 110 |
| Negative polarity | [M − H]− | |||
| ZEN-d6 (IS) | 7.7 | 323 | 131 (33), 175 (25) | 140 |
| ZEN | 7.7 | 317 | 131 (33), 160 (34), 175 (25) | 150 |
| Analyte | 0.5 × ML | ML | 2 × ML | |||||||||
|---|---|---|---|---|---|---|---|---|---|---|---|---|
| Corn | Durum Wheat | Corn | Durum Wheat | Corn | Durum Wheat | |||||||
| RE | ME | RE | ME | RE | ME | RE | ME | RE | ME | RE | ME | |
| AFG2 | 78 | 76 | 74 | 86 | 67 | 79 | 69 | 79 | 71 | 84 | 67 | 88 |
| AFG1 | 71 | 75 | 74 | 79 | 66 | 73 | 74 | 75 | 68 | 78 | 73 | 84 |
| AFB2 | 69 | 76 | 68 | 78 | 63 | 85 | 76 | 86 | 74 | 89 | 71 | 76 |
| AFB1 | 73 | 68 | 71 | 70 | 74 | 69 | 73 | 68 | 72 | 69 | 69 | 73 |
| OTA | 67 | 72 | 73 | 67 | 83 | 68 | 76 | 71 | 79 | 69 | 81 | 68 |
| ZEN | 78 | 87 | 79 | 102 | 89 | 94 | 82 | 116 | 84 | 104 | 88 | 108 |
| Analyte | Trueness | Precision (0.5 × ML) | ||||||||
|---|---|---|---|---|---|---|---|---|---|---|
| 0.5 × ML | ML | 2 × ML | Intra-Day | Inter-Day | ||||||
| Corn | Wheat | Corn | Wheat | Corn | Wheat | Corn | Wheat | Corn | Wheat | |
| AFG2 | 94 | 98 | 95 | 96 | 92 | 91 | 9 | 10 | 17 | 14 |
| AFG1 | 93 | 99 | 97 | 95 | 98 | 96 | 8 | 12 | 7 | 9 |
| AFB2 | 89 | 91 | 94 | 89 | 103 | 99 | 6 | 3 | 10 | 8 |
| AFB1 | 90 | 93 | 94 | 90 | 106 | 101 | 10 | 7 | 8 | 10 |
| OTA | 99 | 97 | 98 | 100 | 96 | 97 | 7 | 4 | 11 | 9 |
| ZEN | 103 | 99 | 101 | 98 | 104 | 106 | 11 | 3 | 16 | 20 |
| Analyte | MLODs (µg kg−1) | MLOQs (µg kg−1) | ||||||
|---|---|---|---|---|---|---|---|---|
| Corn | Durum Wheat | Corn | Durum Wheat | |||||
| Est. | Conf. | Est. | Conf. | Est. | Conf. | Est. | Conf. | |
| AFG2 | 0.11 | 0.05 | 0.12 | 0. 05 | 0.38 | 0.20 | 0.43 | 0.15 |
| AFG1 | 0.08 | 0.10 | 0.13 | 0.05 | 0.27 | 0.20 | 0.23 | 0.15 |
| AFB2 | 0.09 | 0.05 | 0.14 | 0.05 | 0.29 | 0.10 | 0.43 | 0.10 |
| AFB1 | 0.11 | 0.10 | 0.23 | 0.10 | 0.36 | 0.10 | 0.23 | 0.10 |
| OTA | 0.48 | 0.10 | 0.25 | 0.20 | 1.60 | 0.30 | 0.79 | 0.30 |
| ZEN | 10.2 | 1.0 | 4.2 | 2.2 | 33.8 | 1.0 | 34.6 | 2.2 |
© 2017 by the authors. Licensee MDPI, Basel, Switzerland. This article is an open access article distributed under the terms and conditions of the Creative Commons Attribution (CC BY) license (http://creativecommons.org/licenses/by/4.0/).
Share and Cite
Barbera, G.L.; Capriotti, A.L.; Cavaliere, C.; Foglia, P.; Montone, C.M.; Chiozzi, R.Z.; Laganà, A. A Rapid Magnetic Solid Phase Extraction Method Followed by Liquid Chromatography-Tandem Mass Spectrometry Analysis for the Determination of Mycotoxins in Cereals. Toxins 2017, 9, 147. https://0-doi-org.brum.beds.ac.uk/10.3390/toxins9040147
Barbera GL, Capriotti AL, Cavaliere C, Foglia P, Montone CM, Chiozzi RZ, Laganà A. A Rapid Magnetic Solid Phase Extraction Method Followed by Liquid Chromatography-Tandem Mass Spectrometry Analysis for the Determination of Mycotoxins in Cereals. Toxins. 2017; 9(4):147. https://0-doi-org.brum.beds.ac.uk/10.3390/toxins9040147
Chicago/Turabian StyleBarbera, Giorgia La, Anna Laura Capriotti, Chiara Cavaliere, Patrizia Foglia, Carmela Maria Montone, Riccardo Zenezini Chiozzi, and Aldo Laganà. 2017. "A Rapid Magnetic Solid Phase Extraction Method Followed by Liquid Chromatography-Tandem Mass Spectrometry Analysis for the Determination of Mycotoxins in Cereals" Toxins 9, no. 4: 147. https://0-doi-org.brum.beds.ac.uk/10.3390/toxins9040147