Article

Drought Characterization and Trend Detection Using the Reconnaissance Drought Index for Setsoto Municipality of the Free State Province of South Africa and the Impact on Maize Yield

by
Hadisu B. Abubakar
1,*,
Solomon W. Newete
1,2 and
Mary C. Scholes
1
1
School of Animal, Plant and Environmental Sciences, University of Witwatersrand, Johannesburg 2050, South Africa
2
Agricultural Research Council-Institute for Soil, Climate and Water (ARC-ISCW) 600, Belvedere Street, Arcadia, Private bag X79, Pretoria 0001, South Africa
*
Author to whom correspondence should be addressed.
Submission received: 4 September 2020 / Revised: 10 October 2020 / Accepted: 13 October 2020 / Published: 26 October 2020
(This article belongs to the Section Water, Agriculture and Aquaculture)

Abstract

:
The reconnaissance drought index (RDI) for the Setsoto municipality of the Free State province in South Africa was calculated for the period between 1985 and 2019 at 3 month (October–December), 6 month (October–March), and 12 month (October–September) intervals. Rainfall and minimum and maximum temperature data from four weather stations (Clocolan, Ficksburg, Marquard, and Senekal) were used for this study to characterize drought using “DrinC” software together with the Mann Kendall test with Sen’s slope to detect drought trends and the rate of change. Extreme, severe, and moderate droughts were recorded for all the stations, with RDIs ranging from −3.6 to −1.0 at different temporal scales. The years 1991, 1994, 2006, 2011, and 2015 were highlighted using the RDI 3, 6, and 12 month calculations. Results showed that the yield decreased either in the year of the drought or in the subsequent year, due to the exact timing of the low-rainfall events in the season and soil moisture storage. Yields were low, on average 2.5 tons ha−1 year−1, with high variability. Optimal growing conditions are essential in the early part of the season, October–December, for maximizing yield; if droughts are experienced at this time then the yield is more greatly impacted than if the droughts occur later in the season. Spatial analysis shows a large variability of drought patterns across the Municipality, over the years, with the 3 month RDI values giving a more detailed picture of this variability than the 6 and 12 month RDI values.

1. Introduction

The primary driver of drought is the lack of rainfall, and most indicators used for detecting and monitoring drought are based on rainfall characteristics often over a long period of time, making it difficult to accurately detect drought development [1,2,3]. Meteorological drought is defined in terms of the magnitude of the precipitation shortfall and its duration [4], whereas agricultural drought links the various characteristics of meteorological drought to agricultural impacts [5,6,7]. Water requirements for crops vary based on crop type, period of crop growth, and micro environmental factors [8]. Soil moisture conditions at different time scales reflect the availability of water levels [9]. The impacts of drought are far reaching, including food security, health, migration, water resource management, and conflicts [10]. In countries dependent on rainfed agriculture, drought risk studies are important agro-climatological tools for assessing the possible risks to agricultural production [11]. Agriculture in many countries of sub-Saharan Africa is conducted by smallholder farmers, is rainfed and mostly depends on the soils inherent fertility because fertilizers are very costly [11,12]. Areas with high rainfall variability, both intra- and interseasonal, are more prone to agricultural drought impacting the onset, cessation, and duration of the rainfall, which often leads to crop failure [13]. The phenology of the maize crop is influenced by seasonal and interannual variations in climate, as well as habitat factors and management practices. Maize is very sensitive to water availability during the stages of germination, silking, pollen shedding, and grain filling [14]. Maize germination is negatively impacted if there is insufficient moisture within two weeks after planting. The quality and quantity of the grain is impacted by a shortage of water at the later growth stages. Hydrological studies using numerous different indices have been developed to detect, monitor, and quantify drought in South Africa. These studies are used in policy decision-making and for assessing risk. Data which are frequently used include streamflow, temperature, rainfall, and evapotranspiration. There are about 15 commonly used indices, some of which are the crop moisture index, the vegetation condition index (VCI), the temperature condition index (TCI), deciles index, and the standardized water-level index (SWI). These indices calculate slightly different interpretations of drought and make use of different data [15,16,17,18]. The standard precipitation index (SPI) has been used extensively in drought studies in the region [19,20,21]. The standard precipitation index (SPI) and reconnaissance drought index (RDI) are recommended by the World Meteorological Organization (WMO) as indices for the characterization of drought [22]. The standard precipitation index is based on precipitation data alone and can be calculated to describe drought at multiple time scales [9,23,24,25,26]. The reconnaissance drought index was developed to accommodate water deficiency and uses both precipitation and temperature data for drought characterization and was the index selected for this study [27,28,29]. RDI is best used for studies at a small spatial scale, whilst the SPI is used for varying time scales [30,31] Most drought studies focus on regional and national scales with fewer studies at the local scale, however it is at the local scale where the predictions are most needed. In this study, we matched the spatial scale of the crop production, the crop distribution, and crop phenology with the time scale of the drought indices. The 3 month RDI (RDI-3) and 6 month RDI (RDI-6) indices would capture the phenological stages at which the crop is most vulnerable. We focused the study on the growing season of maize in the summer regions of South Africa. Maize (Zea mays L.) is planted in October, hopefully after the spring rains, and harvested in late March depending on whether there have been late rains. The timing of the drought events would have the greatest negative impact on the crop at germination, silking, pollination, and grain filling. Maize is a staple crop in South Africa and it is grown in the central, western, and northern parts of the country. The Free State province is in the central region and it accounts for 34% of South Africa’s maize production, and the municipality chosen for this study produces 11% of this production. The area has high rainfall variability, and some studies have shown that the farming enterprise may be at risk [32]. Droughts and extreme events are becoming more frequent and the drought characteristics are not well understood, at this particular local scale. The aim of this study was to characterize the drought and the trends relative to the production season for maize, which is from October to March, in the Setsoto municipality of the Free State province of South Africa. The drought characterization was done using the RDI, which is a robust method using both rainfall and temperature data, for annual (12 months), mid-term (6 months), and short-term (3 months) meteorological droughts.

2. Materials and Methods
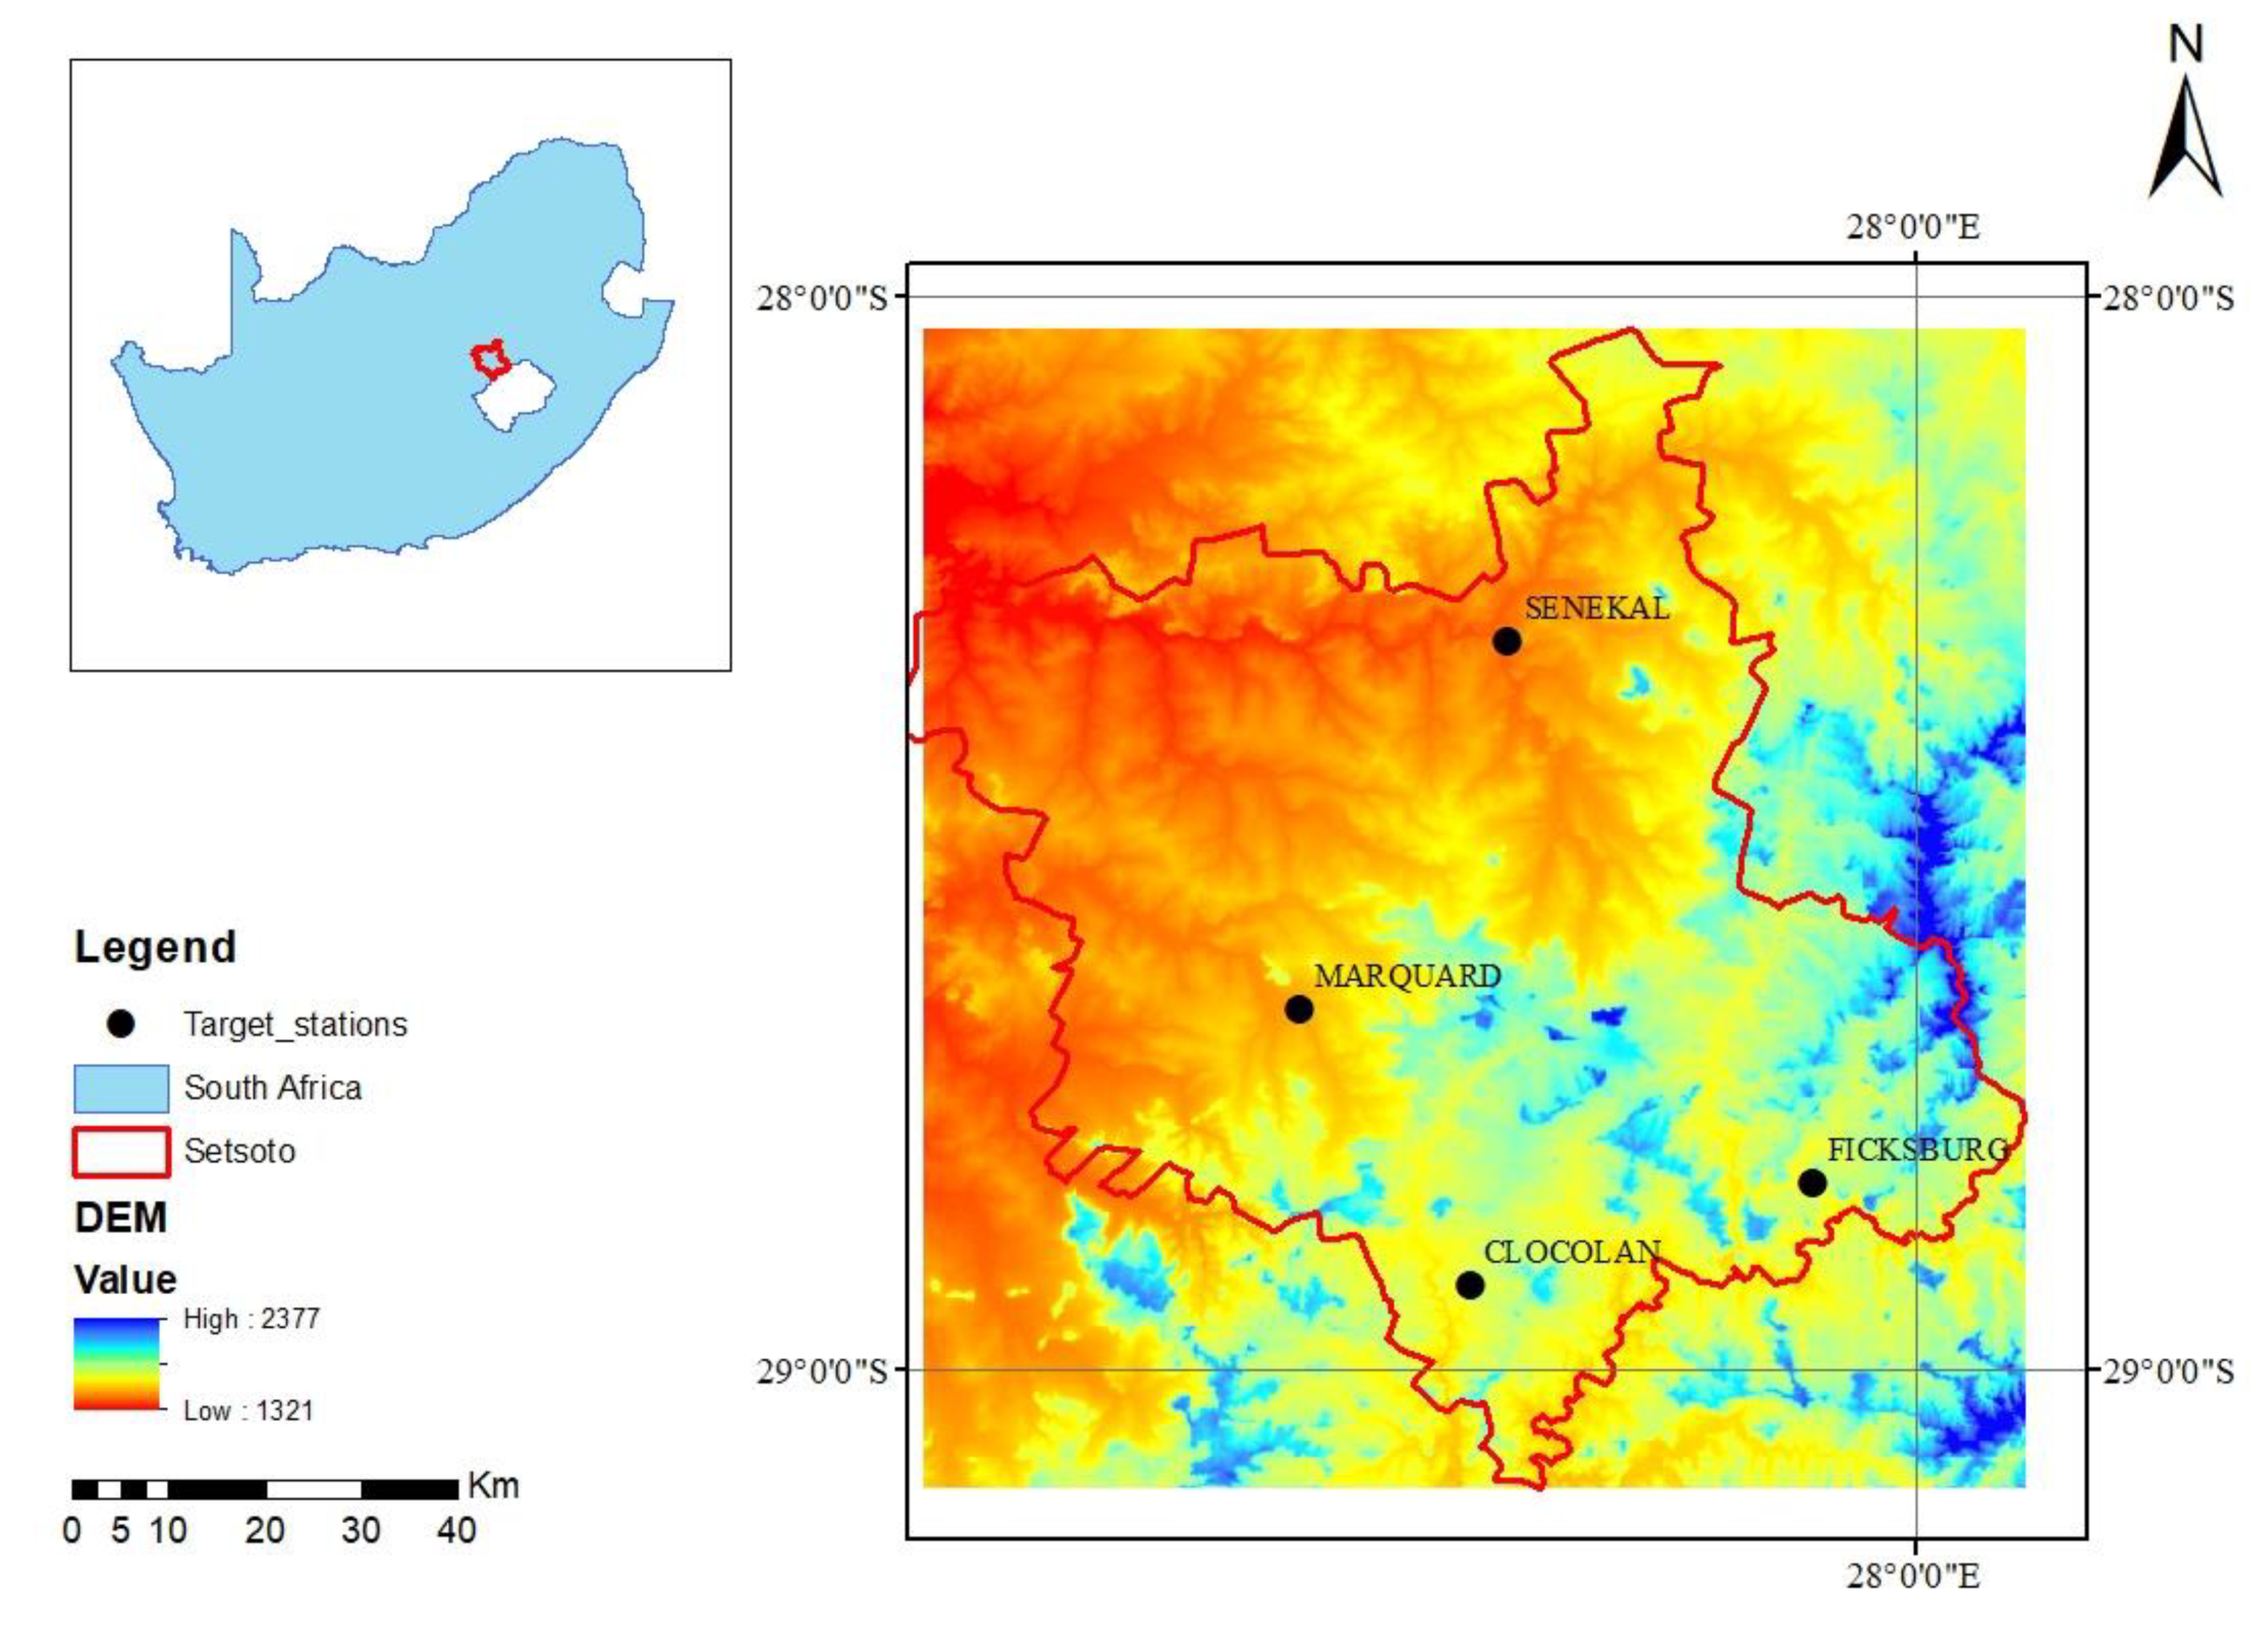
2.1. Study Area

This study was conducted in the Setsoto municipality of the Thabo Mofutsanyana district in the Free State province using the weather stations located at Clocolan, Marquard, Senekal, and Ficksburg. The stations were selected based on their spatial distribution within the municipality, which covers an area of 5431 km2 (Figure 1). These stations have archives of meteorological data of up to 35 years, which support comprehensive drought characterization and climate studies. The average rainfall of the Thabo Mofutsanyana district is 600 mm per annum [33]. The Free State province has the highest number of farming units in South Africa, with large areas of fertile and arable land, and it supports a significant proportion of the nation’s agricultural production [34]. The climate in the province is mostly semi-arid with the exception of the north-eastern and eastern parts, which are classified as subtropical [35]. The entire province of the Free State is classified as a summer rainfall area, therefore, in this manuscript, seasonal rainfall refers to the dynamics of the rainfall during the summer months, October to April. Recent studies by Moeletsi and Walker [35] found the earliest onset of rainfall in the district to be within the last 10 days of October, with the last rains being experienced in the last 10 days of March.

2.2. Data Acquisition

Rainfall and minimum and maximum temperature data for the period from 1985 to 2018 were obtained from the Agricultural Research Council (ARC) and the South African Weather Service (SAWS) (Table 1). The missing monthly data across the stations were less than 1%; outliers were checked and the missing data were infilled using the modified inverse distance weighting (IDW) method. In this study, the emphasis was on the summer rainfall season, which is the growing season of the maize crop, and therefore the years of data (monthly rainfall data) were organized from July of one year to June of the next year for each of the four weather stations (Clocolan, Senekal, Ficksburg, and Marquard). The monthly rainfall data were used to determine the annual rainfall characteristics, and the minimum and maximum temperatures were used to calculate the potential evaporation (PET). Yield data (tons ha−1 year−1) for the rain-fed maize production in the four study areas were obtained from Grain South Africa. The Ficksburg station had only 21 years of data from 1985–2006, whereas the other stations had 33 years of data from 1985–2018. Over the years, the number of large-scale commercial farmers varied from 212 to 230 farmers and they planted between 67,000 and 91,000 hectares of land. In 2015–2016, the year of the extreme drought, only 47,000 hectares was planted. https://www.grainsa.co.za/report-documents?cat=27.

2.3. Computation of Drought Indices

The reconnaissance drought index (RDI) was used to compute drought and determine its trend. The drought indices calculator software (DrinC) [36] was used. The RDI was developed by Tsakiris, Nalbantis [37] and has been used for the characterization of drought severity and for regional and trend analyses [37,38,39,40]. In 2016, Tigkas, Vangelis [28] used the two-dimensional (2D) Archimedean copulas concept to develop a new approach which coupled rainfall, temperature, and potential evaporation to estimate drought severity. RDI and SPI classifications are similar, but the RDI was computed using the gamma distribution to fit the cumulated records between precipitation and PET [36]. RDI uses precipitation and temperature data to calculate the potential evapotranspiration (PET), which is needed for the calculation of RDI. The indices were calculated for 3 months (October–December), 6 months (October–March), and 12 months. More than 80% of the annual rainfall occurs in summer (October–March). Maize is planted between mid-October and early November across the Setsoto municipality [41]. Water availability is required throughout the growing period, and the RDI-3 and RDI-6 are both within the growing period. Geographical information system (GIS) techniques are important for agricultural modelling in spatial and temporal analysis of variables such as rainfall, soil, and temperature [42,43]. To understand the spatiotemporal pattern and occurrence of drought in the study area, GIS interpolation techniques were applied. In this study, we used the inverse distance weighted (IDW) method of the GIS spatial interpolation technique for interpolation of the RDI data

Reconnaissance Drought Index (RDI)

The standardized RDI was chosen for our study because it is considered to be highly reliable and supported in the literature [44,45,46,47]. It can also accommodate the months with zero precipitation. RDI is more sensitive than SPI for arid and semi-arid areas [48]. Among the limitations of the SPI is that it does not take into account the contribution of other variables linked to extreme droughts [49,50]. The PET was calculated from maximum and minimum temperatures using the Hargreave’s method [44]. This method is the preferred method for mountainous areas, when compared with methods such as Thornthwaite and Blaney–Criddle [44,51].
PET = 0.0023 × Ra × (Tmean + 17.8) × TR0.5
where Ra is the extraterrestrial radiation, TR is the daily temperature difference between daily maximum temperature (Tmax) and daily minimum temperature (Tmin) in °C (Tmax−Tmin). The Hargreave’s method is known for its simplicity and it has been used widely for semi-arid and arid areas [52]. The RDI can be used in three ways for drought characterization and monitoring: the initial value RDIk), the normalized RDI(nor), and the standardized RDI(std).
R D I ( s t d ) ( i ) = y k ( i ) y ¯ k σ y k
where y k stands for the ln(α(i)k), where y ¯ k is the arithmetic mean of y k and σ y k is the standard deviation. The values of αk have been shown to follow both ln and gamma distributions, although the latter has proven to be most useful for diverse study locations and time scales [53]. The gamma probability density function (pdf) was used for fitting the given frequency distribution of αk. Positive values of RDIs indicate wet periods, whilst negative values indicate dry periods, compared with the normal conditions of the area. Drought severity can be classified as mild (−0.5 to −1.0), moderate (−1.0 to −1.5), severe (−1.5 to −2.0), or extreme (<−2.0) RDI.

2.4. Trend Analysis

Parametric and nonparametric tests are used in trend detection of climatic and hydro-meteorological data [54,55,56]. Recent literature supports the use of a nonparametric test as the preferred test because it is relatively more robust in accommodating missing data and non-normally distributed data usually associated with hydro-meteorological data [55]. Thus, the nonparametric Mann Kendall test was used to detect drought trends in this study. Several other studies have also used the Mann Kendall test to determine trends of hydro-climatic time series [57,58,59,60]. If the time series shows a linear trend, then its slope can be determined by applying a nonparametric test developed by Sen in 1968. Sen’s slope is applied to determine rate of change of the RDI values over time [61].

3. Results

3.1. Mean Annual Rainfall and Annual Maize Yields

The mean annual rainfall of the Setsoto municipality ranged from 613 mm to 718 mm (Table 1), with the summer months of October to March accounting for most of the annual rainfall. The highest summer rainfall (1224 mm) was measured in Ficksburg in 1994. Seasonal rainfall patterns were similar across all four weather stations. The difference in the means among the three sites (Clocolan, Marquard, and Ficksburg) was about 60 mm, with the largest difference of 105 mm recorded between Marquard and Ficksburg. The annual rainfall variability (>21%) was very high (Table 2). The maize yields and standard deviations are presented in Table 2. The yields did not differ significantly across the sites. Even though the soils are arable and sufficient fertilizer is added, the amount and distribution of rainfall remains the limiting factor of production. Growing maize at sites with high temperatures and high evaporation requires careful management and a knowledge of soil water storage per season and expected rainfall. Drought events in the early or later parts of the growing season can severely impact the yield.

3.2. Reconnaissance Drought Index (RDI)

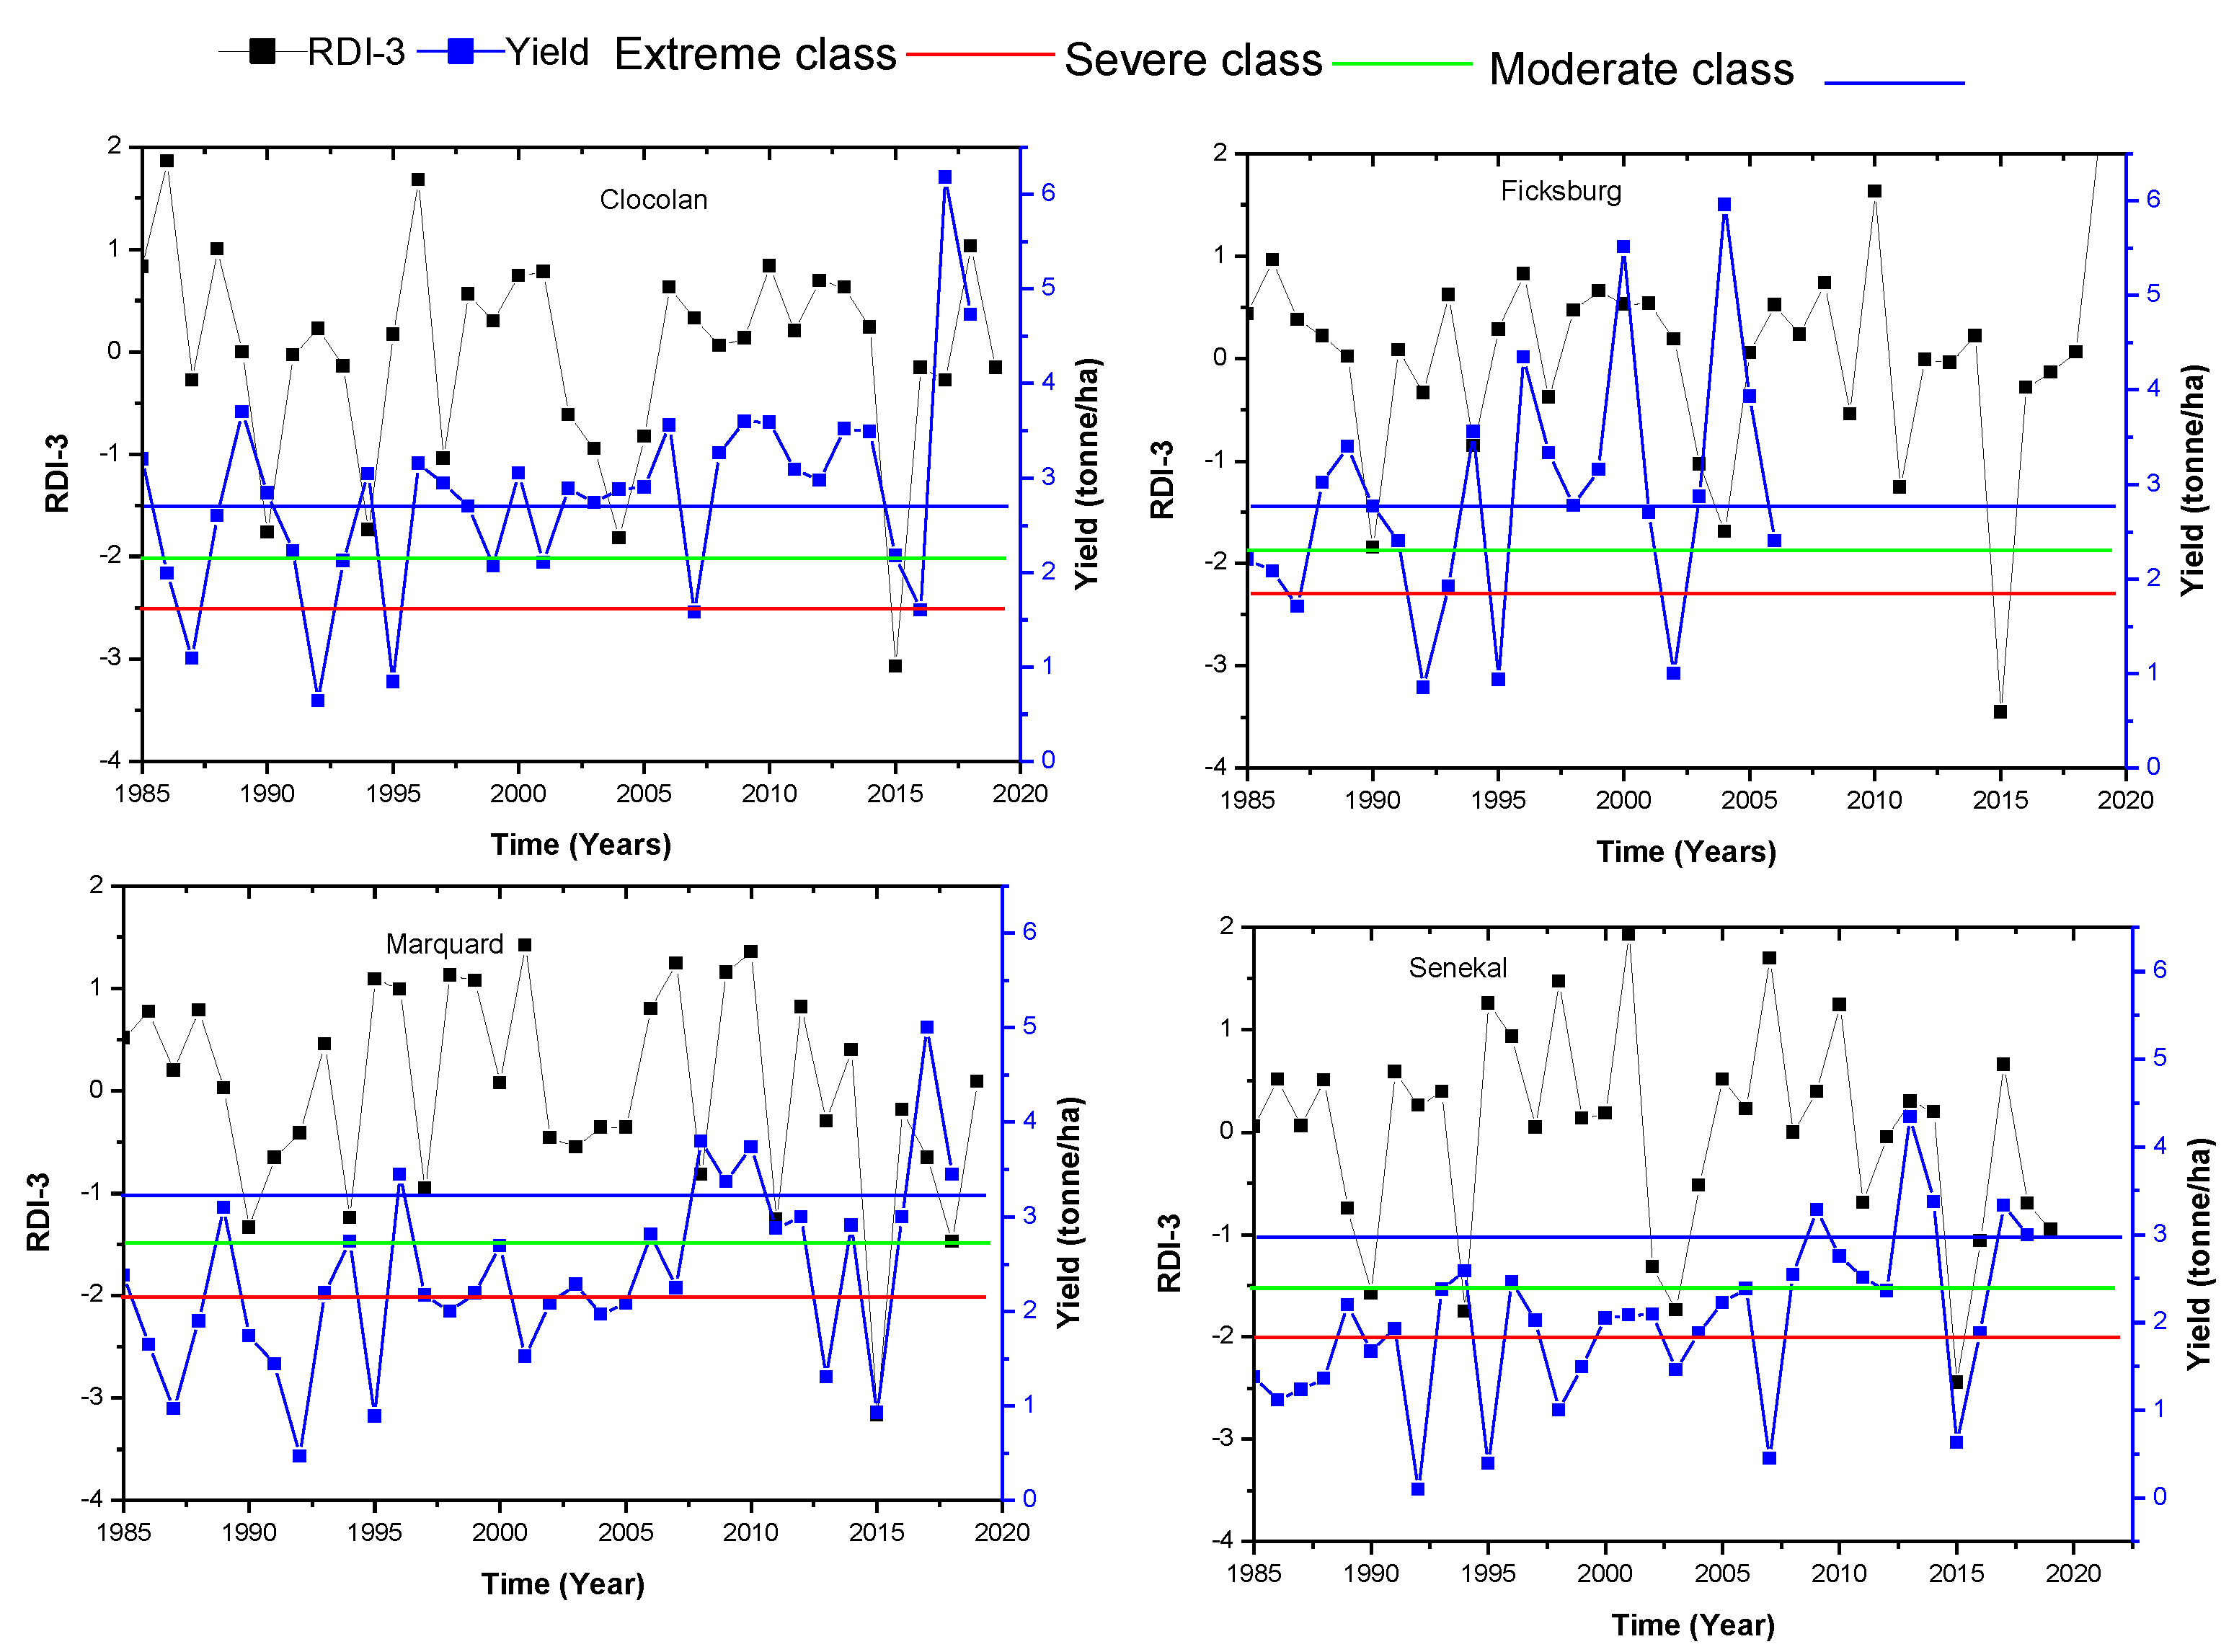
3.2.1. RDI Values Calculated for the 3 Months of October, November and December

The RDI values calculated for the first 3 months of the rainy season (October–December) are shown in Figure 2. The RDI values of <−2.0 recorded in all the stations indicate the occurrence of extreme drought events in 2015. The severe drought RDI values (−1.5 to −2.0) were recorded in 1990, 1994, 2003, and 2004 in one or more stations. Moderate droughts were recorded in 8 of the 35 years studied (1990, 1994, 1997, 2002, 2003, 2010, 2011, and 2018) at the various stations. The general trend observed was that in the event of an extreme or severe drought year, the yield declined in that year or in the following year, and in a few cases significantly, but the variability of the data makes it difficult to make any definitive conclusions [62]. In years in which only moderate droughts were measured, the yield varied within the deviation of the mean. Yield is driven by a number of variables, the main one of which is water availability [63]. There needs to be synchrony between the demand for water and the availability of water for the crop; this study partially addresses this by looking at the three distinct phases in the phenology of the crop over the season. In this respect, the study was successful. A nuance on this is hydrological characteristics of the sites, which include the soil water storage and the movement of water between the topsoil and the subsoil.

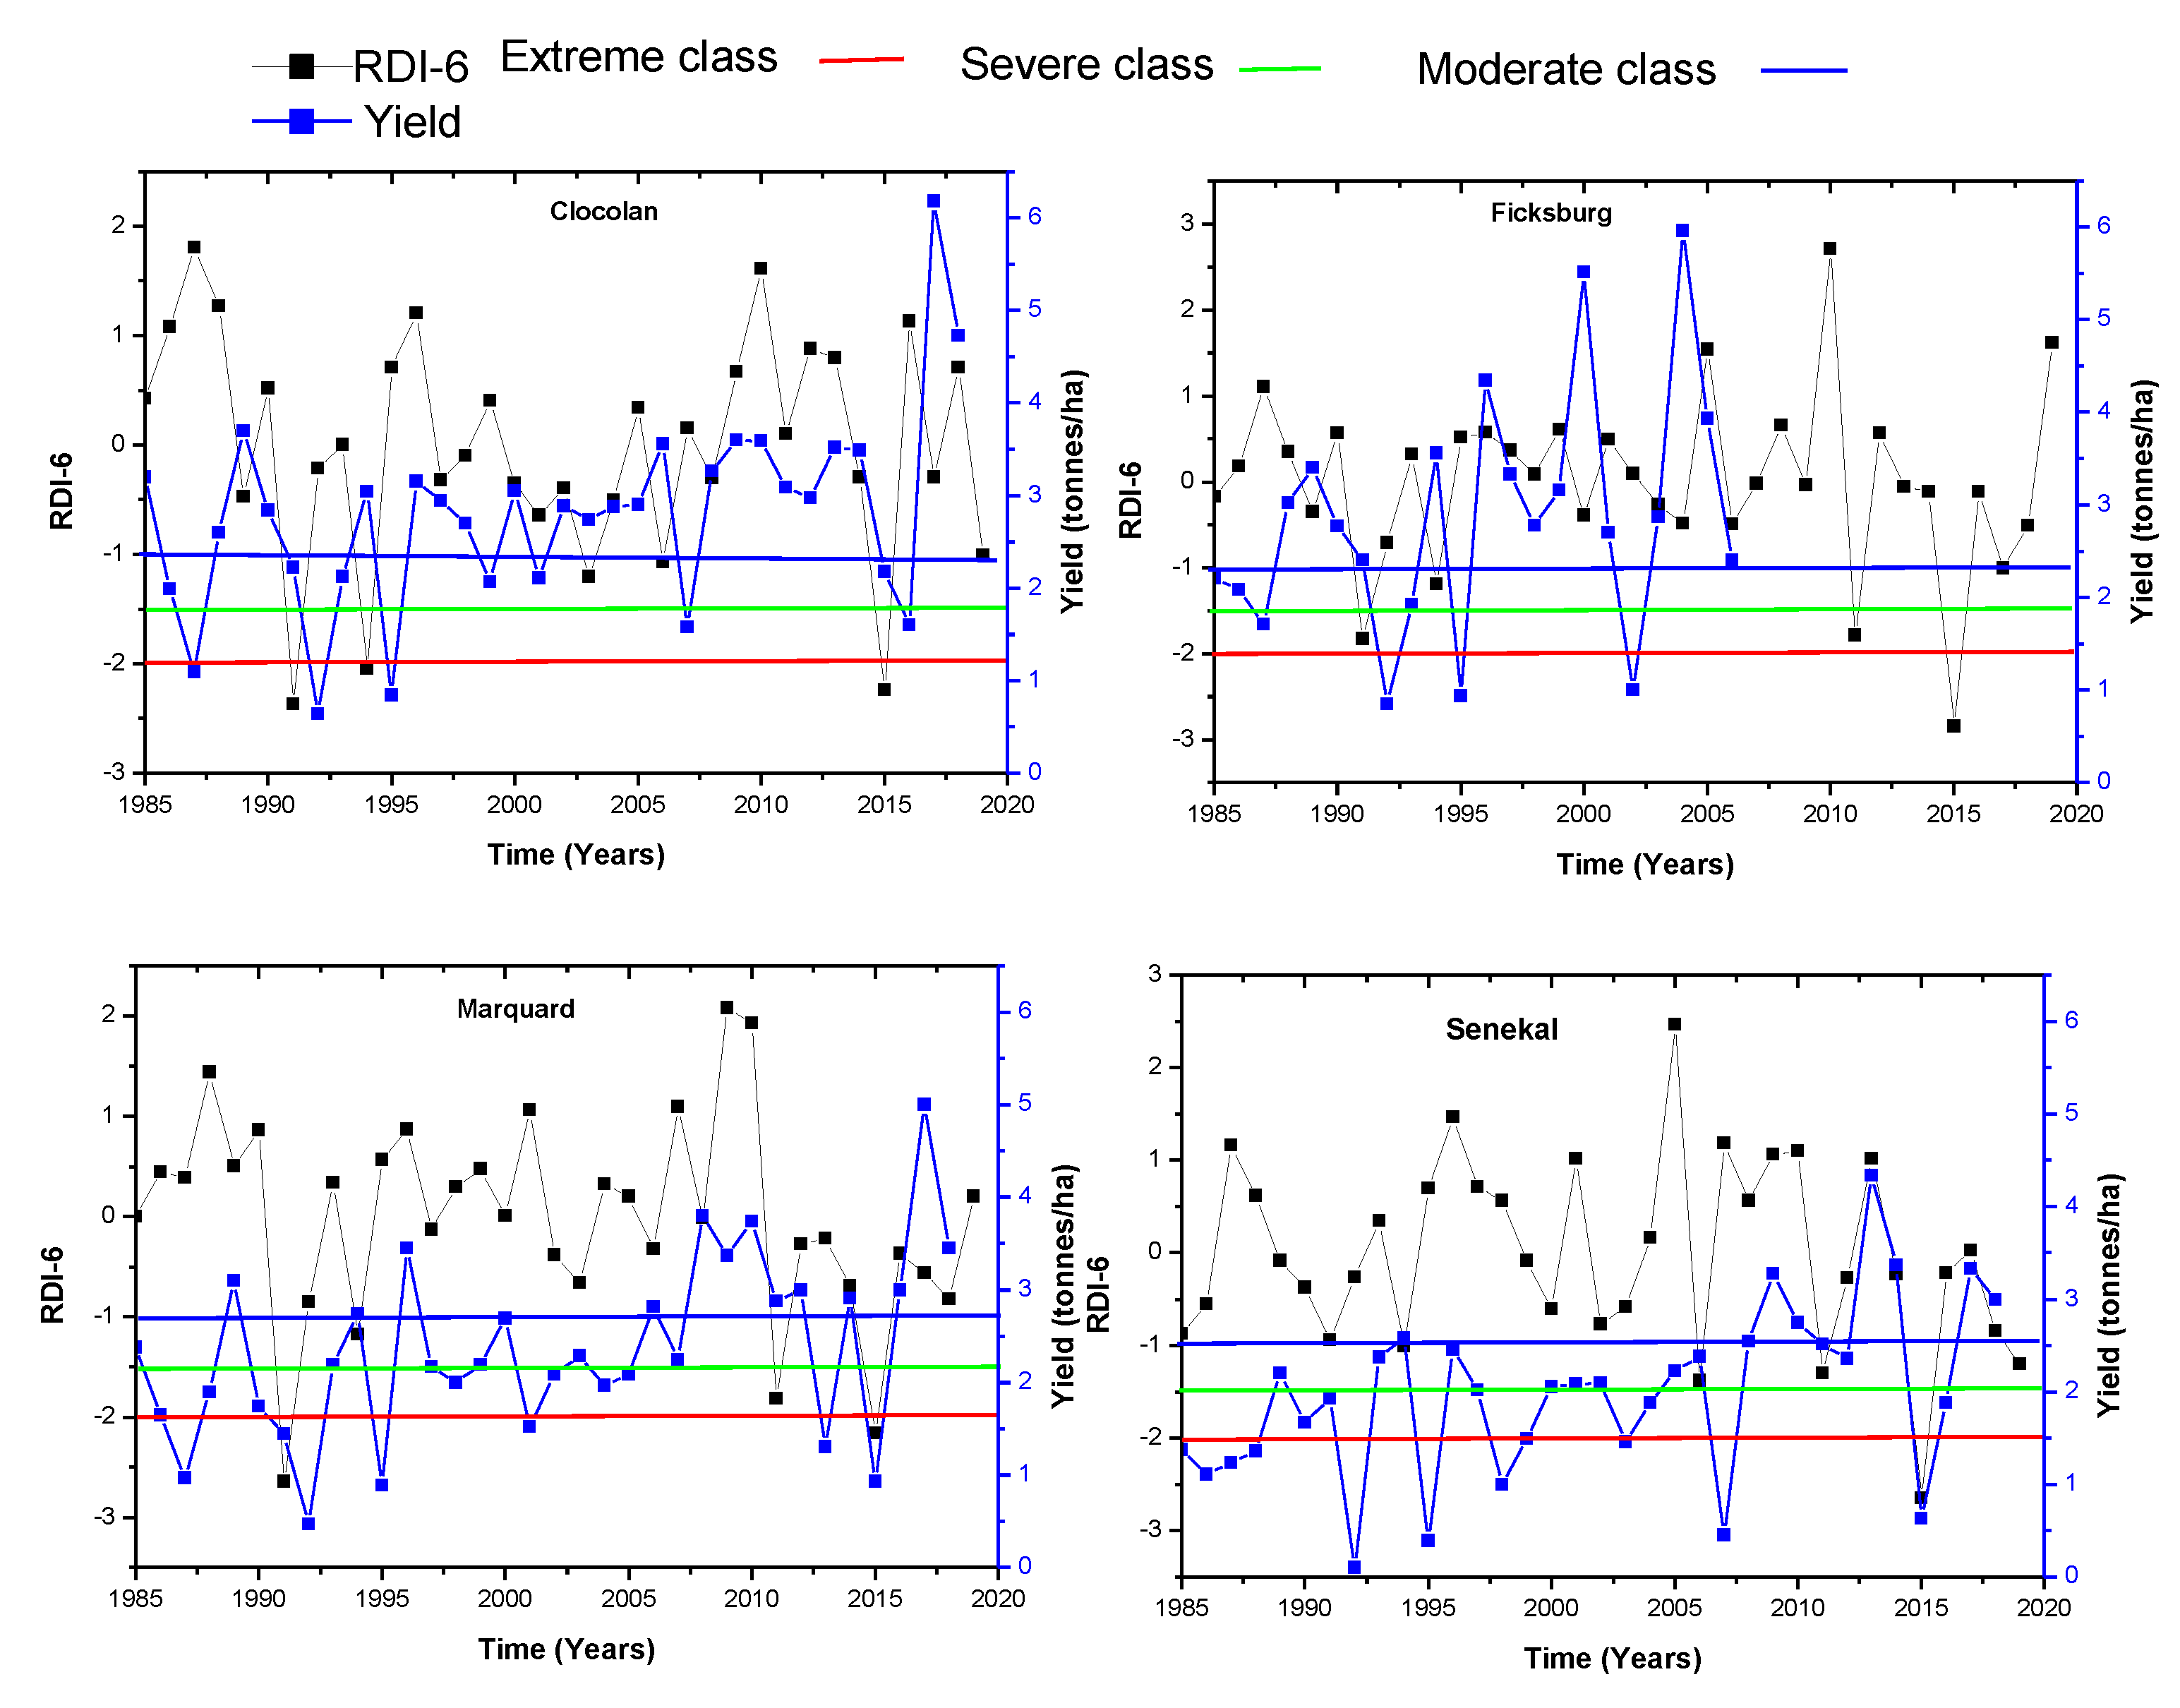
3.2.2. RDI Values Calculated for the 6 Months of October–March

The class of extreme drought severity with RDI-6 values of <−2.0 was observed in 1991 in Clocolan and Marquard, in 1994 in only Clocolan and, and in 2015 across all the stations (Figure 3). The severe drought conditions were recorded in 1991 at three stations and in 2011 at two stations, Moderate RDI-6 values were also observed in six years at various stations, 1994, 2003, 2006, 2011, 2017, and 2018 (Figure 3). Similarly to RDI-3 data, in the event of an extreme or severe drought year, the yield declined in that year or in the following year, in a few cases significantly. In years in which only moderate droughts were measured, the yield varied within the deviation of the mean. RDI values calculated for either the 3 or 6 months showed that an extreme drought event occurred in 2015. The 3 month RDIs seem to be more sensitive in detecting extreme and severe drought years, indicating the importance of the first three months of plant growth. Maize is usually planted in the second week of October, and if extreme or severe drought occurs in these three months, the yield would probably be negatively impacted.

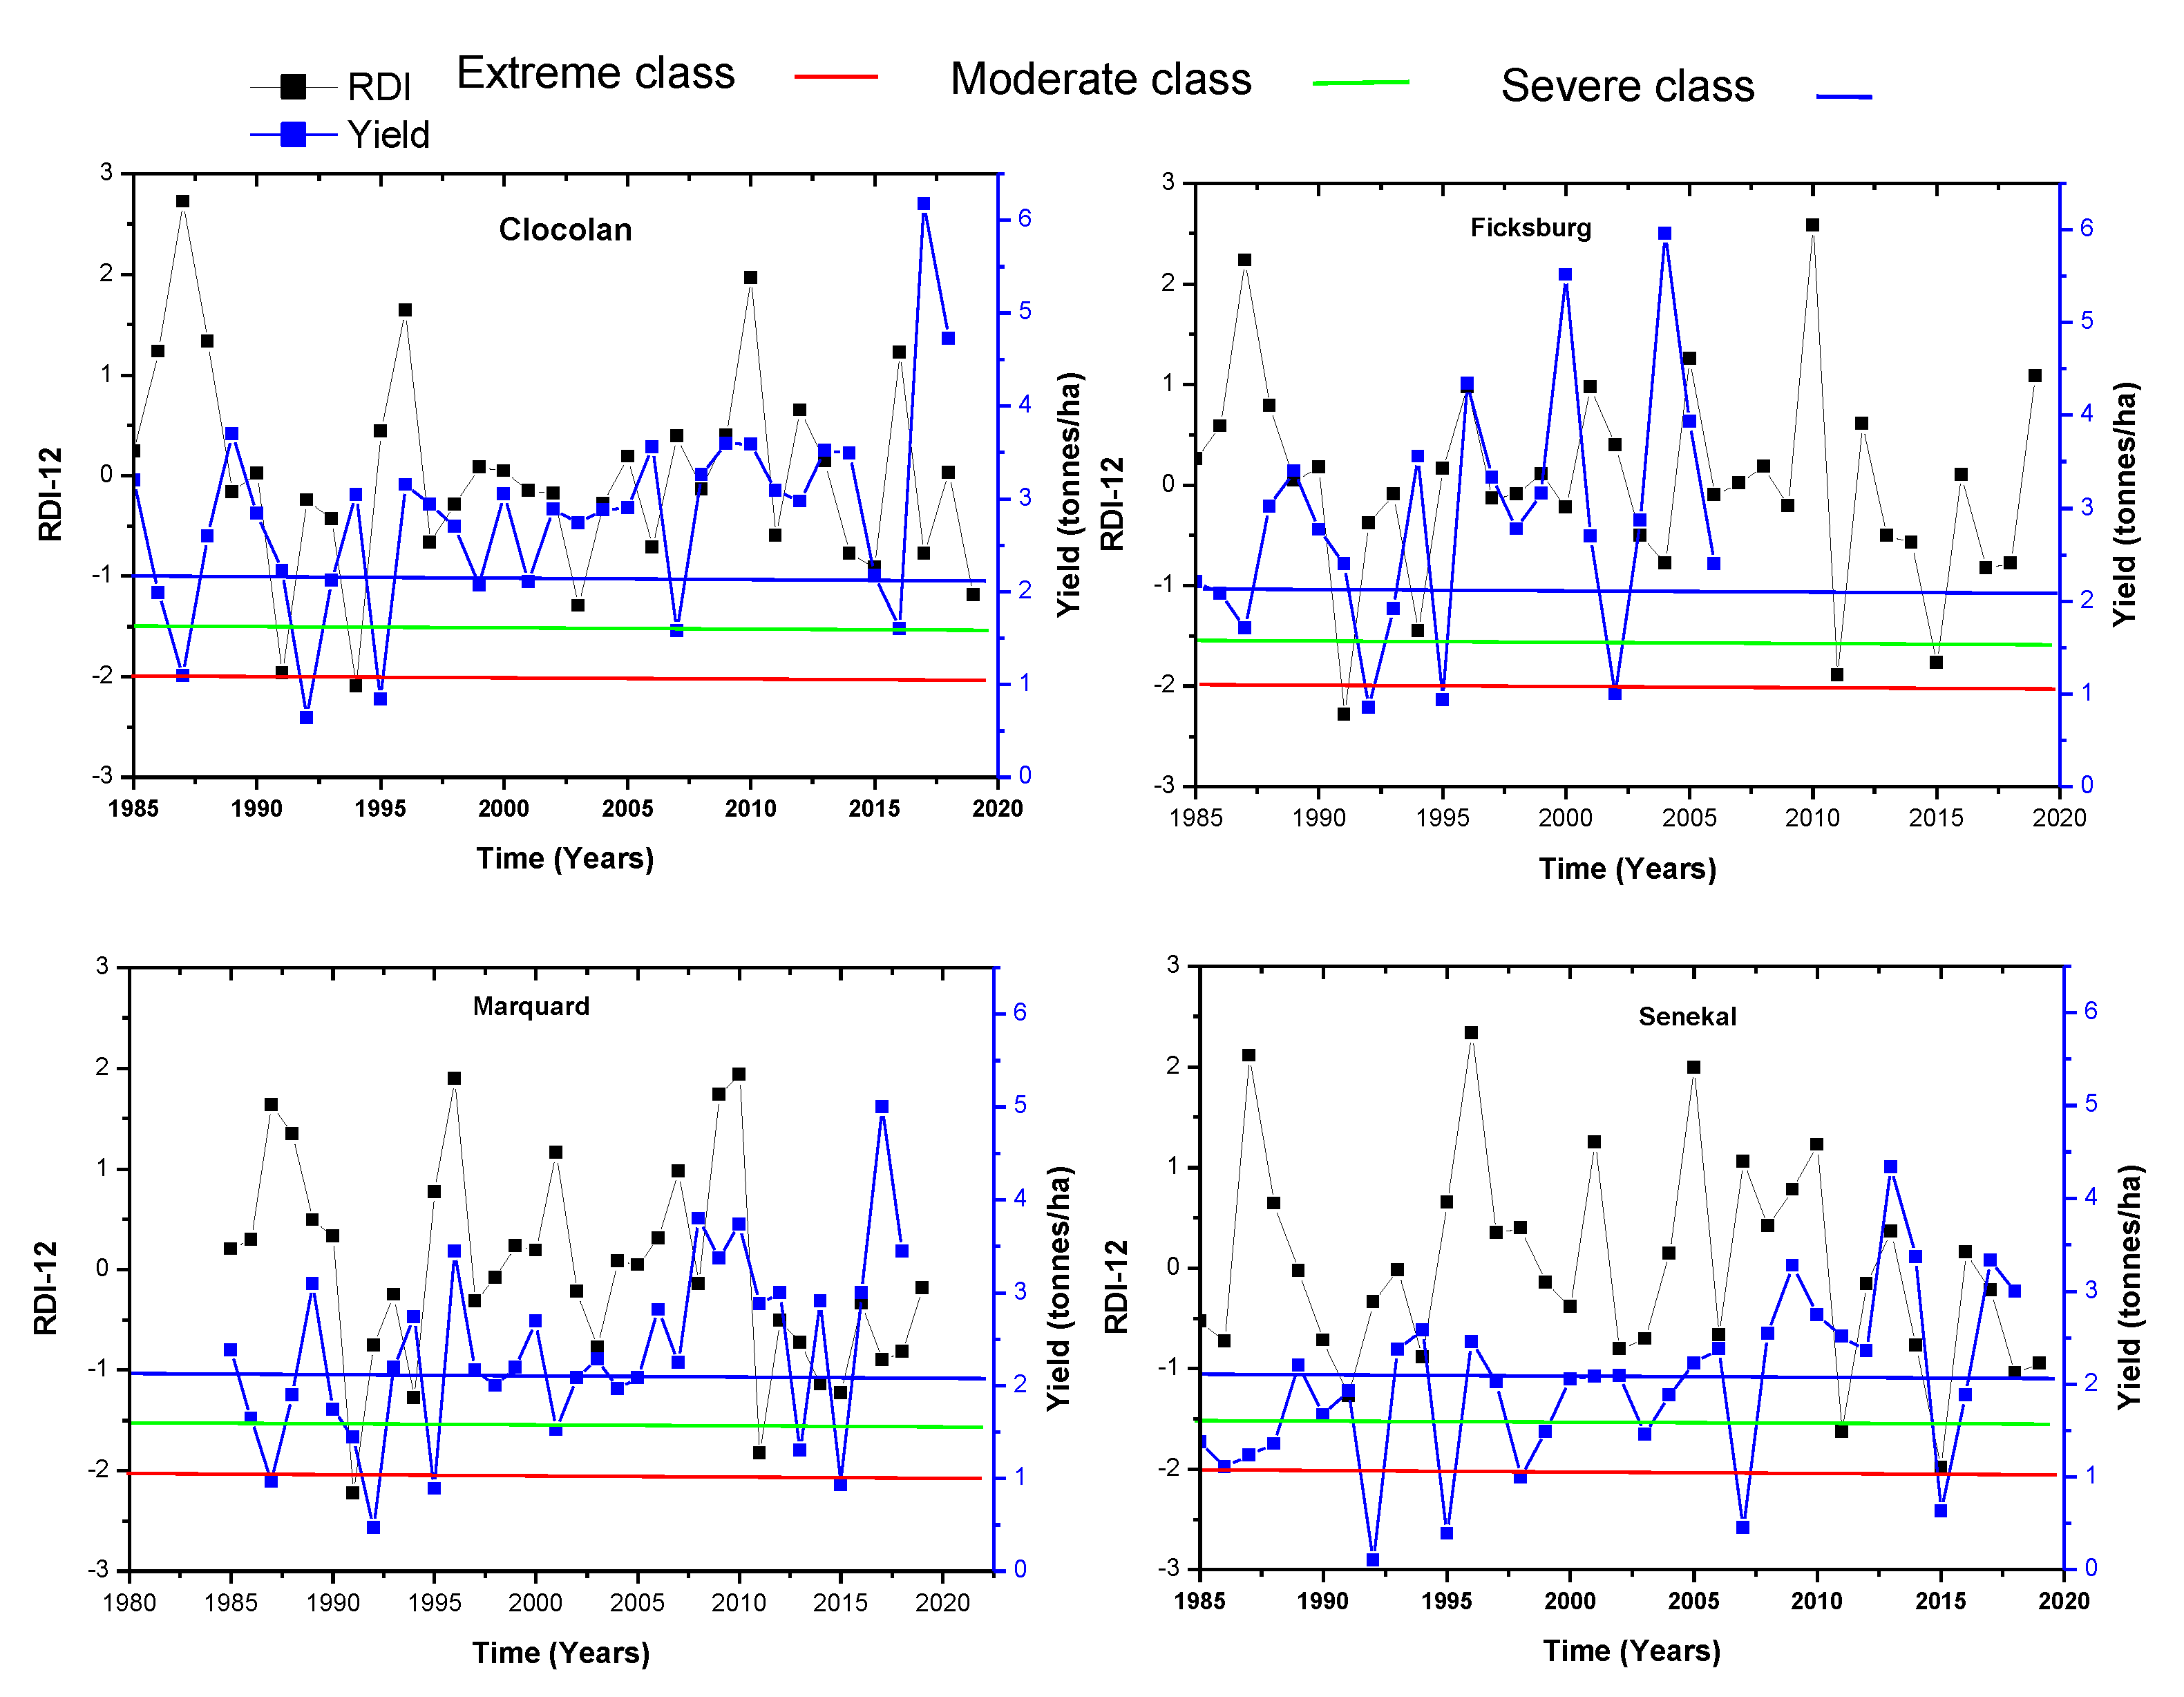
3.2.3. RDI Values Calculated for the 12 Months of October—September

The RDI values calculated for the 12 months are shown in Figure 4. The annual (RDI-12) extreme drought values of <−2.0 class were recorded in 1991 and 1994. When analyzed over the 12 months, 2015 was not an extreme drought event, which is shown clearly in the 3 and 6 month analyses, indicating that an extreme drought event is particularly important during the early-to-late growing season and would result in a decrease in yield. The severe drought conditions occurred in 2011 in three of the stations, whilst in 2015 it was observed in Ficksburg and Senekal weather stations. Moderate drought condition was observed in four stations in 1991, 1994, 2003, 2014, 2018, and 2019. Extreme drought and severe drought events did lead to a decrease in yield, but moderate droughts had little influence on yield. The yields across all locations were low with a high variability, making the detection of trends difficult. Soil water storage from year to year is important, and if there are late rains in May and June, it positively impacts the rate of growth in the first few months after planting. The cultivars of maize planted would also have changed over the years, but data are not available.
The RDI values show that for the first three months of the growing season (October, November, and December), extreme and severe drought events do decrease yield, either in the year of the drought or in the subsequent year. This effect gets dampened as one moves into the 6 month analysis and becomes less important for yield estimates when analyzed over the 12 months. It must be emphasized that these are general interpretations and there are exceptions, which could have been caused by many confounding factors.

3.3. Drought Trends

Figure 2, Figure 3 and Figure 4 show the different time series (3, 6, and 12) for the RDIs for the four weather stations of Clocolan, Ficksburg, Marquard, and Senekal. In these figures, the solid blue lines show the fitted first-order linear trend for each time series. Generally, there was a decreasing trend of RDI time series across the stations. The steepness of the slope increases from RDI-3 to RDI-12 (Table 2).
The Z parameter of Marquard for RDI-12 (−1.96) and RDI-6 (−1.73) showed significant downward trends, whilst the rest of the time series showed downward trends, but these were not significant (Table 2). There were no positive values for the Z parameter across the stations. However, from the short-term time series to the long-term ones, the frequencies of significant trends increased. The Sen’s slope estimator for the RDI-6 and RDI-12 decreasing trends in Marquard were each −0.03 per month for the period 1985 to 2019 (Table 2).

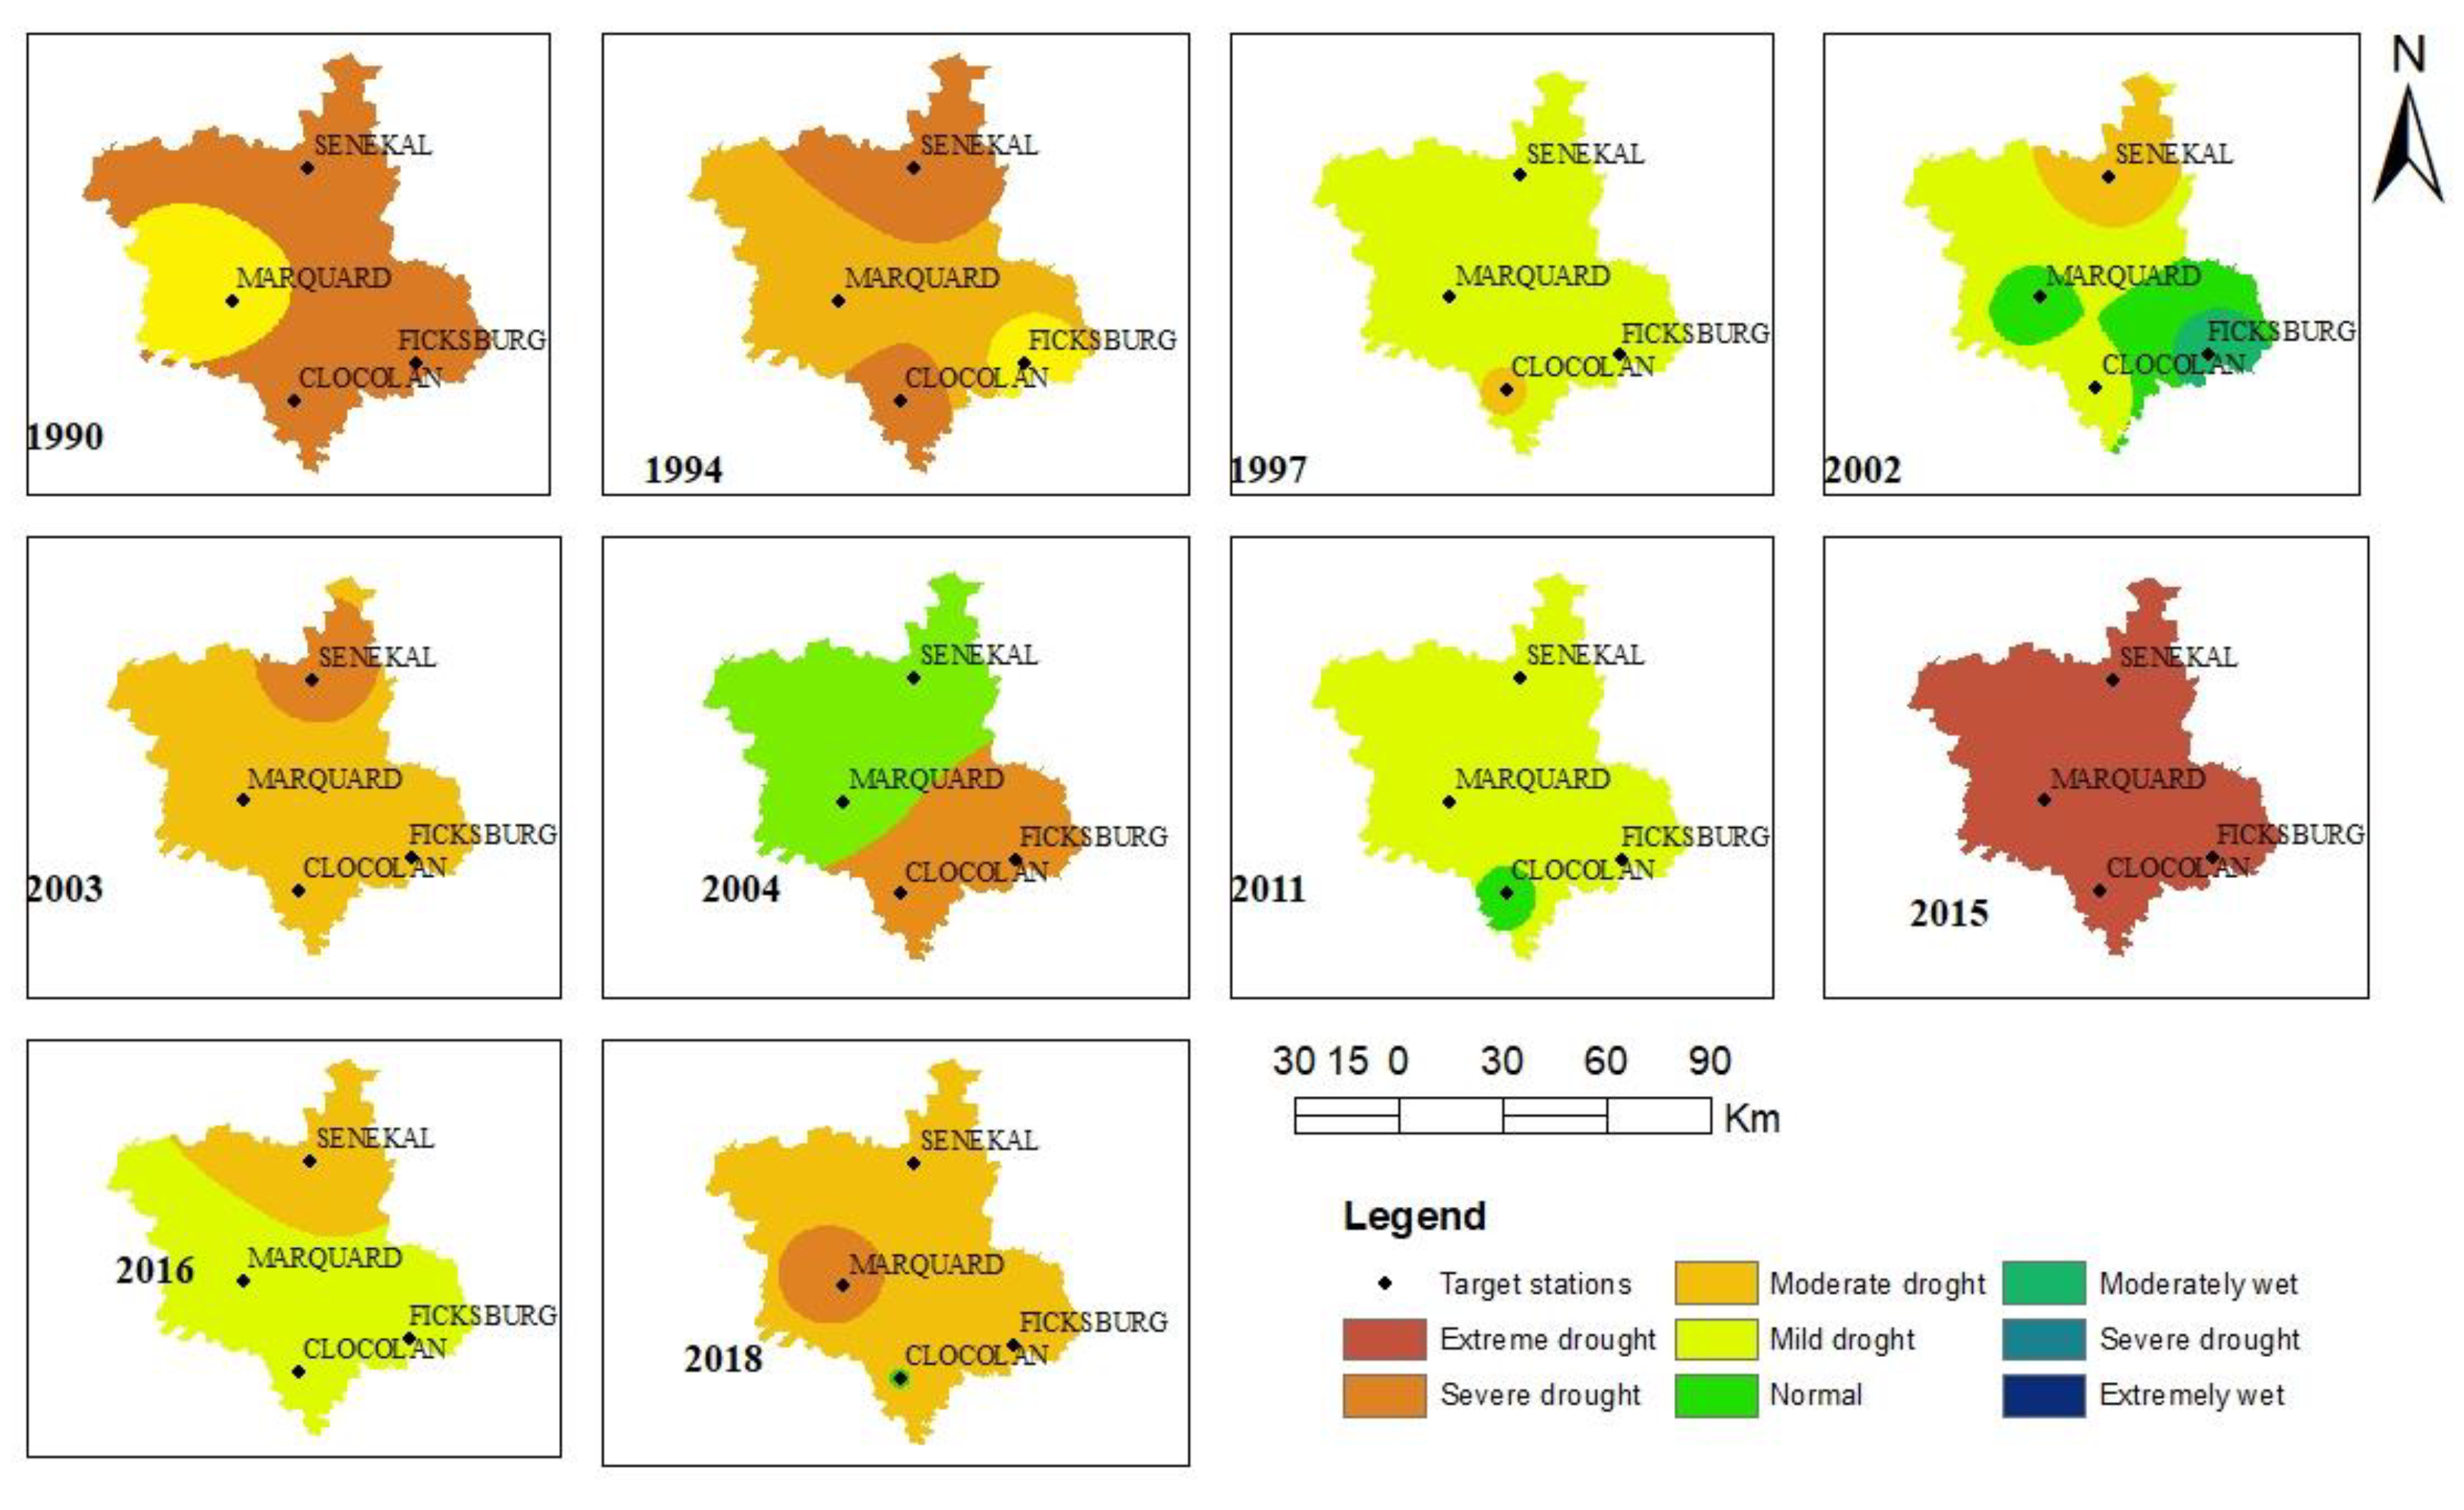
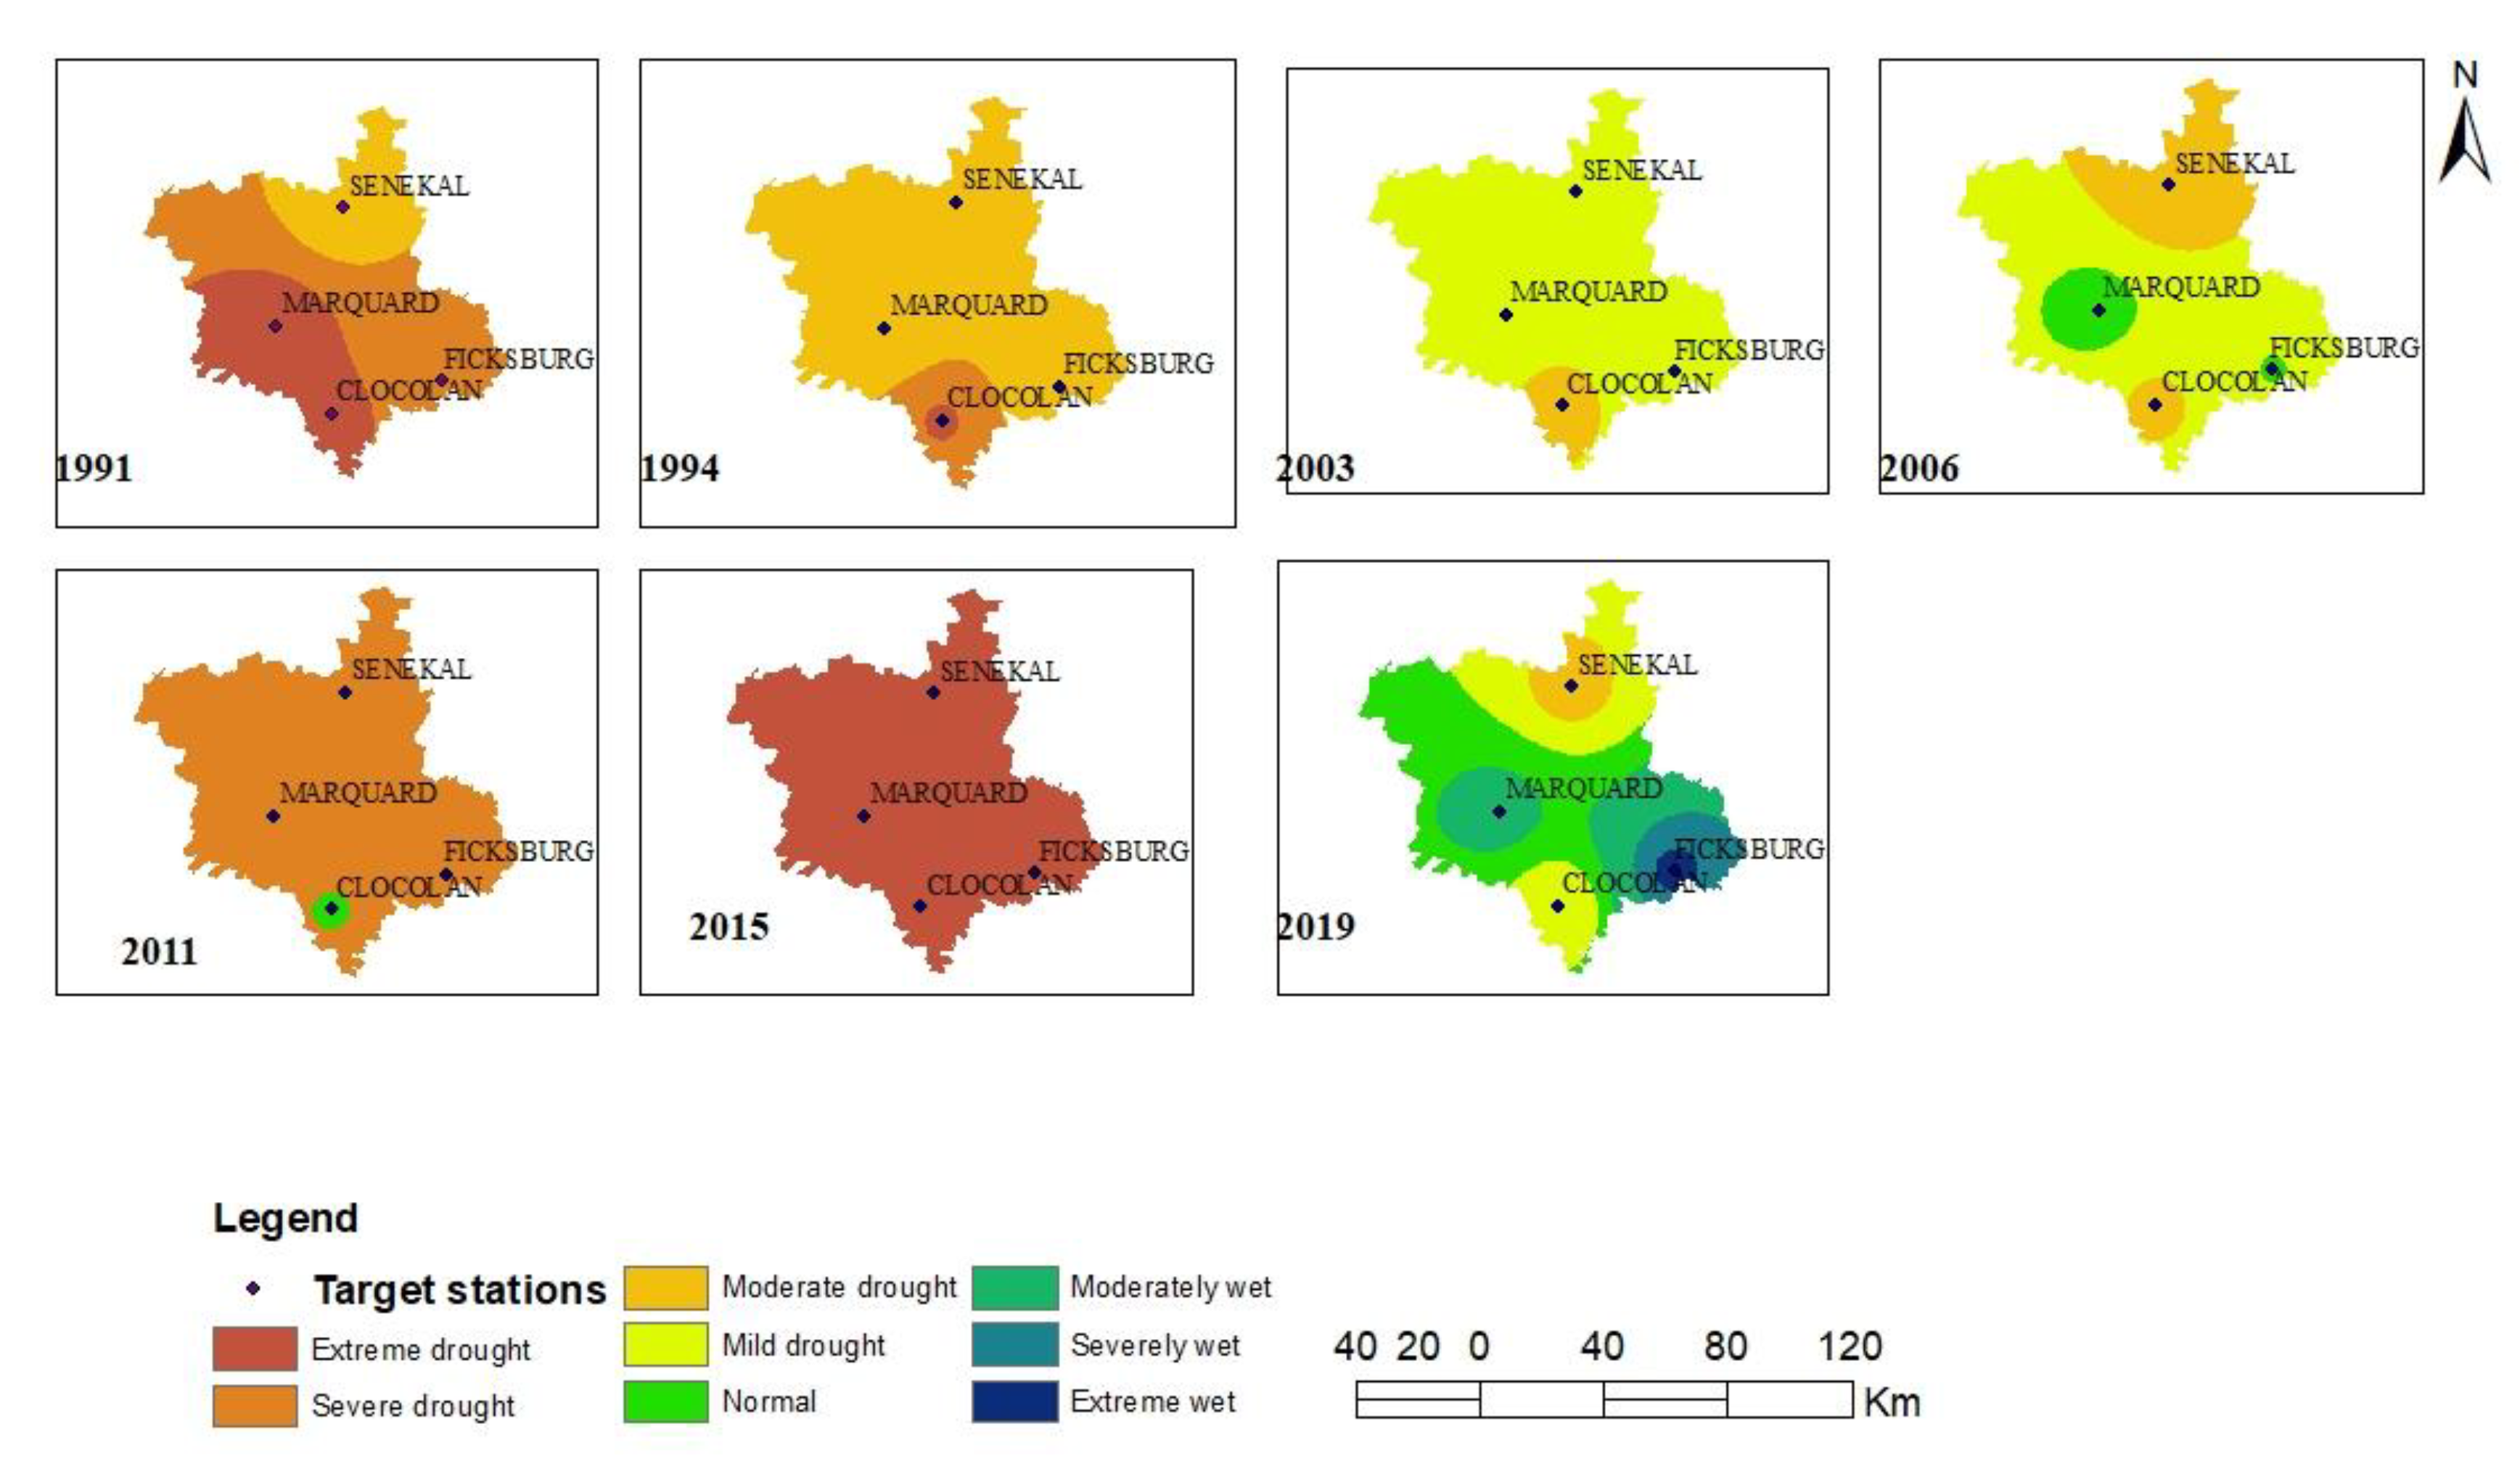
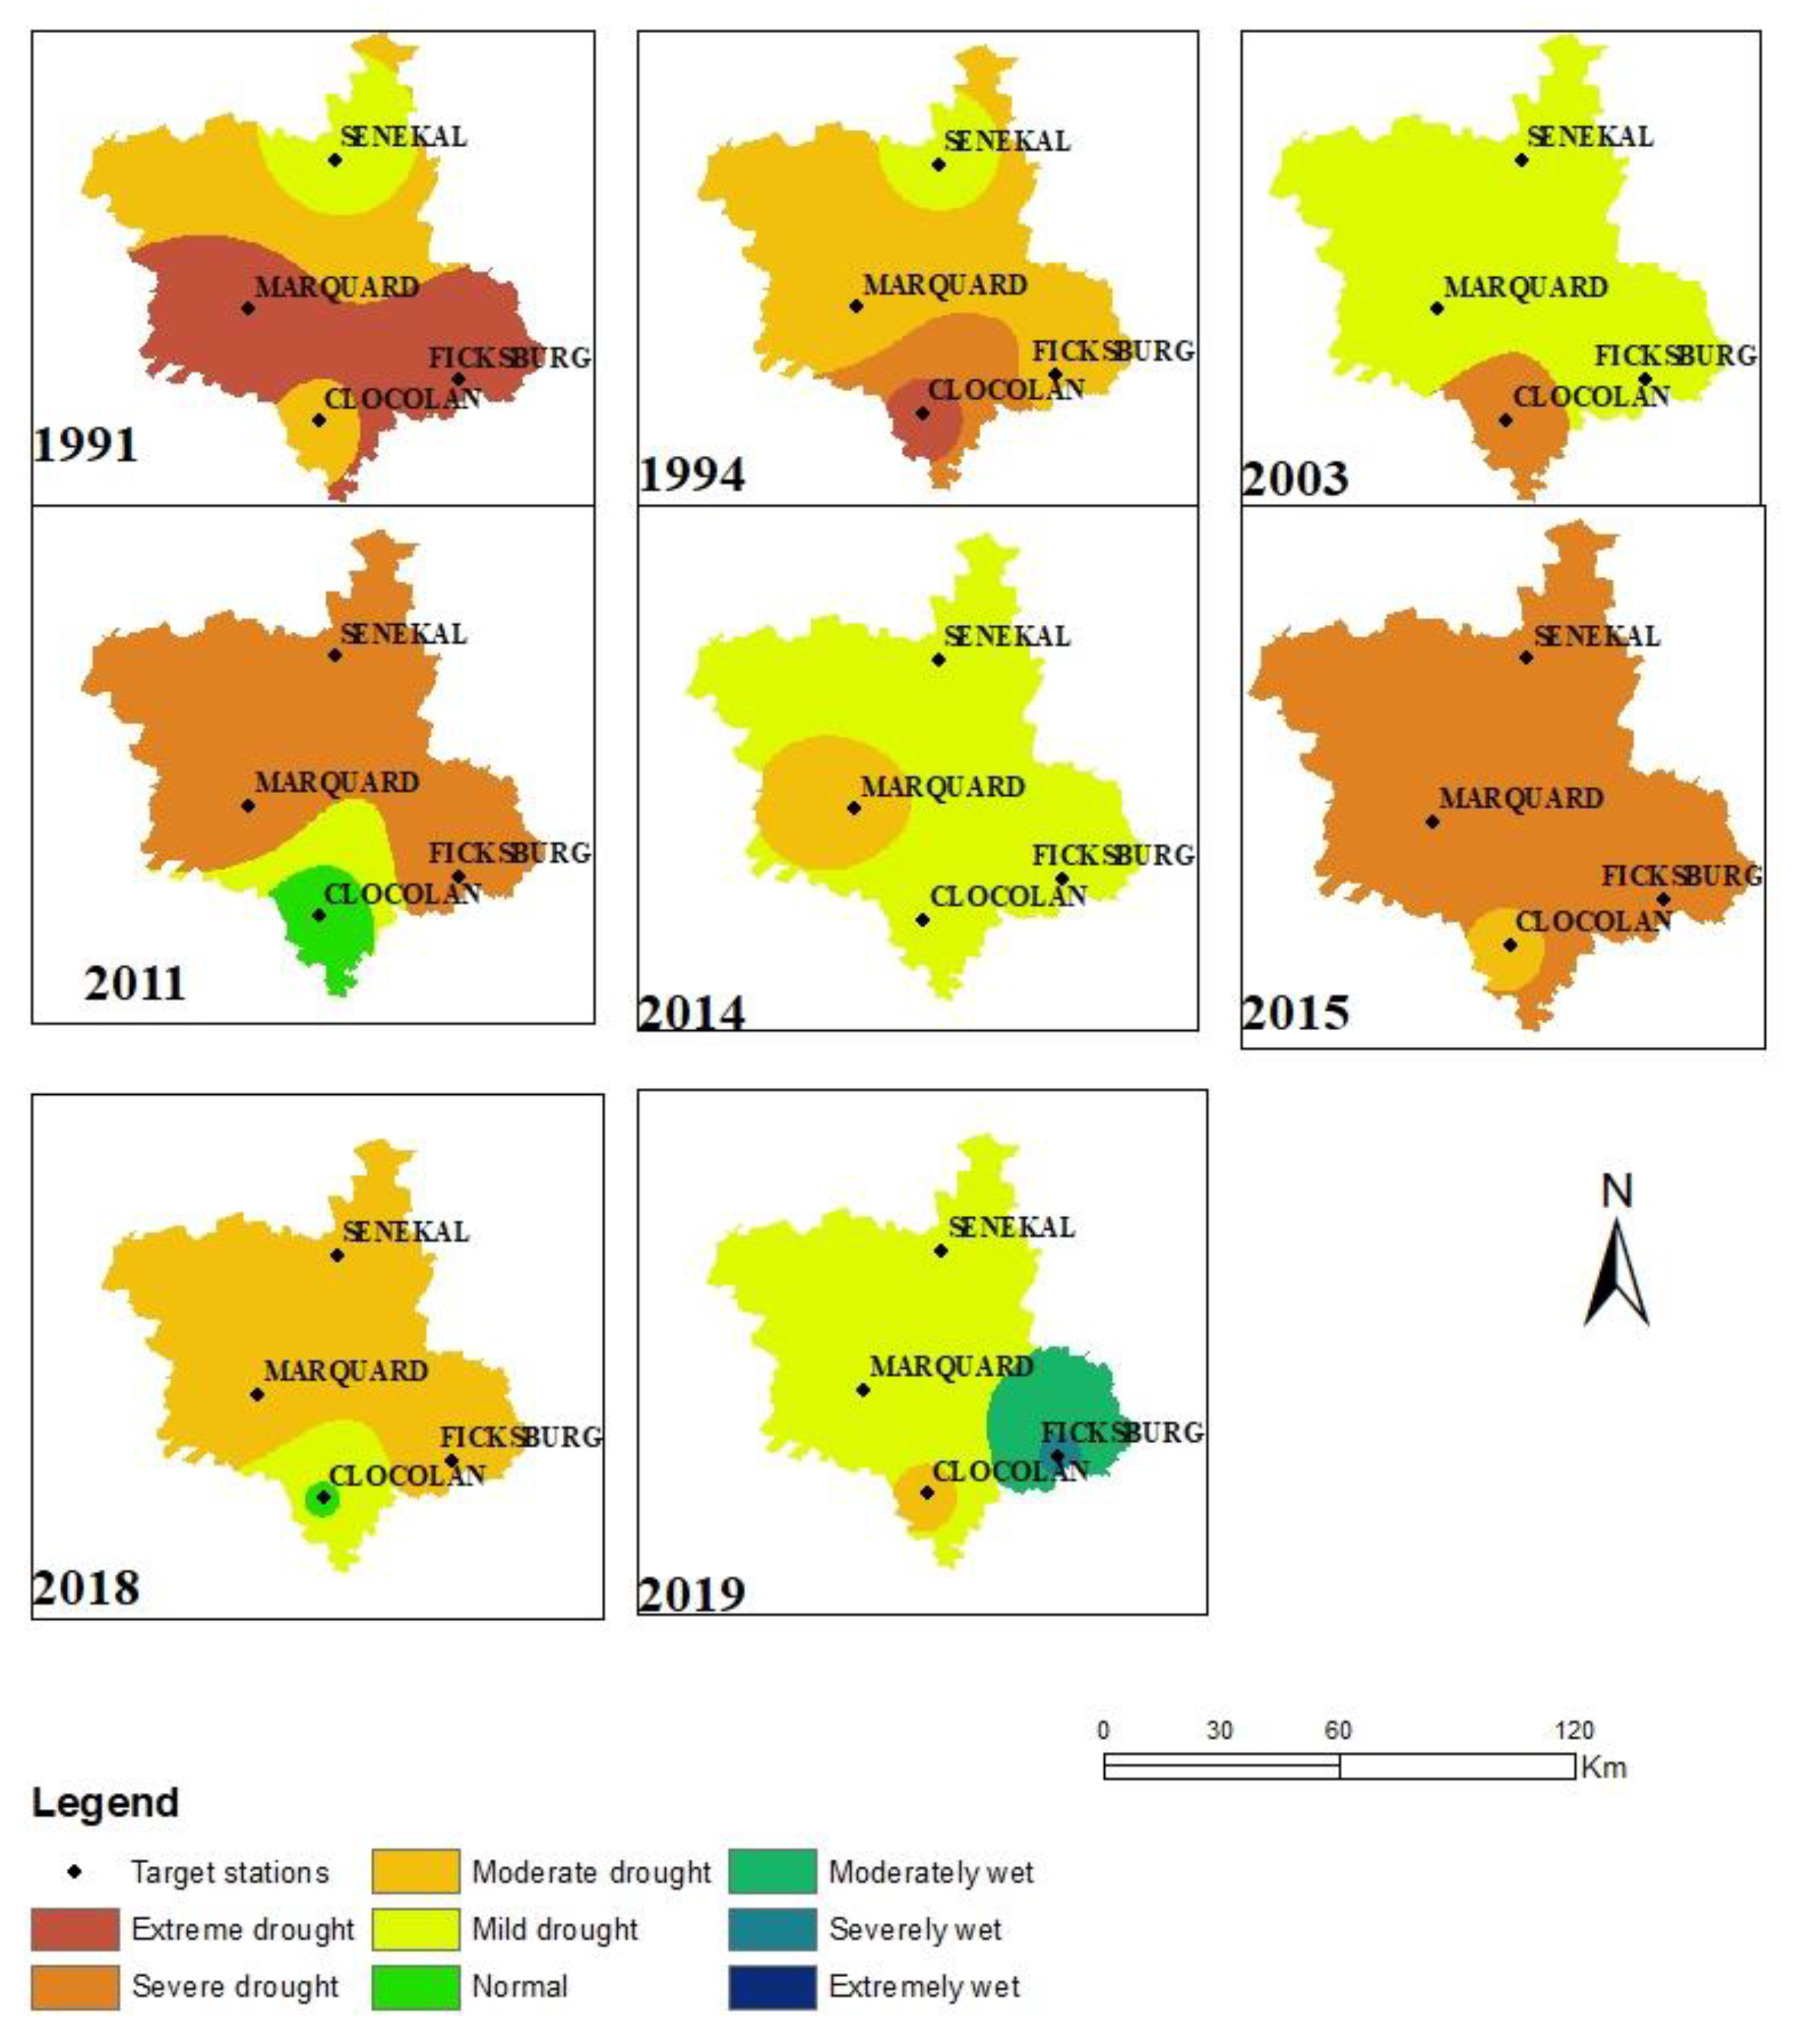
3.4. Spatial Drought Analysis

In this study, drought spatial charaterization was established using the inverse distance weighting (IDW) interpolation method for the three time intervals of RDI (3,6, and 12 months), as shown in Figure 5, Figure 6 and Figure 7. Similar approaches have been taken by Abdelmalek and Nouiri [64], Cavus and Aksoy [65,66]. The IDW method is a deterministic technique which is based on the measured values and does not include autocorrelations because the values are calculated for a particular area in a particular year [67,68]. The spatial display maps for RDI values were prepared using Arc GIS 10.3, and the drought years are displayed in Figure 5, Figure 6 and Figure 7. Only years with RDI values that were indicating droughts were used for the spatial analyses. The interpolated maps were created using the only data available for the area over the time period. These data highlight that across all three RDI values the areas impacted by the three drought categories vary extensively. The only extreme drought recorded for the entire study area was in 2015. The severe drought in 1990 was experienced across a wide area, with severe and moderate droughts being fairly widespread in 1994, 2003, and 2018. The other years showed some spatial variability from mild droughts to normal conditions (Figure 5).
Using the RDI-6 values, the spatial analysis shows six years in which mild-to-extreme droughts were experienced across widespread areas. In 2019, relatively wide areas experienced above-normal rainfall, with the Ficksberg area being extremely wet (Figure 6).
Using the RDI-12 values, the spatial analysis shows six years in which mild-to-extreme droughts were experienced across widespread areas. In 2011 and 2019, the Clocolan and Ficksberg areas experienced above-normal rainfall (Figure 7).

4. Discussion

Rainfall and minimum and maximum temperatures over a 35 year period were used to calculate the drought indices. The variability range of the rainfall distribution was 22–25%, with a mean annual rainfall of between 613 and 718 mm (Table 1). The RDI time scale was used to evaluate the temporal evolution and characterization of drought in the Setsoto municipality. The 3 month RDI (RDI-3) was used for assessment of short-term and medium-term soil moisture conditions. The drought index for (OND) average RDI-3 calculated for the municipality to characterize the extreme drought conditions occurred in all stations in only 2015 (Figure 3). The RDI-3 severe drought conditions varied in their spatial coverage, with three of the stations showing a severe drought in 1990 and two stations in 1994 and one station in 2003 and 2004. Drought conditions in the years 1990, 1994, 2003, and 2004 and 2015 were also widely reported by other researchers [20,21,69,70]. The current study supported the research of Mbiriri, Mukwada [20] for the Free State province. The 3 month RDIs showed 4–6 years in which moderate, severe, or extreme events occurred, these years varied across the four stations, but Senekal showed the most frequent occurrence of droughts. Farmers in this area should minimize the loss of soil moisture during the winter months when the lands are fallow and must be well informed about possible planting dates at the beginning of each new season. Fewer hectares should be planted if the national weather forecasting system indicates a poor rainfall year with early droughts in the growing season; early warning was done in 2015. These approaches will help to minimize financial loss.
The RDI-6 showed moderate, severe, and extreme drought conditions (Figure 3). The number of drought events when calculated using the RDIs also showed 4–6 years in which moderate, severe, or extreme events occurred, these years varied across all the stations, except for the 3 years in which extreme events occurred (1991, 1994, and 2015) and moderate droughts in 2003, 2006, and 2019. The 6 month RDIs are mostly used to analyze growing season water balances, with 80% of the annual rainfall occurring in these months.
The 12 month RDIs also revealed 4–6 drought years over the 35 year period, with Marquard having six years in which drought occurred. Over the three RDIs calculated, three out of the four stations (Clocolan, Ficksburg, and Senekal) showed the highest number of event years across the dataset. This highlights the variability across the stations. In the 35 years, three extreme drought conditions were observed in three stations, particularly in 1991 and 1994 but with 2015 being the year in which the most extreme drought occurred. It is also clear that the downward trends of RDIs indicate the severity of drought occurrences in the area. Drought severity is not only a function of precipitation, which is used in the determination of severity by other indices like Deciles index and the SPI. The RDI drought index includes PET, which supports the notion that drought severity is affected by more complex conditions such as the upward trends of PET and the interacting temperature, humidity, and wind speed trends [71]. There is no conclusive evidence that drought severity is increasing over this 35 year dataset. When studying drought severity, a multivariate approach should be considered to get a better insight of the severity [72]. Previous studies on drought analysis in South Africa have focused on trends in precipitation, PET, aridity index, wind direction, and topography [20,73,74,75,76,77]. These approaches mainly focus on a single variable, which does not account for the influence of temperature as a secondary variable. The SPI has been promoted as a tool for enhancement of our understanding of drought events [12,78]. The high rainfall variability in South Africa has made it difficult to link the decreased rainfall to drought severity, even though some research by Nicholson [79] has suggested this pattern. Some studies have emphasized that there are both upward and downward trends in annual, seasonal, and monthly rainfall, but none of these trends are significant at any spatial scale [80,81].
The results from this study showed downward trends, but this trend was only significant in Marquard, suggesting that the RDIs for the 6 and 12 month analyses are more robust in revealing the trends in the time series. Choosing an appropriate time scale at which data are analyzed to provide an understanding of drought and its severity is a vexed problem. The use of only monthly precipitation data for drought assessment has recently come under serious criticism [82,83,84]. Monthly precipitation indices are simple to implement since they use accumulated values of climatic variables during a month. Such indices do not account for extreme events within the 30 days, like the occurrence of a storm whose value can increase the precipitation from 5 mm to 15 mm [85,86]. Such events in arid and semi-arid areas can influence the infiltration of water and change the water resource management. Thus, the influence of PET should also be considered when investigating drought occurrence and severity. Spatial analysis shows a large variability of drought patterns across the municipality, over the years, with the 3 month RDI values giving a more detailed picture of this variability than the 6 and 12 month RDI values.

5. Conclusions

This study evaluated the drought characteristics in the Setsoto municipality of the Free State province from 1985 to 2019 using the reconnaissance drought index (RDI), which uses rainfall and PET data. Droughts were characterized into extreme, severe, and moderate. The drought characterization results indicated that the area has experienced moderate-to-extreme droughts conditions with 4–6 drought event years over the 35 year period. The high variability showed that these events occurred with greatest frequency at three of the four weather stations, with Ficksburg recording the lowest number of events, whereas Clocolan, Marquard, and Senekal recorded 5–6 events. Extreme drought events were recorded in 1991, 1994, and 2015. Severe droughts occurred in 1990, 1991, 1994, 2004, 2011, and 2015. Moderate droughts occurred in 1990, 1994, 2002, 2003, 2006, 2011, 2016, 2017, 2018, and 2019. Maize yields were very low, 2.5 tons ha−1 year−1, with a high variance. Farmers need to maximize profit and minimize risk. Our results show that the first three months of the growing season, October–December, are critical for the establishment and ultimate yield of the crop. Good forecasting at a regional scale is essential to maintain the productivity of this region. The Free State province is the food basket of South Africa, hosting the highest number of farming units in the country. The Setsoto municipality is one of the maize production hubs in the province and is often exposed to frequent droughts, affecting the food and financial security of the country. Rainfall variability is high, and the area sits at the threshold of the amount of annual rainfall needed to support a maize crop. This study highlights the timing of a drought during the growing season is more important than the annual rainfall received, but this could be confounded by the large variability in the spatial analysis of the results. Droughts in the first three months have a large negative impact on the yield. In conclusion, this study provides evidence that the RDI could be a valuable tool for providing information for maize production to minimize risk.

Author Contributions

The research conceptualization, methodology, formal analysis and original draft preparation was done by H.B.A. The validation was conducted by S.W.N. The editing was conducted by M.C.S. and S.W.N.; supervision, M.C.S. and S.W.N.; funding acquisition M.C.S. All authors have read and agreed to the published version of the manuscript.

Funding

This research was funded by South African National Research Fund (NRF) through the DSI/NRF Research Chairs programme.

Acknowledgments

We want to acknowledge the South African Weather Service and the Agricultural Research Council for providing us with climate data and Grains SA for the yield data.

Conflicts of Interest

The authors declare no conflict of interest.

References

  1. Deo, R.C.; Byun, H.-R.; Adamowski, J.F.; Begum, K. Application of effective drought index for quantification of meteorological drought events: A case study in Australia. Theor. Appl. Clim. 2016, 128, 359–379. [Google Scholar] [CrossRef]
  2. Latif, Y.; YaoMing, M.; Yaseen, M. Spatial analysis of precipitation time series over the Upper Indus Basin. Theor. Appl. Clim. 2016, 131, 761–775. [Google Scholar] [CrossRef] [Green Version]
  3. Tirivarombo, S.; Osupile, D.; Eliasson, P. Drought monitoring and analysis: Standardised Precipitation Evapotranspiration Index (SPEI) and Standardised Precipitation Index (SPI). Phys. Chem. Earth Parts A/B/C 2018, 106, 1–10. [Google Scholar] [CrossRef]
  4. Heim, R.R., Jr. A review of twentieth-century drought indices used in the United States. Bull. Am. Meteorol. Soc. 2002, 83, 1149–1165. [Google Scholar] [CrossRef] [Green Version]
  5. Blum, A. Drought resistance, water-use efficiency, and yield potential—Are they compatible, dissonant, or mutually exclusive? Aust. J. Agric. Res. 2005, 56, 1159–1168. [Google Scholar] [CrossRef]
  6. Mishra, A.K.; Singh, V.P. A review of drought concepts. J. Hydrol. 2010, 391, 202–216. [Google Scholar] [CrossRef]
  7. Wilhite, D.A. Drought as a Natural Hazard: Concepts and Definitions; Routledge: London, UK, 2000. [Google Scholar]
  8. Altieri, M.A. Agroecology: The Science of Sustainable Agriculture; CRC Press: Cleveland, OH, USA, 2018. [Google Scholar]
  9. Wang, Y.; Chen, X.; Chen, Y.; Liu, M.; Gao, L. Flood/drought event identification using an effective indicator based on the correlations between multiple time scales of the Standardized Precipitation Index and river discharge. Theor. Appl. Clim. 2015, 128, 159–168. [Google Scholar] [CrossRef]
  10. Siegmund-Schultze, M.; Köppel, J.; Sobral, M.D.C. Unraveling the water and land nexus through inter- and transdisciplinary research: Sustainable land management in a semi-arid watershed in Brazil’s Northeast. Reg. Environ. Chang. 2018, 18, 2005–2017. [Google Scholar] [CrossRef]
  11. Masupha, T.; Moeletsi, M.E. Analysis of potential future droughts limiting maize production, in the Luvuvhu River catchment area, South Africa. Phys. Chem. Earth Parts A/B/C 2018, 105, 44–51. [Google Scholar] [CrossRef]
  12. Edreira, J.I.R.; Guilpart, N.; Sadras, V.; Cassman, K.G.; Van Ittersum, M.K.; Schils, R.L.; Grassini, P. Water productivity of rainfed maize and wheat: A local to global perspective. Agric. For. Meteorol. 2018, 259, 364–373. [Google Scholar] [CrossRef]
  13. Kumar, M.N.; Murthy, C.S.; Sai, M.V.R.S.; Roy, P.S. On the use of Standardized Precipitation Index (SPI) for drought intensity assessment. Meteorol. Appl. 2009, 16, 381–389. [Google Scholar] [CrossRef] [Green Version]
  14. Jain, M.; Kataria, S.; Hirve, M.; Prajapati, R. Water Deficit Stress Effects and Responses in Maize. Plant Abiotic Stress Tolerance; Springer: Berlin/Heidelberg, Germany, 2019; pp. 129–151. [Google Scholar]
  15. Haro-Monteagudo, D.; Daccache, A.; Knox, J.W. Exploring the utility of drought indicators to assess climate risks to agricultural productivity in a humid climate. Hydrol. Res. 2017, 49, 539–551. [Google Scholar] [CrossRef]
  16. Peña-Gallardo, M.; Vicente-Serrano, S.M.; Domínguez-Castro, F.; Quiring, S.; Svoboda, M.; Beguería, S.; Hannaford, J. Effectiveness of drought indices in identifying impacts on major crops across the USA. Clim. Res. 2018, 75, 221–240. [Google Scholar] [CrossRef] [Green Version]
  17. Tian, L.; Yuan, S.; Quiring, S.M. Evaluation of six indices for monitoring agricultural drought in the south-central United States. Agric. For. Meteorol. 2018, 249, 107–119. [Google Scholar] [CrossRef]
  18. Zormand, S.; Jafari, R.; Koupaei, S.S. Assessment of PDI, MPDI and TVDI drought indices derived from MODIS Aqua/Terra Level 1B data in natural lands. Nat. Hazards 2016, 86, 757–777. [Google Scholar] [CrossRef]
  19. Olaleye, O.L. Drought Coping Mechanisms: A Case Study of Small Scale Farmers in Motheo District of the Free State Province. Master’s Thesis, University of South Africa, Pretoria, South Africa, 2010. [Google Scholar]
  20. Mavis, M.; Mukwada, G.; Manatsa, D. Influence of altitude on the spatiotemporal variations of meteorological droughts in mountain regions of the Free State Province, South Africa (1960–2013). Adv. Meteorol. 2018, 2018, 1–11. [Google Scholar] [CrossRef] [Green Version]
  21. Botai, C.M.; Botai, J.O.; Dlamini, L.C.; Zwane, N.S.; Phaduli, E. Characteristics of droughts in South Africa: A case study of free state and north west provinces. Water 2016, 8, 439. [Google Scholar] [CrossRef]
  22. Hayes, M.; Svoboda, M.; Wall, N.; Widhalm, M. The Lincoln declaration on drought indices: Universal meteorological drought index recommended. Bull. Am. Meteorol. Soc. 2011, 92, 485–488. [Google Scholar] [CrossRef] [Green Version]
  23. Farahmand, A.; AghaKouchak, A. A generalized framework for deriving nonparametric standardized drought indicators. Adv. Water Resour. 2015, 76, 140–145. [Google Scholar] [CrossRef]
  24. Gao, F.; Zhang, Y.; Ren, X.; Yao, Y.; Hao, Z.; Cai, W. Evaluation of CHIRPS and its application for drought monitoring over the Haihe River Basin, China. Nat. Hazards 2018, 92, 155–172. [Google Scholar] [CrossRef]
  25. Hao, Z.; Singh, V.P. Drought characterization from a multivariate perspective: A review. J. Hydrol. 2015, 527, 668–678. [Google Scholar] [CrossRef]
  26. Yuan, W.; Cai, W.; Chen, Y.; Liu, S.; Dong, W.; Zhang, H.; Yu, G.; Chen, Z.; He, H.; Guo, W.; et al. Severe summer heatwave and drought strongly reduced carbon uptake in Southern China. Sci. Rep. 2016, 6, 18813. [Google Scholar] [CrossRef] [PubMed] [Green Version]
  27. Tsakiris, G.; Vangelis, H. Establishing a drought index incorporating evapotranspiration. Eur. Water 2005, 9, 3–11. [Google Scholar]
  28. Tigkas, D.; Vangelis, H.; Tsakiris, G. An enhanced effective reconnaissance drought index for the characterisation of agricultural drought. Environ. Process. 2017, 4, 137–148. [Google Scholar] [CrossRef]
  29. Tigkas, D.; Vangelis, H.; Tsakiris, G. Introducing a modified Reconnaissance Drought Index (RDIe) incorporating effective precipitation. Procedia Eng. 2016, 162, 332–339. [Google Scholar] [CrossRef] [Green Version]
  30. Merabti, A.; Meddi, M.; Martins, D.S.; Pereira, L.S. Comparing SPI and RDI applied at local scale as influenced by climate. Water Resour. Manag. 2017, 32, 1071–1085. [Google Scholar] [CrossRef]
  31. Ikegwuoha, D.C.; Dinka, M.O. Drought prediction in the Lepelle River basin, South Africa under general circulation model simulations. J. Water Land Dev. 2020, 45, 42–53. [Google Scholar]
  32. Moeletsi, M.E.; Walker, S. A simple agroclimatic index to delineate suitable growing areas for rainfed maize production in the Free State Province of South Africa. Agric. For. Meteorol. 2012, 162, 63–70. [Google Scholar] [CrossRef]
  33. Beletse, Y.G.; Durand, W.; Nhemachena, C.; Crespo, O.; Tesfuhuney, W.A.; Jones, M.R.; Teweldemedhin, M.Y.; Gamedze, S.M.; Bonolo, P.M.; Jonas, S.; et al. Projected impacts of climate change scenarios on the production of maize in Southern Africa: An integrated assessment case study of the Bethlehem District, Central Free State, South Africa. In Handbook of Climate Change and Agroecosystems: The Agricultural Model Intercomparison and Improvement Project Integrated Crop and Economic Assessments; World Scientific Pub Co Pte Lt: London, UK, 2015; Volume 4, pp. 125–157. [Google Scholar]
  34. Hall, R. The next Great Trek? South African commercial farmers move north. In The New Enclosures: Critical Perspectives on Corporate Land Deals; Routledge: Abingdon, UK, 2013; pp. 217–238. [Google Scholar]
  35. Moeletsi, M.; Walker, S. Rainy season characteristics of the Free State Province of South Africa with reference to rain-fed maize production. Water SA 2012, 38, 775–782. [Google Scholar] [CrossRef] [Green Version]
  36. Tigkas, D.; Vangelis, H.; Tsakiris, G. DrinC: A software for drought analysis based on drought indices. Earth Sci. Inform. 2014, 8, 697–709. [Google Scholar] [CrossRef]
  37. Tsakiris, G.; Nalbantis, I.; Pangalou, D.; Tigkas, D.; Vangelis, H. Drought meteorological monitoring network design for the reconnaissance drought index (RDI). In Proceedings of the 1st International Conference “Drought Management: Scientific and Technological Innovations”, Zaragoza, Spain, 12–14 June 2008. option Méditerranéennes, series A. [Google Scholar]
  38. Hina, S.; Saleem, F. Historical analysis (1981–2017) of drought severity and magnitude over a predominantly arid region of Pakistan. Clim. Res. 2019, 78, 189–204. [Google Scholar] [CrossRef]
  39. Xu, K.; Yang, D.; Yang, H.; Li, Z.; Qin, Y.; Shen, Y. Spatio-temporal variation of drought in China during 1961–2012: A climatic perspective. J. Hydrol. 2015, 526, 253–264. [Google Scholar] [CrossRef]
  40. Zarch, M.A.A.; Malekinezhad, H.; Mobin, M.; Dastorani, M.T.; Kousari, M.R. Drought monitoring by Reconnaissance Drought Index (RDI) in Iran. Water Resour. Manag. 2011, 25, 3485–3504. [Google Scholar] [CrossRef] [Green Version]
  41. Moeletsi, M.E. Agroclimatological Risk Assessment of Rainfed Maize Production for the Free State Province of South Africa. Ph.D. Thesis, University of the Free State, Bloemfontein, South Africa, 2010. [Google Scholar]
  42. Garg, V.; Eslamian, S.; Cox, J.P.; Karimi, S.S.; Eslamian, F. Monitoring, assessment, and forecasting of drought using remote sensing and the geographical information system. In Handbook of Drought and Water Scarcity: Principles of Drought and Water Scarcity; CRS Press: Cleveland, OH, USA, 2017; Volume 1, pp. 217–252. [Google Scholar]
  43. Valverde-Arias, O.; Garrido, A.; Valencia, J.L.; Tarquis, A.M. Using geographical information system to generate a drought risk map for rice cultivation: Case study in Babahoyo canton (Ecuador). Biosyst. Eng. 2018, 168, 26–41. [Google Scholar] [CrossRef]
  44. Vangelis, H.; Tigkas, D.; Tsakiris, G. The effect of PET method on Reconnaissance Drought Index (RDI) calculation. J. Arid. Environ. 2013, 88, 130–140. [Google Scholar] [CrossRef]
  45. Khan, M.I.; Liu, D.; Fu, Q.; Saddique, Q.; Faiz, M.A.; Li, T.; Qamar, M.U.; Cui, S.; Cheng, C. Projected changes of future extreme drought events under numerous drought indices in the Heilongjiang Province of China. Water Resour. Manag. 2017, 31, 3921–3937. [Google Scholar] [CrossRef]
  46. Arora, H.; Ojha, C.S.P.; Chandniha, S.K. Assessment of water sustainability through reliability-resilience-vulnerability concept using reconnaissance drought index. Sustain. Water Resour. Manag. 2017, 2017, 969–999. [Google Scholar] [CrossRef]
  47. Khajeh, S.E.; Negahban, F.; Dinpashoh, Y. Comparing Univariate and multivariate indices in drought monitoring. J. Water Soil Sci. 2019, 23, 433–446. [Google Scholar] [CrossRef] [Green Version]
  48. Cai, W.; Zhang, Y.; Chen, Q.; Yao, Y. Spatial patterns and temporal variability of drought in Beijing-Tianjin-Hebei Metropolitan Areas in China. Adv. Meteorol. 2015, 2015, 1–14. [Google Scholar] [CrossRef]
  49. Angelidis, P.; Maris, F.; Kotsovinos, N.; Hrissanthou, V. Computation of drought index SPI with alternative distribution functions. Water Resour. Manag. 2012, 26, 2453–2473. [Google Scholar] [CrossRef]
  50. Beguería, S.; Vicente-Serrano, S.M.; Reig, F.; Latorre, B. Standardized precipitation evapotranspiration index (SPEI) revisited: Parameter fitting, evapotranspiration models, tools, datasets and drought monitoring. Int. J. Clim. 2013, 34, 3001–3023. [Google Scholar] [CrossRef] [Green Version]
  51. Fang, W.; Imura, H. Comparison of empirical pet estimation methods in the Yellow River Basin. Environ. Syst. Res. 2003, 31, 217–225. [Google Scholar] [CrossRef] [Green Version]
  52. Lang, D.; Zheng, J.; Shi, J.; Liao, F.; Ma, X.; Wang, W.; Chen, X.; Hou, Y. A comparative study of potential evapotranspiration estimation by eight methods with FAO Penman–Monteith method in Southwestern China. Water 2017, 9, 734. [Google Scholar] [CrossRef] [Green Version]
  53. Zarch, M.A.A.; Sivakumar, B.; Malekinezhad, H.; Sharma, A. Future aridity under conditions of global climate change. J. Hydrol. 2017, 554, 451–469. [Google Scholar] [CrossRef]
  54. Gocic, M.; Trajkovic, S. Analysis of changes in meteorological variables using Mann-Kendall and Sen’s slope estimator statistical tests in Serbia. Glob. Planet. Chang. 2013, 100, 172–182. [Google Scholar] [CrossRef]
  55. Duhan, D.; Pandey, A. Statistical analysis of long term spatial and temporal trends of precipitation during 1901–2002 at Madhya Pradesh, India. Atmos. Res. 2013, 122, 136–149. [Google Scholar] [CrossRef]
  56. Kousari, M.R.; Dastorani, M.T.; Niazi, Y.; Soheili, E.; Hayatzadeh, M.; Chezgi, J. Trend detection of drought in arid and semi-arid regions of Iran based on implementation of Reconnaissance Drought Index (RDI) and application of non-parametrical statistical method. Water Resour. Manag. 2014, 28, 1857–1872. [Google Scholar] [CrossRef]
  57. Bandyopadhyay, N.; Bhuiyan, C.; Saha, A.K. Heat waves, temperature extremes and their impacts on monsoon rainfall and meteorological drought in Gujarat, India. Nat. Hazards 2016, 82, 367–388. [Google Scholar] [CrossRef]
  58. Ewert, F.; Rötter, R.P.; Bindi, M.; Webber, H.; Trnka, M.; Kersebaum, K.C.; Olesen, J.E.; Van Ittersum, M.K.; Janssen, S.; Rivington, M.; et al. Crop modelling for integrated assessment of risk to food production from climate change. Environ. Model. Softw. 2015, 72, 287–303. [Google Scholar] [CrossRef]
  59. Mahony, M.; Hulme, M. Modelling and the Nation: Institutionalising climate prediction in the UK, 1988–1992. Minerva 2016, 54, 445–470. [Google Scholar] [CrossRef] [Green Version]
  60. Pablos, M.; Martínez-Fernández, J.; Sánchez, N.; González-Zamora, Á. Temporal and spatial comparison of agricultural drought indices from moderate resolution satellite soil moisture data over Northwest Spain. Remote Sens. 2017, 9, 1168. [Google Scholar] [CrossRef] [Green Version]
  61. Yacoub, E.; Tayfur, G. Spatial and temporal of variation of meteorological drought and precipitation trend analysis over whole Mauritania. J. Afr. Earth Sci. 2020, 163, 103761. [Google Scholar] [CrossRef]
  62. Joo, E.; Hussain, M.Z.; Zeri, M.; Masters, M.D.; Miller, J.N.; Gomez-Casanovas, N.; DeLucia, E.H.; Bernacchi, C.J. The influence of drought and heat stress on long-term carbon fluxes of bioenergy crops grown in the Midwestern USA. Plant Cell Environ. 2016, 39, 1928–1940. [Google Scholar] [CrossRef] [PubMed]
  63. Snider, J.L.; Davis, R.; Earl, H.J.; Timper, P. Water availability and root-knot nematode management alter seedcotton yield through similar effects on fruit distribution patterns. Field Crop. Res. 2019, 233, 88–95. [Google Scholar] [CrossRef]
  64. Ben Abdelmalek, M.; Nouiri, I. Study of trends and mapping of drought events in Tunisia and their impacts on agricultural production. Sci. Total Environ. 2020, 734, 139311. [Google Scholar] [CrossRef] [PubMed]
  65. Cavus, Y.; Aksoy, H. Spatial drought characterization for Seyhan River Basin in the Mediterranean Region of Turkey. Water 2019, 11, 1331. [Google Scholar] [CrossRef] [Green Version]
  66. Mishra, A.; Desai, V. Spatial and temporal drought analysis in the Kansabati river basin, India. Int. J. River Basin Manag. 2005, 3, 31–41. [Google Scholar] [CrossRef]
  67. Amini, M.A.; Torkan, G.; Eslamian, S.; Zareian, M.J.; Adamowski, J. Correction to: Analysis of deterministic and geostatistical interpolation techniques for mapping meteorological variables at large watershed scales. Acta Geophys. 2019, 67, 275. [Google Scholar] [CrossRef] [Green Version]
  68. Verma, P.A.; Shankar, H.; Saran, S. Comparison of geostatistical and deterministic interpolation to derive climatic surfaces for mountain ecosystem. In Remote Sensing of Northwest Himalayan Ecosystems; Springer: Berlin/Heidelberg, Germany, 2019; pp. 537–547. [Google Scholar]
  69. Botai, J.O.; Botai, C.M.; De Wit, J.; Muthoni, M.; Adeola, A.M. Analysis of drought progression physiognomies in South Africa. Water 2019, 11, 299. [Google Scholar] [CrossRef] [Green Version]
  70. Muyambo, F.; Jordaan, A.J.; Bahta, Y. Assessing social vulnerability to drought in South Africa: Policy implication for drought risk reduction. Jàmbá J. Disaster Risk Stud. 2017, 9. [Google Scholar] [CrossRef]
  71. Li, X.; Sha, J.; Wang, Z.-L. Comparison of drought indices in the analysis of spatial and temporal changes of climatic drought events in a basin. Environ. Sci. Pollut. Res. 2019, 26, 10695–10707. [Google Scholar] [CrossRef]
  72. Zhang, Q.; Qi, T.; Singh, V.P.; Chen, Y.D.; Xiao, M. Regional frequency analysis of droughts in China: A multivariate perspective. Water Resour. Manag. 2015, 29, 1767–1787. [Google Scholar] [CrossRef]
  73. Zarch, M.A.A.; Sivakumar, B.; Sharma, A. Droughts in a warming climate: A global assessment of Standardized precipitation index (SPI) and Reconnaissance drought index (RDI). J. Hydrol. 2015, 526, 183–195. [Google Scholar] [CrossRef]
  74. Araujo, J.A.; Abiodun, B.J.; Crespo, O. Impacts of drought on grape yields in Western Cape, South Africa. Theor. Appl. Clim. 2014, 123, 117–130. [Google Scholar] [CrossRef]
  75. Lyon, B. Southern Africa summer drought and heat waves: Observations and coupled model behavior. J. Clim. 2009, 22, 6033–6046. [Google Scholar] [CrossRef]
  76. Masupha, E.T. Drought Analysis with Reference to Rain-Fed Maize for Past and Future Climate Conditions over the Luvuvhu River Catchment in South Africa. 2017. Available online: http://uir.unisa.ac.za/handle/10500/23197 (accessed on 23 July 2020).
  77. Thomas, D.S.; Twyman, C.; Osbahr, H.; Hewitson, B. Adaptation to climate change and variability: Farmer responses to intra-seasonal precipitation trends in South Africa. Clim. Chang. 2007, 83, 301–322. [Google Scholar] [CrossRef]
  78. Botai, C.M.; Botai, J.O.; De Wit, J.; Ncongwane, K.P.; Adeola, A.M. Drought characteristics over the Western Cape Province, South Africa. Water 2017, 9, 876. [Google Scholar] [CrossRef] [Green Version]
  79. Nicholson, S.E. Climate and climatic variability of rainfall over eastern Africa. Rev. Geophys. 2017, 55, 590–635. [Google Scholar] [CrossRef] [Green Version]
  80. Dube, K.; Nhamo, G. Evidence and impact of climate change on South African national parks. Potential implications for tourism in the Kruger National Park. Environ. Dev. 2020, 33, 100485. [Google Scholar] [CrossRef]
  81. Ndebele, N.E.; Grab, S.; Turasie, A. Characterizing rainfall in the south-western Cape, South Africa: 1841–2016. Int. J. Clim. 2019, 40, 1992–2014. [Google Scholar] [CrossRef]
  82. Riebsame, W.E.; Changnon, S.A.; Karl, T.R. Drought and Natural Resources Management in the United States: Impacts and Implications of the 1987–1989 Drought; Routledge: Abingdon, UK, 2019. [Google Scholar]
  83. Mohammad, A.H.; Jung, H.C.; Odeh, T.; Bhuiyan, C.; Hussein, H. Understanding the impact of droughts in the Yarmouk Basin, Jordan: Monitoring droughts through meteorological and hydrological drought indices. Arab. J. Geosci. 2018, 11, 103. [Google Scholar] [CrossRef] [Green Version]
  84. Gizaw, M.S.; Gan, T.Y. Impact of climate change and El Niño episodes on droughts in sub-Saharan Africa. Clim. Dyn. 2016, 49, 665–682. [Google Scholar] [CrossRef]
  85. Dunkerley, D. How is the intensity of rainfall events best characterised? A brief critical review and proposed new rainfall intensity index for application in the study of landsurface processes. Water 2020, 12, 929. [Google Scholar] [CrossRef] [Green Version]
  86. Dunkerley, D. Sub-daily rainfall intensity extremes: Evaluating suitable indices at australian arid and wet tropical observing sites. Water 2019, 11, 2616. [Google Scholar] [CrossRef] [Green Version]
Figure 1. The study area and spatial distribution of the four weather stations in the Setsoto municipality of the Free State province of South Africa.
Water 12 02993 g001
Figure 2. RDI-3 (black trendline) Setsoto municipality drought index (OND) and maize yield (blue trendline) for the period between 1985 and 2019.
Water 12 02993 g002
Figure 3. RDI-6 (black trendline) Setsoto municipality drought index (OND) and maize yield (blue trendline) for the period between 1985 and 2019.
Water 12 02993 g003
Figure 4. RDI-12 (black trendline) Setsoto municipality drought index (OND) and maize yield (blue trendline) for the period between 1985 and 2019.
Water 12 02993 g004
Figure 5. RDI-3 spatial-temporal patterns of drought in Setsoto municipality (1985–2019) based on RDI values.
Water 12 02993 g005
Figure 6. RDI-6 spatial-temporal pattern of drought in Setsoto municipality (1985–2019) based on RDI values.
Water 12 02993 g006
Figure 7. RDI-12 spatial-temporal pattern of drought in Setsoto municipality (1985–2019).
Water 12 02993 g007
Table 1. The seasonal (October–March) rainfall characteristics of the Setsoto municipality between 1985 and 2019 across the stations.
Weather StationsRainfall (mm)Yield (tons ha−1 year−1)
MeanSTDCV (%)MeanSTD
Clocolan677.1149.4222.801.05
Ficksburg718.1168.8242.861.31
Marquard613.4178.2252.360.96
Senekal645.0167.4232.190.92
STD = standard deviation, CV = coefficient of variation.
Table 2. The RDI (reconnaissance drought index) trends for different time scale for the Setsoto municipality from 1985 to 2019. Mann Kendal trend (Test Z) and Sen’s slope estimate (Q).
Weather StationsMk (Test Z)Sen’s Slope Estimate (Q)
RDI-12RDI-6RDI-3RDI-12RDI-6RDI-3
Clocolan−1.11−0.48−0.340.02−0.010.00
Ficksburg−1.51−0.68−0.850.02−0.01−0.01
Marquard−1.96 *−1.73 *−0.62−0.03 *−0.03 *−0.01
Senekal−0.85−0.45−0.91−0.01−0.01−0.01
NB: * denote significance when alpha = 0.05. RDI-12: 12 month RDI; RDI-6: 6 month RDI; RDI-3: 3 month RDI.
Publisher’s Note: MDPI stays neutral with regard to jurisdictional claims in published maps and institutional affiliations.

