Article

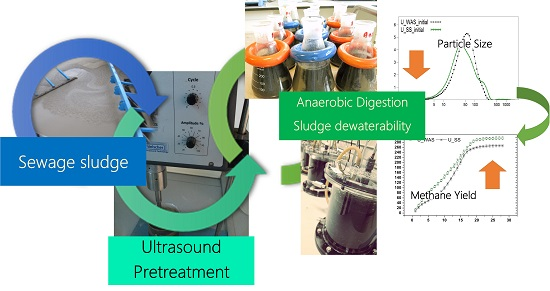
Effect of Ultrasound Pretreatment on Sludge Digestion and Dewatering Characteristics: Application of Particle Size Analysis

Chemical and Environmental Bioprocess Engineering Department, Natural Resources Institute (IRENA), University of Leon, Av. de Portugal 41, Leon 24009, Spain
*
Author to whom correspondence should be addressed.
Submission received: 26 August 2015 / Revised: 23 October 2015 / Accepted: 9 November 2015 / Published: 13 November 2015

Abstract

:
The aim of this work was to study the effect of ultrasonic pretreatment on sludge digestion, particle size distribution (PSD), and dewaterability of digestates (measured by capillary suction time (CST) and specific resistance to filtration (SRF)). Sludge was pretreated with ultrasound (24 kHz) at an energy dosage of 4300 kJ/kg TS. Digestibility of sludge was increased by ultrasound pretreatment resulting in a higher specific methane production (SMP). The digestate of pretreated waste activated sludge (WAS) obtained under batch conditions presented a better dewatering performance. Digestion under semi-continuous conditions was evaluated using sewage sludge (mixture of primary sludge and WAS). In this case, digestates presented a much higher mean particle size for both cases evaluated (pretreated and non-pretreated) than that obtained under batch conditions. A wide PSD was a characteristic of these digestate samples. Flow dynamics inside the reactor resulted in the presence of high-diameter flocs, thus significantly affecting the mean particle size and specific surface area (SSA) values.

Graphical Abstract

1. Introduction

The management of sewage sludge in wastewater treatment plants (WWTPs) is currently an issue of great concern. The treatment and disposal of sludge may represent up to 50% of plant operating costs. Anaerobic digestion (AD) is a well-known technique that is used for the valorization of sludge. This process is usually the preferred stabilization method due to low operating costs and biogas production. In addition, sludge dewatering, which is highly affected by the treatment option of sludge, is also an important issue for decreasing sludge volume and, consequently, reducing the operating cost in WWTPs. Dewatering is a difficult and costly process in wastewater treatment. The process is mainly carried out by physical separation, and presents a variable efficiency based on the nature of the sludge. Even though anaerobic digestion has many advantages, it may adversely affect sludge dewaterability [1].
Anaerobic digesters in WWTPs generally treat a mixture of primary and secondary (waste-activated) sludge. However, waste activated sludge (WAS) is known to be more difficult to digest than primary sludge (PS) [2]. It has been reported that hydrolysis is the rate-limiting step in anaerobic digestion [3,4]. Extracellular polymeric substances (EPS) and microbial cells are recalcitrant to direct hydrolysis, and therefore, the pretreatment of sludge is required to rupture the cell walls, to facilitate the release of intracellular material into the aqueous phase and accelerate the low rate of biodegradation, and to enhance anaerobic digestion [5].
Different pretreatment methods have been studied to improve the anaerobic degradability of sewage sludge including thermal hydrolysis, ozone oxidation, alkaline hydrolysis, and ultrasound [6,7,8,9]. Among these, ultrasonication is a well-known method to break-up microbial cells and to extract intracellular material [10]. Several authors have reported an increase in biogas production when applying this type of pretreatment [5,7,11]. The impact of ultrasound waves on a liquid causes the periodical compression and rarefaction of the medium [10]. The result of the mechanical phenomenon on sludge depends on the duration and power applied during the pretreatment, which equates to the specific energy [12]. Other effects of ultrasonic energy application include acoustic streaming, local heating, interface instabilities, agitation, and cavitation. These combined effects facilitate the migration of moisture through natural channels or through those created by wave propagation. This effect could be useful in dewatering suspensions with a high concentration of fine particles such as slurries and sludge [13]. Feng and co-workers [14] associated low-frequency ultrasounds with the ability of sludge particles to aggregate, thereby making dewatering easier.
The size of particles comprising the sludge has a great influence on its degradability and dewaterability. In addition, rheological properties of sludge may be related to the treatment process it has undergone. In this sense, the course of digestion may affect the physical properties of sludge and, in turn, the distribution of particle size may be used to predict the state of a digestion process. This study was conducted to investigate the effect of ultrasound pretreatment of sewage sludge during digestion on methane production and dewatering parameters. Particle size analysis was used to evaluate changes in the particle size distribution (PSD) at different stages of digestion.

2. Materials and Methods

2.1. Substrates and Digestion Tests

WAS, PS, and digested sludge were obtained from the WWTP of the city of Cáceres. Digested sludge was used as the inoculum. This sludge had a total solid (TS) content of 9.4 g/L and a volatile solid (VS) concentration of 7.4 g/L. WAS and sewage sludge (SS—a mixture of PS and WAS at 30:70 v/v) were used as feed. The substrates and inoculum were concentrated to a solid content between 40 and 50 g TS/L by centrifugation. Table 1 shows the main characteristics of the substrates used.
Table 1. Substrate characterisation.
ParameterInoculumPSWASSS
TS (g/L)9.4 ± 0.213.7 ± 0.520.3 ± 0.819.0 ± 0.6
VS (g/L)7.4 ± 0.29.78 ± 0.315.6 ± 0.614.4 ± 0.5
pH7.2 ± 0.17.6 ± 0.16.4 ± 0.16.7 ± 0.1
O.M. (a) (%)0.57 ± 0.020.76 ± 0.091.37 ± 0.401.1 ± 0.06
KN (b) (%)0.05 ± 0.010.06 ± 0.020.24 ± 0.040.17 ± 0.01
NH4+ (mg/L)276 ± 8.2874 ± 42241 ± 16400 ± 25
C/N6.6 ± 0.36.4 ± 0.23.2 ± 0.24.0 ± 0.2
Notes: (a) O.M.: Organic Matter; (b) KN: Kjeldahl Nitrogen.
The biochemical methane potential (BMP) of substrates was determined using batch reactors (250 mL Erlenmeyer flasks) at 35 ± 1 °C, and agitation was provided by means of magnetic stirrers. Reactors were filled with inoculum and substrate at a VS ratio (inoculum/substrate) of 1.5:1. A reactor containing inoculum was used as the blank. Three replicates were used for each BMP test and blank. Digestion systems were denoted in accordance with substrates evaluated (either PS, WAS, or SS). BMP tests were also carried out for ultrasound-pretreated samples of WAS and SS. These tests were denoted as U_WAS and U_SS. The evolution of PSD was also evaluated in batch tests for WAS and U_WAS digestion systems.
A semi-continuous reactor was operated using completely stirred reactors (working volume of 3 L at 35 ± 1 °C). This reactor was evaluated using SS as the substrate at a hydraulic retention time (HRT) of 21 days for a 100-day period. Data selected for evaluating performance were those obtained during the last 40 days of the experiment (organic loading rate (OLR) of 1.8 g VS/L day). Subsequently, pretreated SS was used as the feed. The reactor worked for 100 days. The reactor performance was evaluated at the same OLR using average data obtained during the last 45 days of the experiment. Reactors were denoted R_SS and RU_SS.

2.2. Ultrasound Pretreatment

A UP400S (Dr. Hielscher, Teltow, Germany) ultrasonic processor operating at a nominal power of 300 W and 24 kHz was used. Energy input was 4300 kJ/kg TS based on previous results of Martinez et al. [15] and Feng et al. [14].

2.3. Analytical Techniques

TS, VS, and pH were determined in accordance with American Public Health Association (APHA) Standard Methods [16]. Nitrogen concentration was measured by the Kjeldahl method. Organic matter was analyzed in accordance with the Walkley–Black method. The composition of biogas was regularly monitored during the digestion process and was analyzed as described by Martinez et al. [17], using a gas chromatograph (Varian CP3800 GC) equipped with a thermal conductivity detector. A packed column (HayeSep Q 80/100; 4 m) followed by a molecular-sieve column (1 m) was used to separate CH4, CO2, N2, H2, and O2. The carrier gas was helium, and the columns were operated at a pressure of 331 kPa and a temperature of 50 °C. Volatile fatty acids (VFAs) were measured using the same gas chromatograph with a flame ionization detector (FID) equipped with a Nukol capillary column (30 m × 0.25 mm × 0.25 μm) from Supelco. The carrier gas was helium. The injector and detector temperatures were 220 °C and 250 °C, respectively. The oven temperature was set to 150 °C for 3 min and increased to 180 °C with a ramp of 10 °C/min. The system was calibrated with a mixture of standard volatile acids from Supelco (for the analysis of fatty acids C2 to C7). Samples were previously centrifuged (10 min, 3500× g) and the supernatant was filtered through 0.45 μm cellulose filters.
Capillary suction time (CST) was measured using a 5 mL sample of sludge that was poured into a stainless steel tube (1.0 cm inner diameter) in contact with Whatman No. 17 chromatography-grade paper. CST was defined as the time required for the wetting front to pass from the first radius located at 1.0 cm of the cylindrical reservoir to the second radius at 3.0 cm. Seven replicates were used. The CST values were normalized by dividing them by the TSS concentration and then expressed in units of seconds per liter per gram of total suspended solids (TSS). These values were denoted as CSTs.
Specific resistance to filtration (SRF) was measured using a 9 cm standard Buchner funnel (fitted to a constant vacuum pressure) into which the sludge sample was poured. Filtrate volume and filtration time were recorded. SRF was calculated as the slope of the linear plot of volume vs. time/volume [18]. The water content of the sludge cake trapped by the filter paper was measured in accordance with standard methods [16]. Seven replicates were used.
Free and bound water in sludge was measured using a thickened sludge sample that was centrifuged at 3500 g for 10 min. A subsample was collected for drying at a constant airflow of 300 mL/min at 105 °C [19] using a TA Instruments thermobalance. The water distribution was derived from the curve of drying time vs. water content (mass of water/mass of solids) of the sample. Three replicates were used for obtaining the curve.
Particle size analysis was carried out using a Beckmann Coulter LS 13 320 laser diffraction particle size analyzer. The LS 13 320 is equipped with an optical bench and a universal liquid module to measure the size distribution of particles. The scatter generated by the particles is estimated based on the Fraunhofer optical model. Samples were previously diluted in tap water for analysis. Ten measurements were performed for each sample. Inoculum, substrates, and digestates were analyzed. PSD measurements on samples prior to and after digestion were denoted by adding the term “initial” or “digestate” to the abbreviation, indicating the substrate. The evolution of PSD in batch tests was studied during batch digestion of WAS and U-WAS. Samples were taken at the beginning of the batch experiments (WAS_D0, U_WAS_D0), after 14 days (WAS_D14, U_WAS_D14), and at the end of the batch test (WAS_digested, U_WAS_digested).

3. Results and Discussion

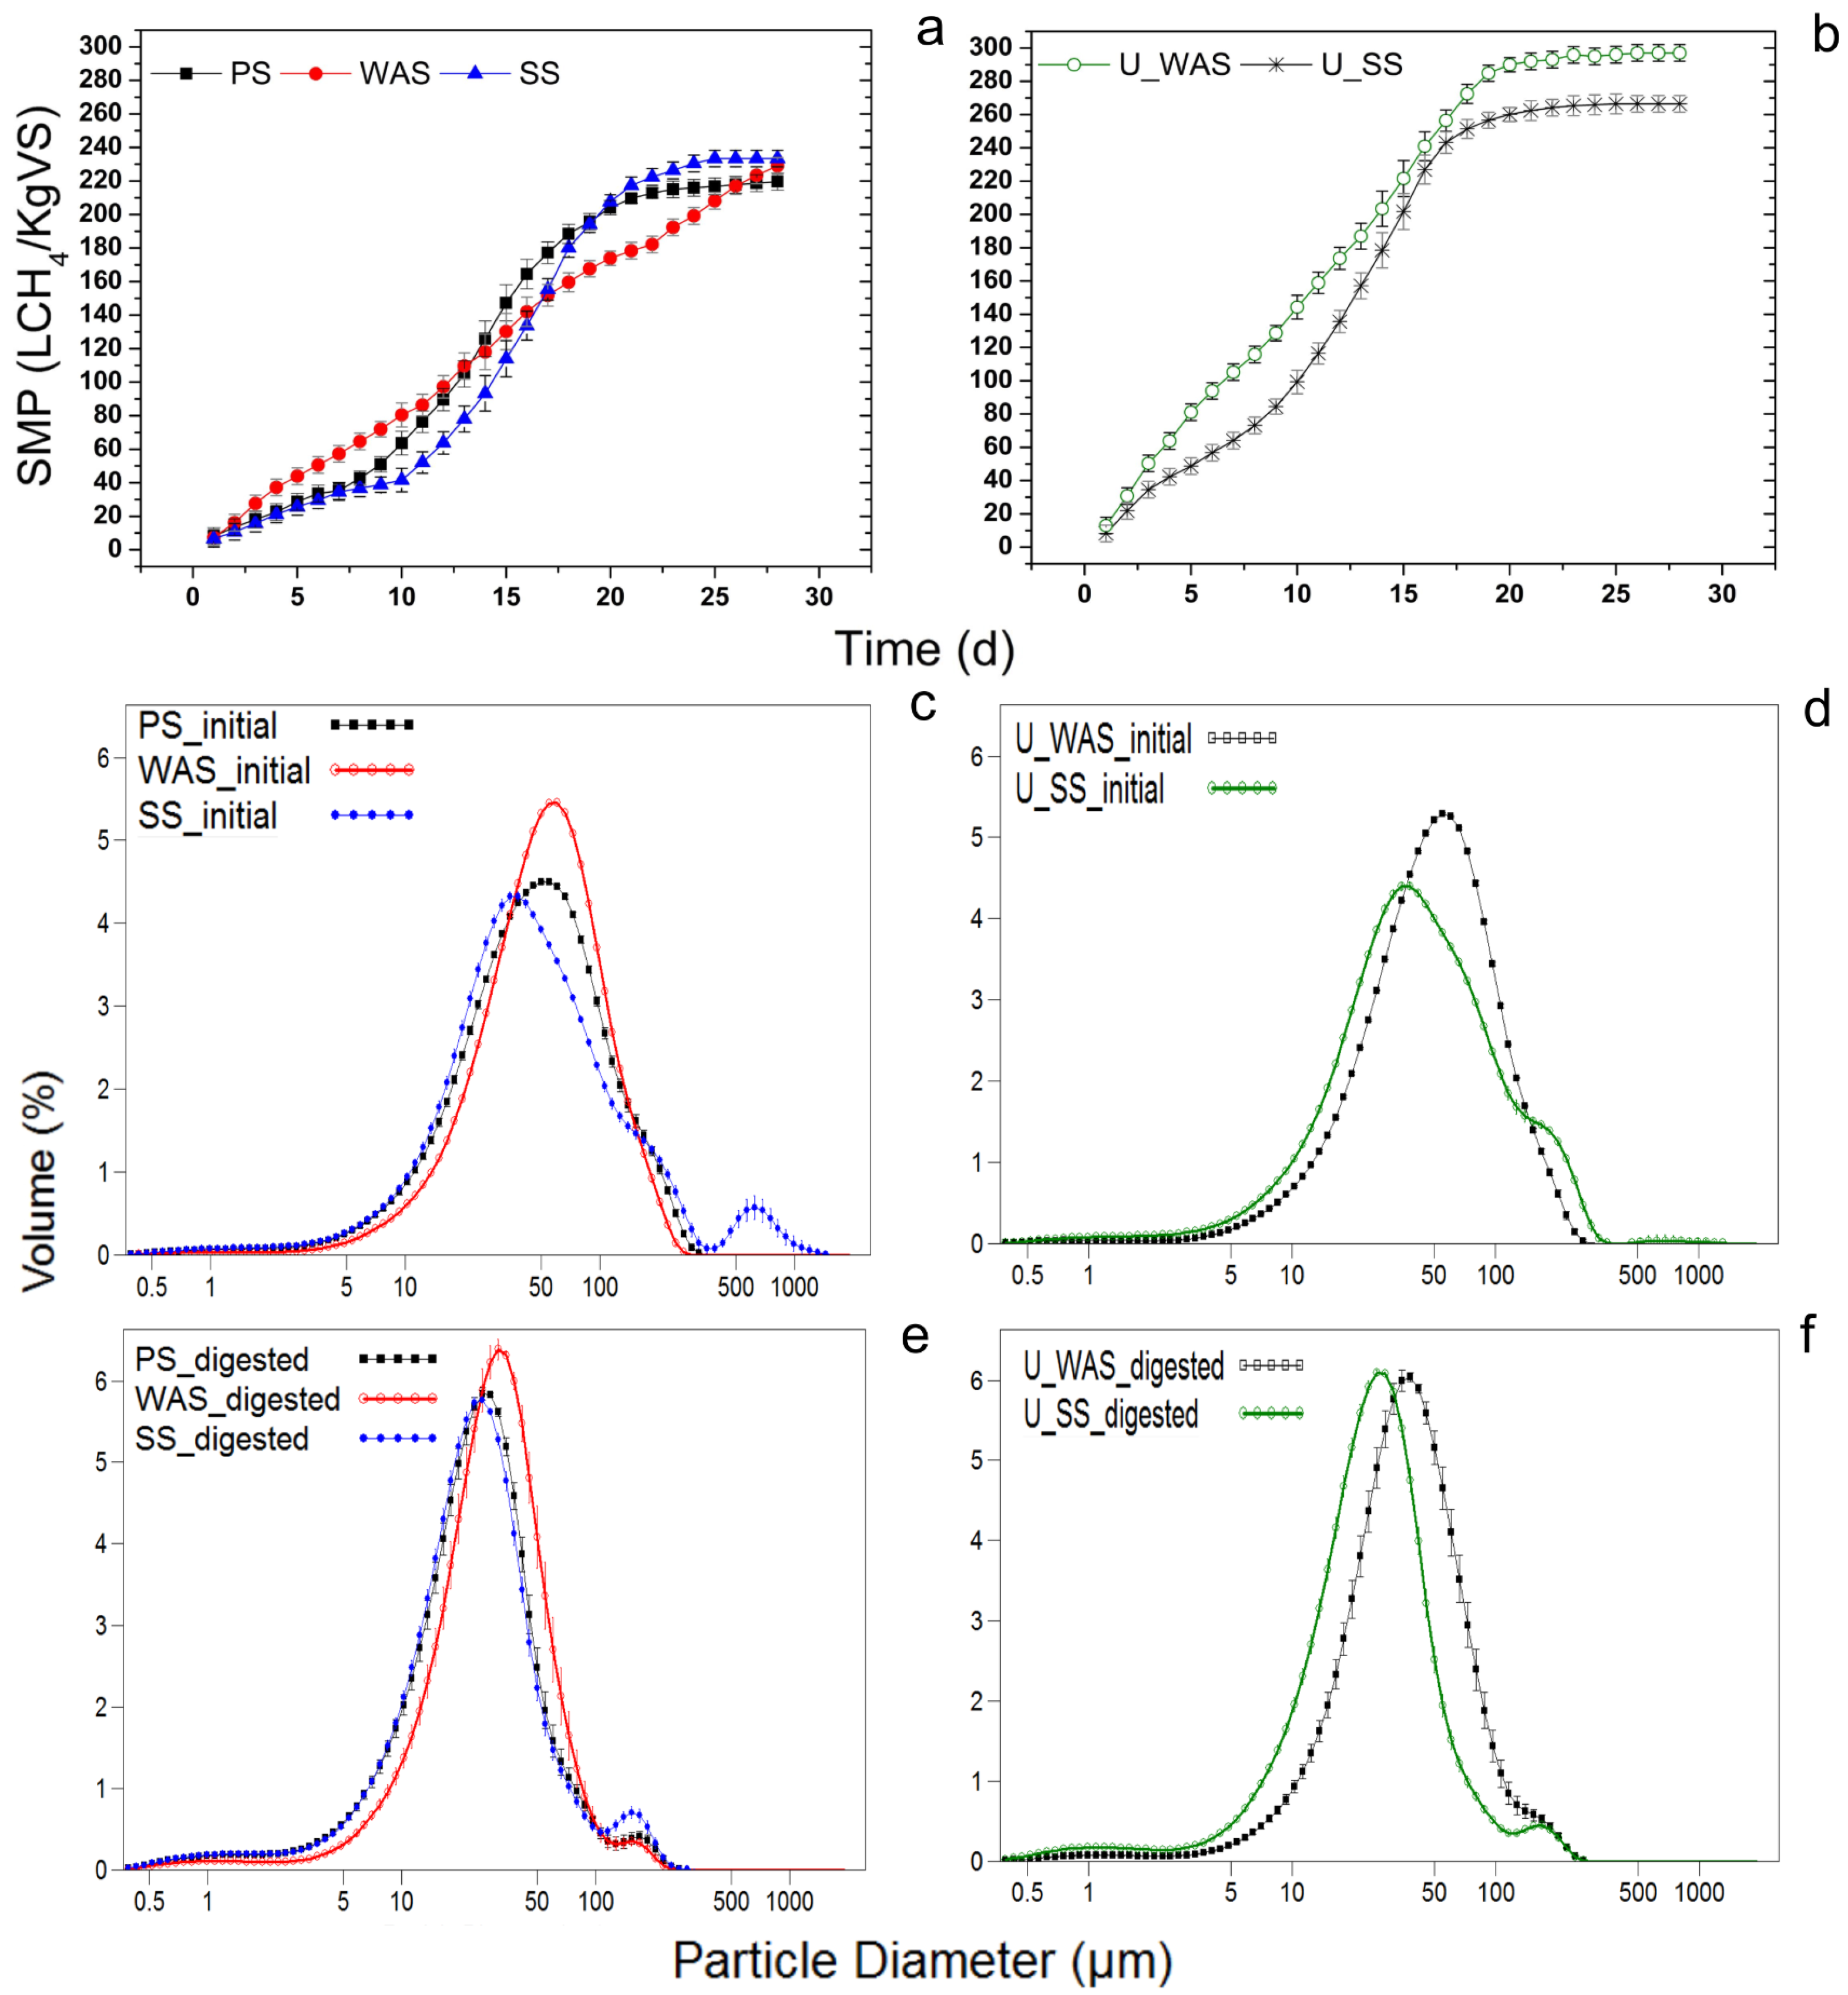
3.1. Effect of Pretreatment on Batch Digestion and Particle Size of the Sludge

Results obtained from the BMP tests are presented in Figure 1a,b for substrates (PS, WAS, and SS) and pretreated samples (U_WAS and U_SS). The benefits of ultrasound pretreatment are indicated by the increase of the cumulative methane production and biogas production rate during the initial stage of the digestion experiments. The values of specific methane production (SMP) obtained were similar for the substrates tested, although a higher value for the PS sample would be expected. In addition, the PS sample presented an initial low rate of gas production during digestion, and this behavior was also observable when digesting the mixture (SS sample). This initial trend may be associated with the presence of complex organic material in the PS, probably due to the proximity of a slaughterhouse to the WWTP.
Figure 1. (a,b) Specific methane production (SMP) obtained from batch tests for samples: primary sludge (PS), waste activated sludge (WAS), sewage sludge (SS), and ultrasound-pretreated samples U_WAS, U_SS; (cf) Particle size distribution (PSD) of samples taken prior to (initial) and after (digested) batch digestion tests.
Water 07 06483 g001
The values of SMP for WAS and SS samples were 229 ± 23 and 233 ± 35 mL CH4/g VS, respectively. This value was increased by 14% when evaluating the U_SS sample, while the increment for U_WAS reached 30%. Tiehm et al. [10] investigated the improvement in anaerobic digestion when WAS was pretreated at an ultrasound frequency range of 41–3217 kHz. These authors reported that sludge disintegration was most significant at low frequencies. Low-frequency ultrasound created large cavitation bubbles, and resulted in sludge floc deagglomeration without the destruction of bacterial cells. Longer sonication brought about the break-up of cell walls, and the sludge solids were disintegrated and then dissolved organic compounds were released. The increase in digestion efficiency obtained in the present study could be explained by the deagglomeration of sludge since the ultrasound frequency applied was in the low range (24 kHz and 4300 kJ/Kg TS of energy input).
Results from the particle size analysis are presented in Figure 1c,d. The inoculum and feedstocks (denoted by adding the term “initial”) presented a main peak at around 3–100 μm for the inoculum and 5–300 μm for the feedstocks. The inoculum and SS sample also showed a pronounced secondary peak for particles of greater size (between 100–300 μm for the inoculum and 400–1000 μm for the SS sample), which may be due to the agglomeration of flocs. The PSD of the three digested samples was similar to a main peak placed in the range of 5–100 μm. The digestion process caused a decrease in the mean particle size of the samples. Although the digested sample is affected by the presence of the inoculum, the material under digestion experiences a reduction in the average size of particles, giving as final result a PSD profile with a narrower base.
On the other hand, the pretreated samples presented a similar distribution (peak at around 5–300 μm) but in this case, the graph corresponding to U_SS did not show the greater size particle peak, indicating that the range of sizes narrowed due to the disintegration of sludge flocs. Table 2 shows the mean particle size and specific surface area (SSA) for all samples studied. A decrease in particle size of pretreated samples (U_WAS, U_SS) was observed, with a 15% and 8% reduction, respectively, when compared with WAS and SS samples. This decrease was related to the increase in the SSA parameter (Table 2) and methane production in batch tests. With regard to digested samples, the PSD presented in Figure 1e,f shows a higher content of smaller particles (in the range 5–100 μm) and less disperse profiles for all samples, resulting in a mean particle size value of less than 40 μm, as shown in Table 2. However, after digestion, the secondary peak (100–300 μm), which was also observed in the inoculum sample, was still present in PSD profiles.
Table 2. Particle size analysis of substrate samples before and after ultrasound pretreatment.
SubstrateInitialDigested
Mean (μm)SSA (cm2/mL)Mean (μm)SSA (cm2/mL)
Inoculum29.5 ± 1.456122 ± 428n/an/a
PS59.9 ± 2.902594 ± 12930.8 ± 1.524904 ± 245
WAS61.0 ± 3.012672 ± 13331.9 ± 1.504993 ± 249
SS65.9 ± 3.252031 ± 10134.8 ± 1.753664 ± 183
U_WAS53.9 ± 2.622941 ± 14731.3 ± 1.504695 ± 234
U_SS60.9 ± 3.032203 ± 11033.8 ± 1.743664 ± 183

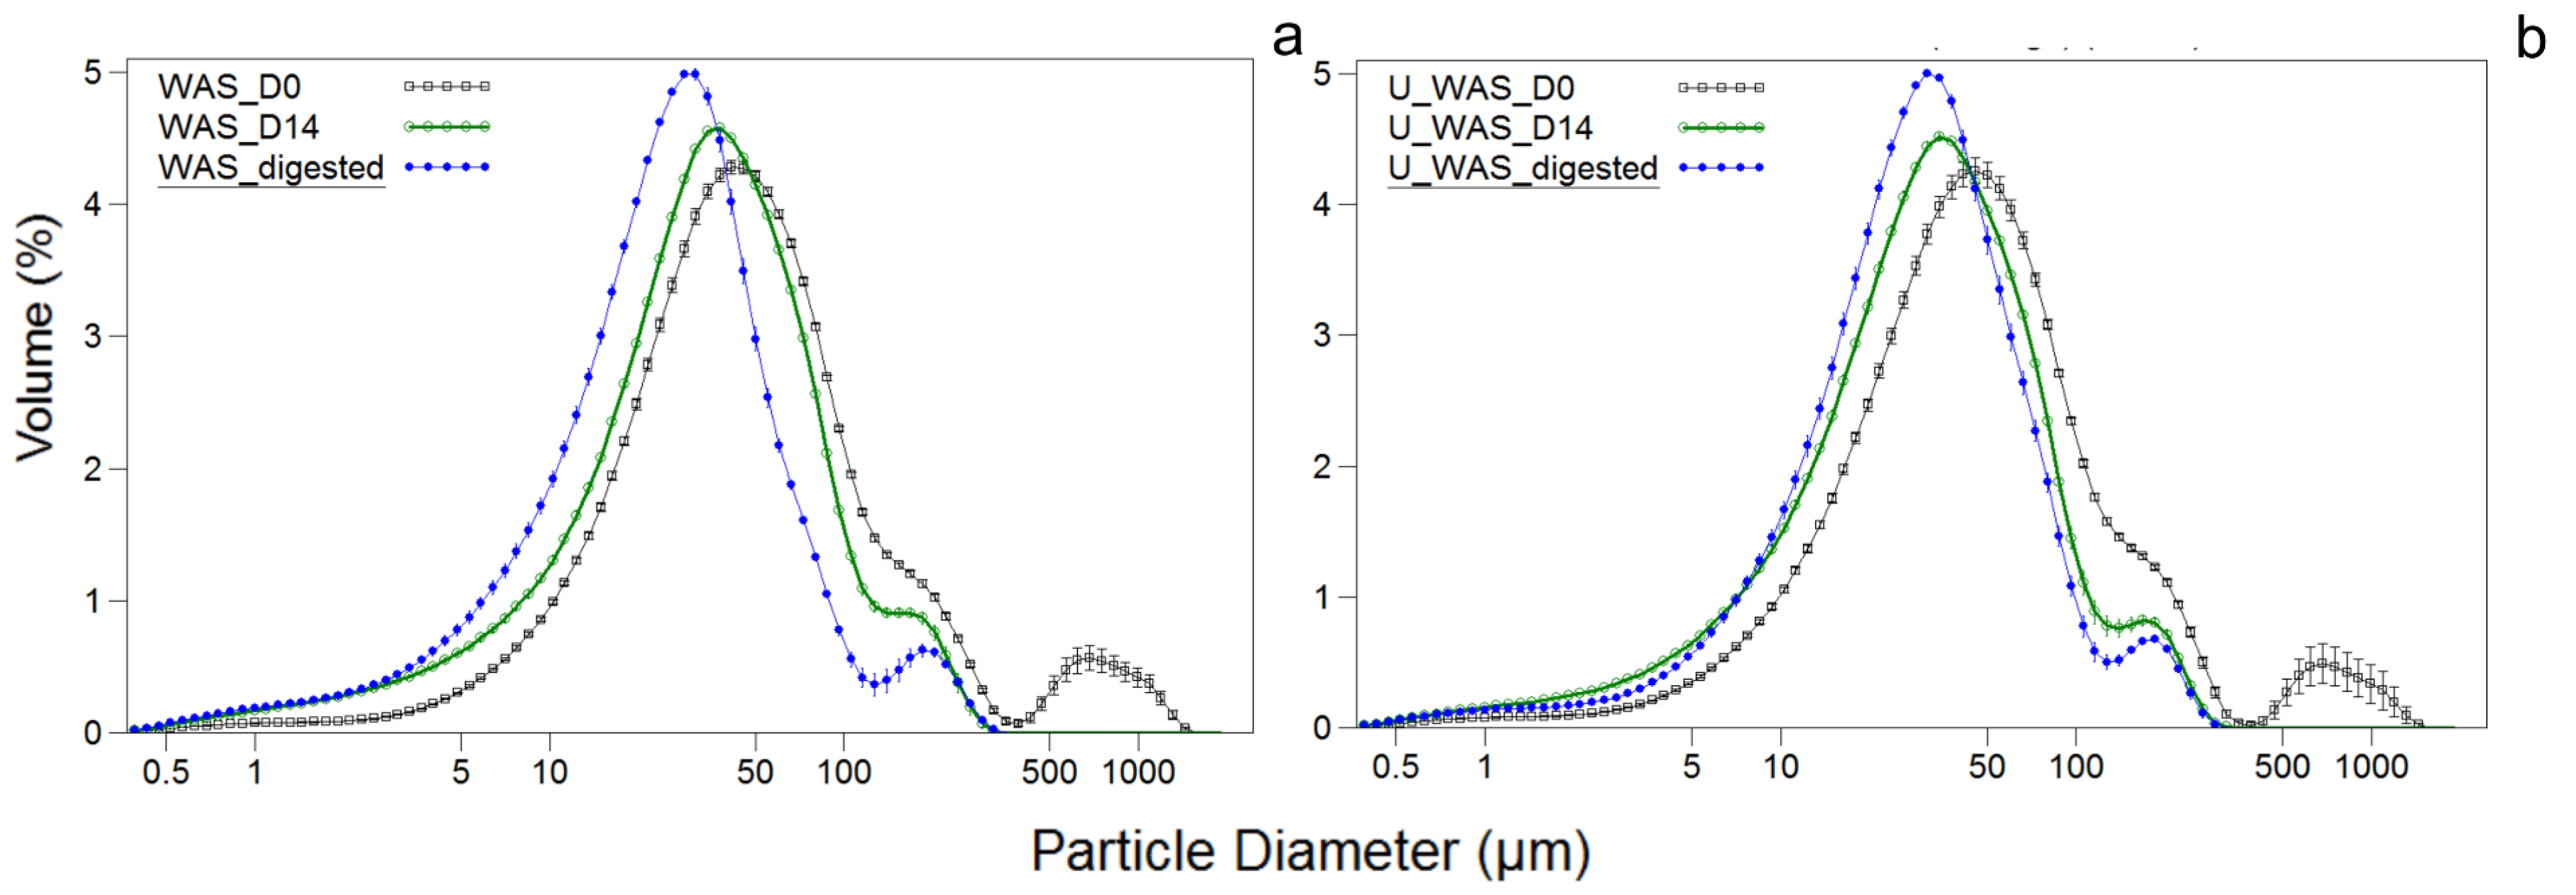
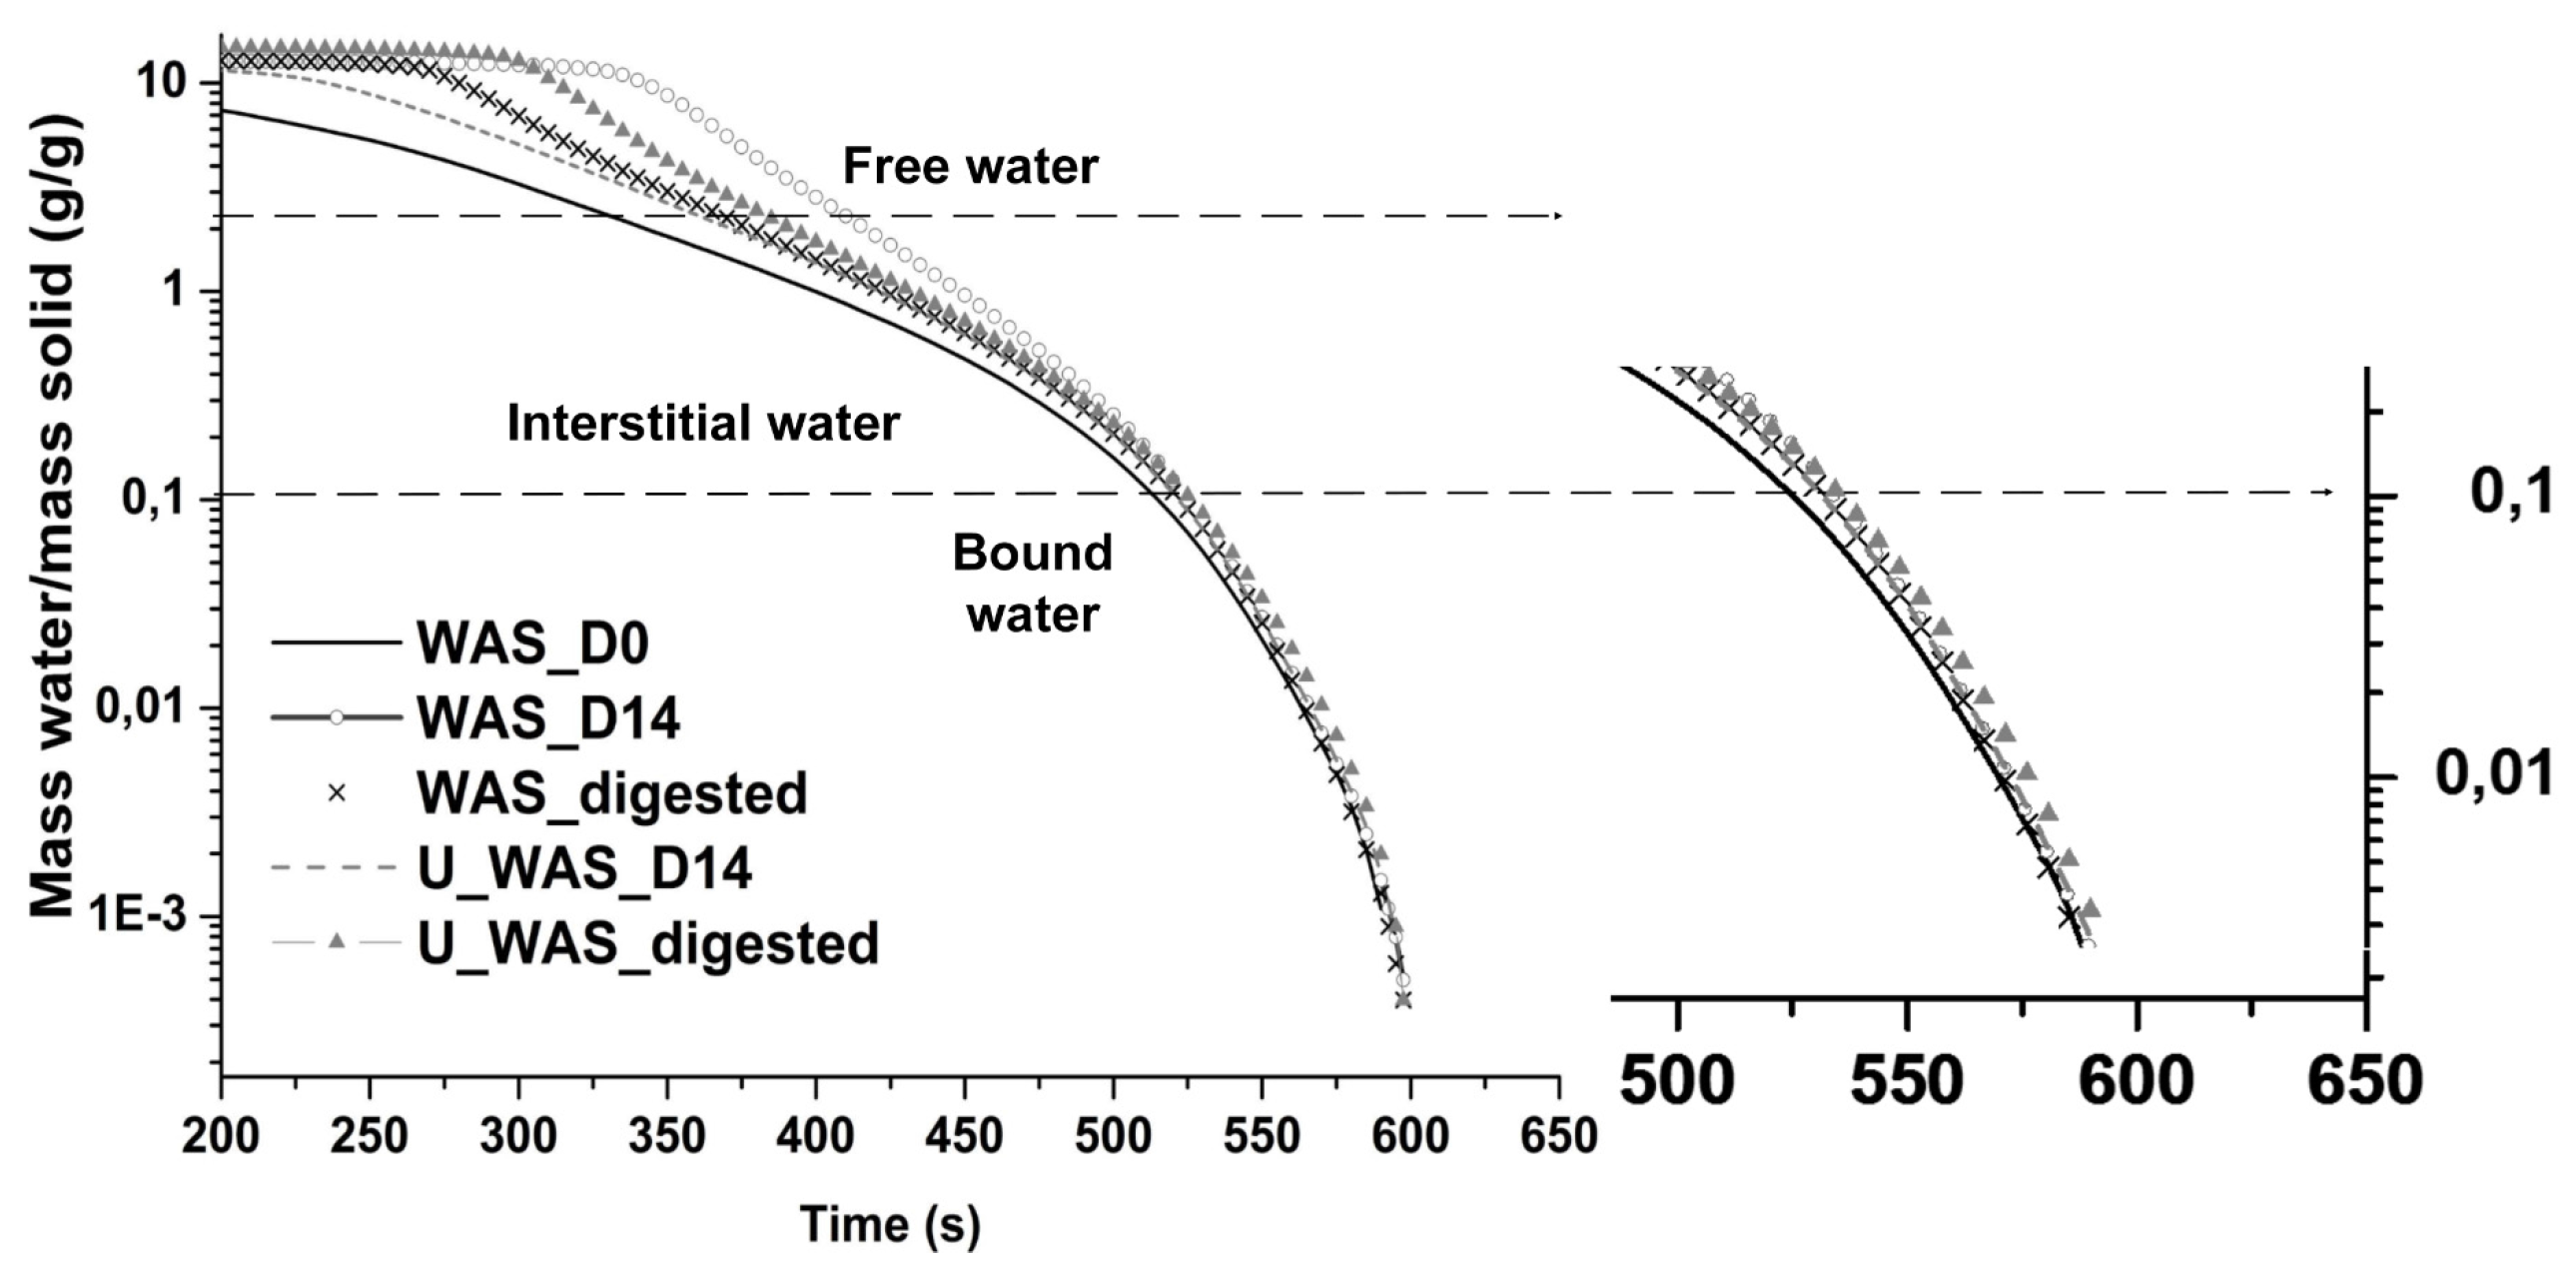
3.2. Dewatering Parameters during the Digestion Process

Figure 2 shows the evolution of PSD of WAS and U_WAS samples during batch digestion. The first samples of these experiments were composed of a mixture of substrate and inoculum; this explains the lower range of particle sizes shown in these graphs. The previous observation of lower mean particle size due to the pretreatment is still discernible in samples taken at day 0. The pretreated system presents a 9% decrease in particle size when compared with the WAS_D0 sample. Even though the pretreatment caused the destruction of sludge flocs and the release of biopolymers, flocs agglomeration was still observed due to the addition of the inoculum (samples taken at day 0 showed particles with sizes in the range of 500–1000 μm in the PSD graphs). However, these flocs were no longer present in the posterior samples (D14 and digested). The digestion process finally results in a biosolid with small particles presenting both systems with similar PSD profiles (WAS_digested and U_WAS_digested).
Figure 2. Particle size distribution (PSD) obtained from samples taken from batch digestion tests of waste activated sludge (WAS) (a) and ultrasound-pretreated WAS (U_WAS) (b).
Water 07 06483 g002
It has been suggested that the release of biopolymers and inorganic substances caused by the pretreatment and posterior digestion might have a detrimental effect on sludge dewaterability [20,21]. However, Feng et al. [14] reported an improvement in this parameter (measured by CST and SRF) when applying low ultrasound dosages (<2200 kJ/kg ST), while energy dosages above 4400 kJ/kg TS caused a detriment in these parameters. Shao et al. [22] found that the particle size of sludge flocs had an important effect on dewaterability, and reported a significant correlation between mean particle size and CST when evaluating WAS. In the present research, the dewatering behavior of WAS was examined along with the effect of ultrasound pretreatment and digestion on dewaterability. CST and SRF values obtained are shown in Table 3.
Pretreatment of WAS resulted in an increase in CST and SRF parameters, thus showing an adverse effect on dewaterability. CST values were also normalized, considering the TSS content in the sample, to take into account the effect of the removal of volatile solids during the digestion process. The CST values obtained also show a similar trend to that previously reported for CST values. Nevertheless, the pretreated system presented a slight improvement on day 14, but this effect is not corroborated when taking into account the content of solids. In this line, CST values calculated presented a slight increase on day 14. During the final stage of digestion, CST values were reduced, reaching values far below those obtained for the original WAS sample. However, when considering normalized CST values, a higher CST value was obtained at the final stage of the digestion when compared to the original WAS sample. On the other hand, the digestion of WAS resulted in a gradual deterioration of sludge dewatering parameters during the initial stage of digestion, but at the end of the process, the detriment in dewaterability is striking, reaching a CST value of more than 2000 s. Even though the mean particle size of WAS and U_WAS digestates presented similar values, the dewatering behavior of digestates varied significantly (Table 3).
Table 3. Dewatering parameters for WAS during the digestion process.
SampleVSremoval (%)TS (%)TSS (%)CST (s)CSTs (s L/gTSS)SRF (cm/g)
Inoculumn/a3.7 ± 0.183.6 ± 0.10332 ± 179.17 ± 0.272.62 × 1013 ± 1.31 × 10¹²
WAS_D0n/a5.9 ± 0.295.1 ± 0.25456 ± 278.89 ± 0.409.81 × 1013 ± 4.39 × 10¹²
WAS_D1422 ± 0.304.2 ± 0.213.5 ± 0.10550 ± 3815.33 ± 0.452.26 × 1014 ± 9.06 × 10¹²
WAS_digested34 ± 0.693.5 ± 0.173.0 ± 0.9>200066.28 ± 1.983.79 × 1014 ± 1.89 × 10¹³
U_WAS_D0n/a5.8 ± 0.294.4 ± 0.13608 ± 3013.67 ± 0.425.52 × 1014 ± 2.20 × 10¹³
U_WAS_D1418 ± 0.284.7 ± 0.233.6 ± 0.10535 ± 3214.69 ± 0.441.32 × 1014 ± 6.60 × 10¹²
U_WAS_digested39 ± 0.343.5 ± 0.172.6 ± 0.07267 ± 139.89 ± 0.498.04 × 1013 ± 4.02 × 10¹²
Drying curves and water distribution as interpreted by Kopp and Dichtl [23] are shown in Figure 3. Three zones are described: free water associated with solid particles, interstitial water (trapped inside interstitial spaces of flocs and microorganisms), and chemically bound water. The graph shows results obtained from WAS and U_WAS digestion batch tests. The increase in SSA experienced by the samples after applying ultrasound pretreatment and after digestion may influence the adhesion of water to particles. This would explain the greater amount of water retained, which was in accordance with the suggestion of Lawler et al. [24] about the relevance of SSA over sludge dewaterability, with this being established as one of the most relevant parameters. In addition, the slope of the curve in the interstitial region was higher for digested samples, which may be a positive effect of digestion on the drying process. The time needed for eliminating interstitial water was much higher for the WAS sample. The application of the pretreatment favors its removal, and a similar effect was also observed for digested samples. With regard to the last region of the curve, the difficulty in eliminating bound water from digested samples was similar, regardless of the pretreatment and digestion stage. The shape of the curve and total drying time indicate that the digested samples needed a similar time to complete the drying process even though they started from an initial point of much higher water content.
Figure 3. Drying curve of sludge samples during the digestion process.
Water 07 06483 g003

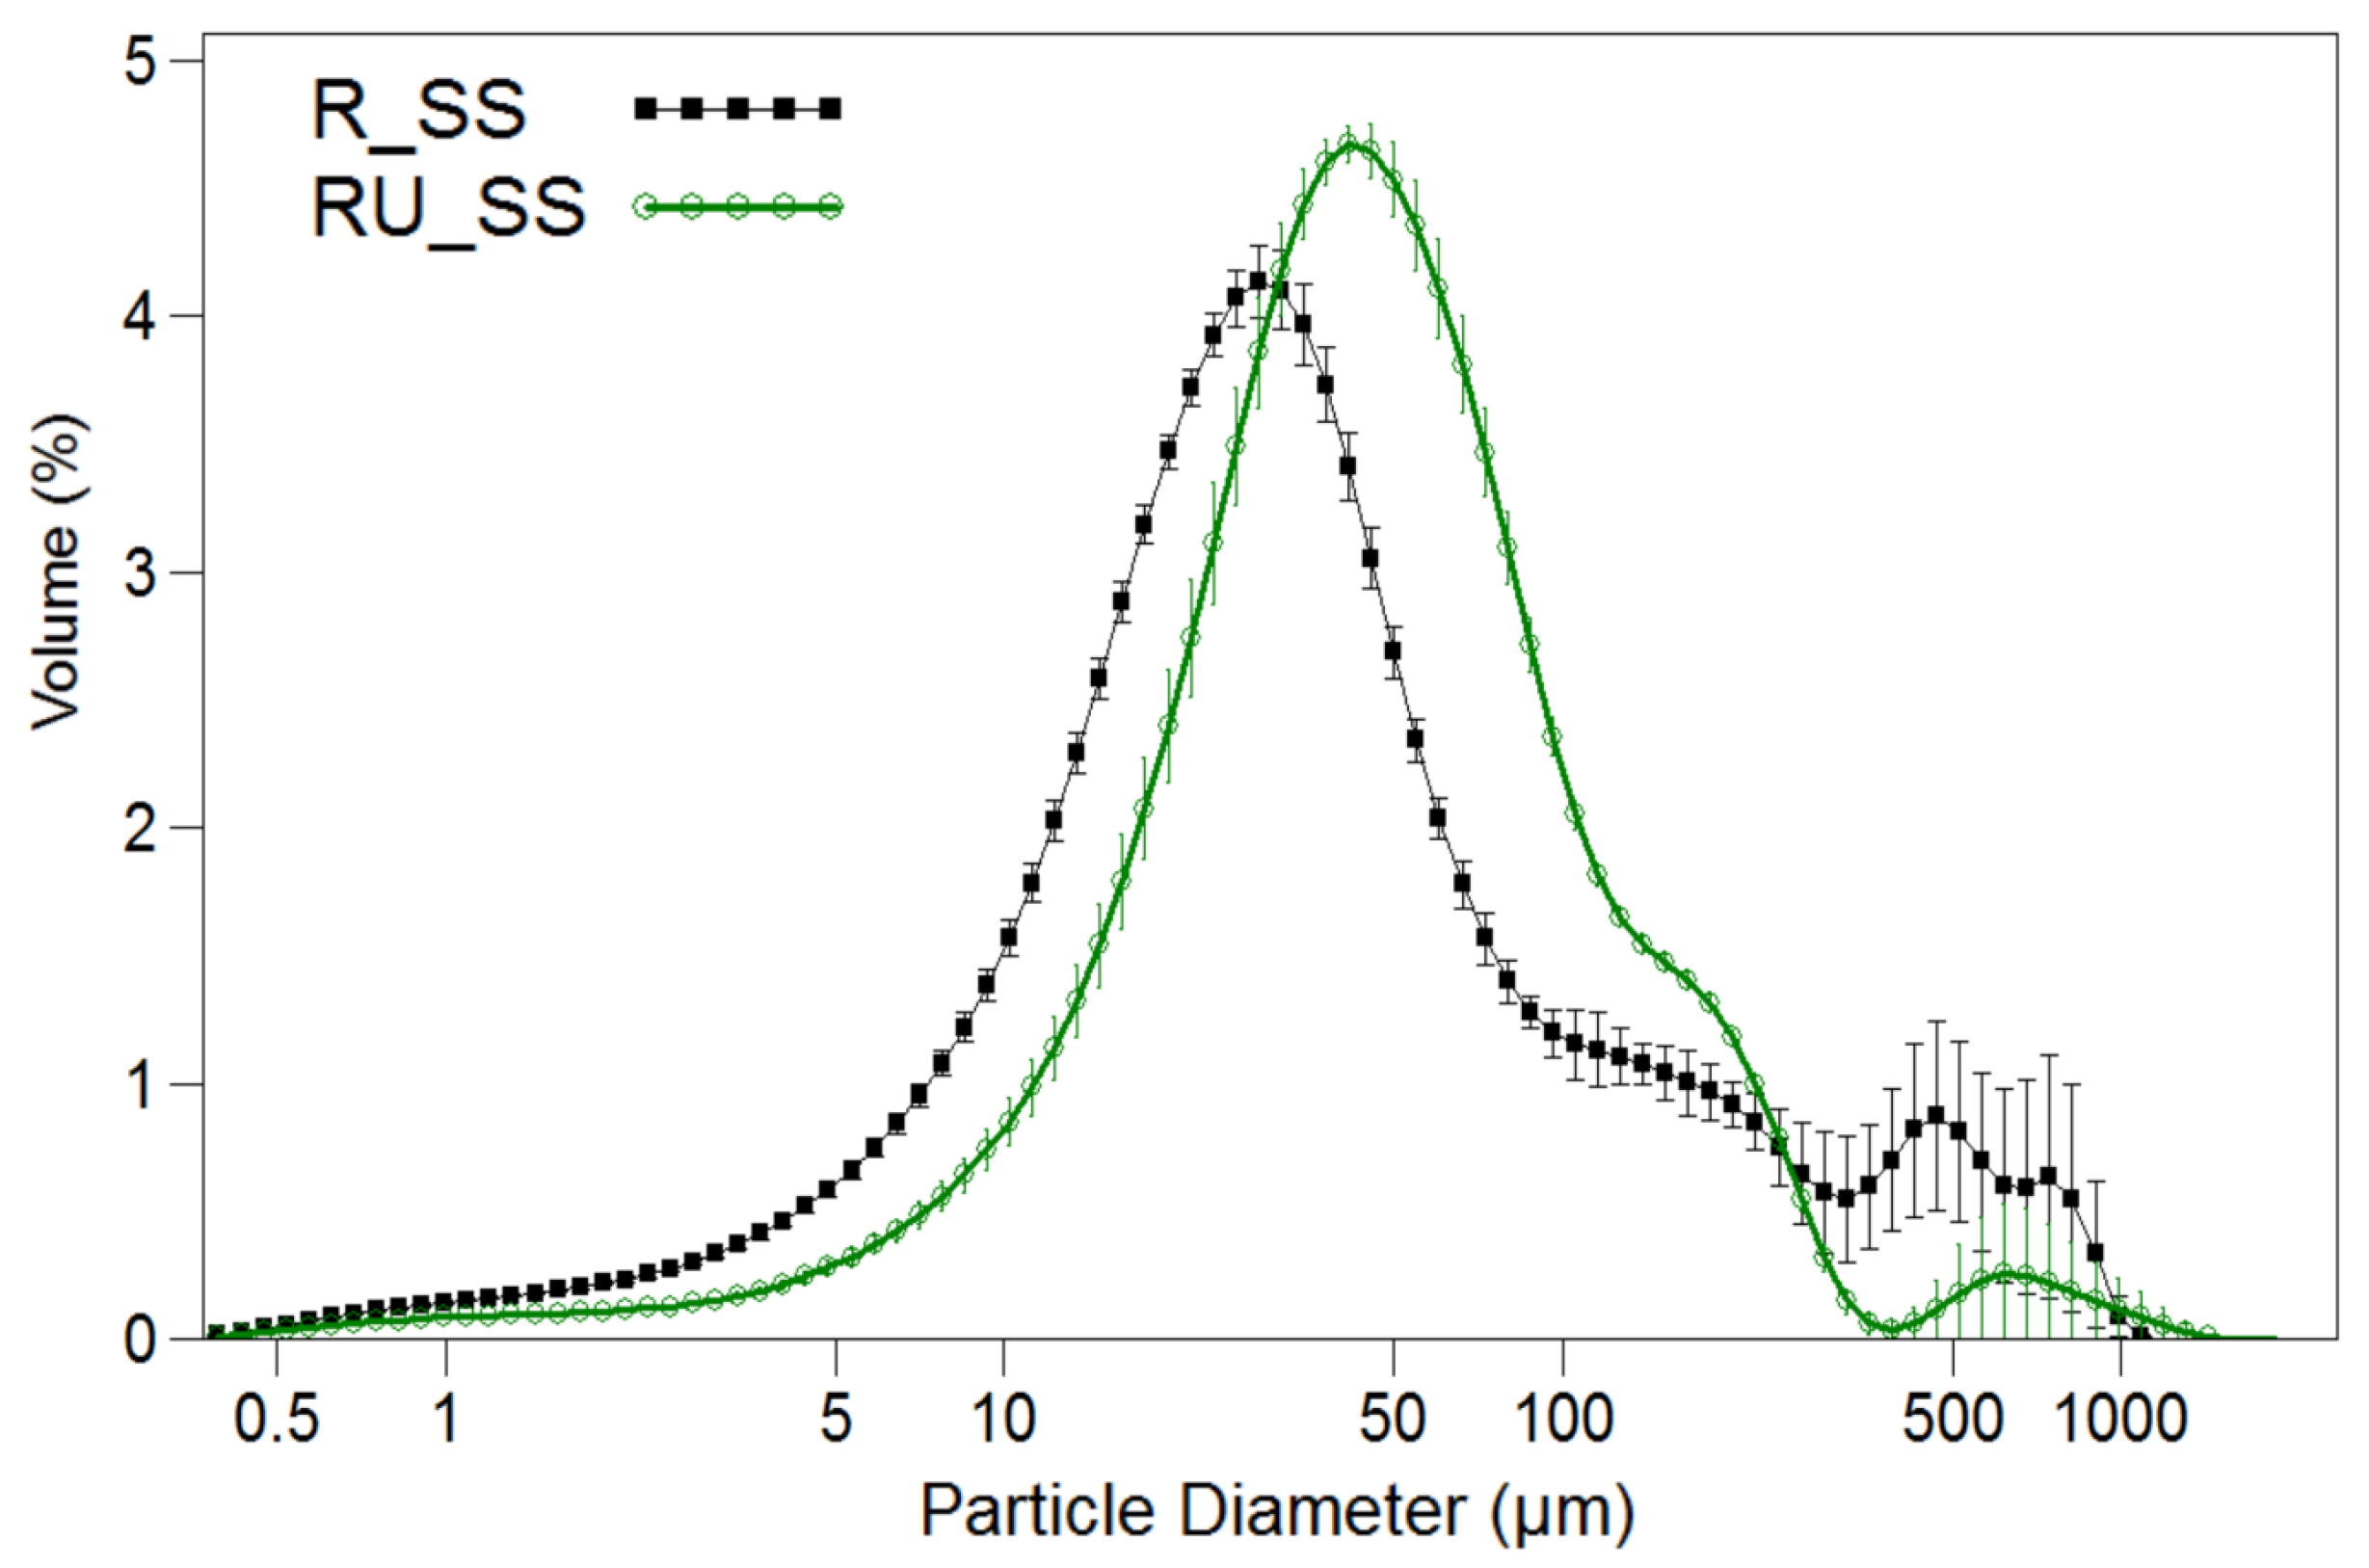
3.3. Digestion under Semi-Continuous Operation

Table 4 shows the performance parameters for the semi-continuous reactor. These values are average data obtained from the last 10 days of operation for each system (R_SS and RU_SS) which corresponded to a period with low deviation in performance. Digestion of SS at an HRT of 21 days resulted in an SMP of 120 mL/g VS, while the use of U_SS enhanced the methane production. The low SMP value obtained for the R_SS reactor was associated with the low degradability of sludge probably due to the high residence time applied in the WWTP for the sludge line and the reception of a stream from a near slaughterhouse. This reactor suffered from a severe VFA build-up probably associated with the low digestibility of the sludge. This particularity was also observed in the batch test by a delay in the gas production rate during the first 10 days of the batch experiment. The work with the semi-continuous reactor led to VFA being accumulated, resulting in an average value greater than 5000 mg/L for total VFA (TVFA) as shown in Table 4. The pretreatment of the sludge favored its degradability, therefore allowing the decrease in VFA. This is the reason for obtaining SMP values close to those reported for the batch test when evaluating the ultrasound-pretreated sludge but high discrepancies when comparing results from the SS systems.
Table 4. Parameters of reactor performance of R_SS and RU_SS operating under semi-continuous conditions.
Performance ParameterR_SSRU_SS
OLR (a) (g VS/L day)1.80 ± 0.051.80 ± 0.09
SMP (b) (mL/g VS )120 ± 24224 ± 20
Gas Prod. (c) (L/day)0.92 ± 0.121.92 ± 0.12
TVFA (mg/L)6711 ± 822n.d (d)
Acetic acid (mg/L)1938 ± 344n.d (d)
Propionic acid (mg/L)2733 ± 250n.d (d)
%VS removal6.0 ± 0.328.9 ± 0.86
Mean particle size (μm)87.30 ± 4.3676.10 ± 3.80
Mode (μm)28.5 ± 1.1455.7 ± 3.32
Dp90 (μm)230 ± 11.0144 ± 8.60
SSA(cm2/mL)4191 ± 2502487 ± 149
CST(s)1765 ± 881737 ± 69
SRF(cm/g)1.9552 × 1013 ± 7.8208 × 10116.6430 × 1012 ± 3.3215 × 10¹¹
Notes: (a) OLR: Organic loading rate; (b) SMP: Specific methane production; (c) Gas Prod.: Average daily gas production, (d) Detection limit of VFA (5.0 mg/L).
With regard to the results obtained from the particle size analysis, samples taken from this reactor when digesting U_SS presented a 15% decrease in the mean particle size when compared with the results obtained when digesting SS. These results are in accordance with those reported by Mahmoud et al. [25], who also described a transformation of bigger flocs into smaller particles during anaerobic digestion of sludge. Digested sludge is usually characterized by particles of much lower size than those of the original substrate, and this was also the case in the present research when batch conditions were tested; however, this was not the case when tests were performed under semi-continuous conditions. The mean particle size of digestates was in the range 30–35 μm under batch conditions, while this value increased to approximately 76–87 μm under semi-continuous conditions (Table 4). Operating conditions favored the aggregation of particles (Figure 4) in a similar way to that observed during the initial stage of batch digestion tests when the substrate and inoculum were mixed. This effect was more pronounced in the R_SS sample, which is characterized by a wide PSD with a mode value of 28.5 μm, while its mean particle size was 87.3 μm.
Figure 4. Particle size distribution (PSD) obtained from samples taken from semi-continuous digestion of sewage sludge (R_SS) and ultrasound-pretreated sewage sludge (RU_SS).
Water 07 06483 g004
PSD profiles obtained from batch tests were characterized for presenting a narrow base at the end of the digestion process. The digested sample obtained from the SS system presented a characteristic profile with the main peak being centered between 3 to 100 μm and this profile was also reported for the pre-treated SS sample. The differences in the fluid regimen are affecting the PSD. As their main particularity, batch tests present the permanence of all particles inside the reactor from the beginning to the end of the experimental period. On the other hand, for semi-continuous reactors, particles introduced into the reactor experience a residence time which is, on average, equal to the theoretical residence time. The real time that particles spend inside the reactor is dependent on the distribution of the residence times. Therefore, the PSD profile obtained from the semi-continuous operating reactor represents the different sizes of particles which, in turn, are associated with their specific residence time. For this reason these profiles present a wider base with a greater proportion of particles accounting for the range of 100–1000 μm.

4. Conclusions

The digestion of sewage sludge was significantly enhanced by ultrasound pretreatment around 14% for the batch system. Specific methane production (SMP) was improved by the application of ultrasound due to floc deagglomeration and the increase in specific surface area (SSA), which also favored sludge digestibility. Sonication decreased the mean particle size of the sludge, which favored biogas production, but also affected sludge dewaterability. Under semi-continuous conditions, the reactor treating ultrasound-pretreated sludge presented a successful performance with a specific methane production (SMP) of 224 ± 20 mL/g VS. This reactor presented a better performance than its counterpart digesting sewage sludge (SS). Differences in performance were explained by the physical effects caused by the pre-treatment and by the increase in digestibility of sludge that in turn allowed for the conversion of volatile fatty acids.
Ultrasound pretreatment initially caused a detriment in sludge dewaterability. However, at the end of digestion, the pretreated digestate presented better dewatering performance than its counterpart. Ultrasound improved water removal from digested sludge. The use of particle size analysis proved to be a suitable technique for characterizing the course of digestion and obtaining insight into the process performance. Batch digested samples presented a similar profile with a mean value of a particle size of around 32 μm. Under the semi-continuous condition, the PSD profile is affected by the performance of the system, and therefore this technique presents great potential for evaluating process performance and fluid dynamics in the reactor. Further work will extend these results to evaluate the course of different digestion systems.

Acknowledgments

This research was possible thanks to the financial support of “Ministerio de Economía y Competitividad” Project ref: ENE2012-33027.

Author Contributions

This manuscript was possible thanks to the guidance and collaboration of Antonio Morán. Preparation of the work and selection of information and relevant point of the manuscript was mainly done by Xiomar Gómez. Experimental work, data analysis, discussion, final manuscript redaction and preparation were done by Elia Judith Martínez and Jose Guillermo Rosas.

Conflicts of Interest

The authors declare no conflict of interest.

References

  1. Dewil, R.; Baeyens, J.; Goutvrind, R. Ultrasonic treatment of waste activated sludge. Environ. Prog. 2006, 25, 121–128. [Google Scholar] [CrossRef]
  2. Lafitte-Trouqué, S.; Forster, C.F. The use of ultrasound and gamma-irradiation as pre-treatments for the anaerobic digestion of waste activated sludge at mesophilic and thermophilic temperatures. Bioresour. Technol. 2002, 84, 113–118. [Google Scholar] [CrossRef]
  3. Eastman, J.A.; Ferguson, J.F. Solubilization of particulate organic carbon during the acid phase of anaerobic digestion. J. Water Pollut. Control Fed. 1981, 53, 352–366. [Google Scholar]
  4. Shimizu, T.; Kudo, K.; Nasu, Y. Anaerobic waste-activated sludge digestion-a bioconversion mechanism and kinetic model. Biotechnol. Bioeng. 1993, 41, 1082–1091. [Google Scholar] [CrossRef] [PubMed]
  5. Khanal, S.K.; Grewell, D.; Sung, S.; van Leeuwen, J. Ultrasound Applications in Wastewater Sludge Pretreatment: A Review. Crit. Rev. Environ. Sci. Technol. 2007, 277–313. [Google Scholar] [CrossRef]
  6. Hogan, F.; Mormede, S.; Clark, P.; Crane, M. Ultrasonic sludge treatment for enhanced anaerobic digestion. Water Sci. Technol. 2004, 50, 25–32. [Google Scholar] [PubMed]
  7. Kim, D.J.; Lee, J. Ultrasonic sludge disintegration for enhanced methane production in anaerobic digestion: Effects of sludge hydrolysis efficiency and hydraulic retention time. Bioprocess. Biosyst. Eng. 2012, 35, 289–296. [Google Scholar] [CrossRef] [PubMed]
  8. Ruiz-Hernando, M.; Martín-Díaz, J.; Labanda, J.; Mata-Alvarez, J.; Llorens, J.; Lucena, F.; Astals, S. Effect of ultrasound, low-temperature thermal and alkali pre-treatments on waste activated sludge rheology, hygienization and methane potential. Water Res. 2014, 61, 119–129. [Google Scholar] [CrossRef] [PubMed]
  9. Zhen, G.; Lu, X.; Li, Y.Y.; Zhao, Y. Combined electrical-alkali pretreatment to increase the anaerobic hydrolysis rate of waste activated sludge during anaerobic digestion. Appl. Energy 2014, 128, 93–102. [Google Scholar] [CrossRef]
  10. Tiehm, A.; Nickel, K.; Zellhorn, M.; Neis, U. Ultrasonic waste activated sludge disintegration for improving anaerobic stabilization. Water Res. 2001, 35, 2003–2009. [Google Scholar] [CrossRef]
  11. Braguglia, C.M.; Gianico, A.; Mininni, G. Effect of ultrasound on particle surface charge and filterability during sludge anaerobic digestion. Water Sci. Technol. 2009, 60, 2025–2033. [Google Scholar] [CrossRef] [PubMed]
  12. Chu, C.P.; Lee, D.J.; Chang, B.V.; You, C.S.; Tay, J.H. “Weak” ultrasonic pre-treatment on anaerobic digestion of flocculated activated biosolids. Water Res. 2002, 36, 2681–2688. [Google Scholar] [CrossRef]
  13. Riera-Franco De Sarabia, E.; Gallego-Juárez, J.A.; Rodríguez-Corral, G.; Elvira-Segura, L.; González-Gómez, I. Application of high-power ultrasound to enhance fluid/solid particle separation processes. Ultrasonics 2000, 38, 642–646. [Google Scholar] [CrossRef]
  14. Feng, X.; Deng, J.; Lei, H.; Bai, T.; Fan, Q.; Li, Z. Dewaterability of waste activated sludge with ultrasound conditioning. Bioresour. Technol. 2009, 100, 1074–1081. [Google Scholar] [CrossRef] [PubMed]
  15. Martinez, E.J.; Fierro, J.; Moreno, R.; Gomez, X. Particle size analysis and ultrasound pre-treatment of sludge. J. Residuals Sci. Technol. 2013, 10, 93–98. [Google Scholar]
  16. American Public Health Association (APHA); American Water Works Association (AWWA); The World Economic Forum (WEF). Standard Methods for the Examination of Water and Wastewater; American Public Health Association (APHA): Washington, DC, USA, 1999. [Google Scholar]
  17. Martínez, E.J.; Fierro, J.; Sánchez, M.E.; Gómez, X. Anaerobic co-digestion of FOG and sewage sludge: Study of the process by Fourier transform infrared spectroscopy. Int. Biodeter. Biodegr. 2012, 75, 1–6. [Google Scholar] [CrossRef]
  18. Lo, I.M.C.; Lai, K.C.K.; Chen, G.H. Salinity effect on mechanical dewatering of sludge with and without chemical conditioning. Environ. Sci. Technol. 2001, 35, 4691–4696. [Google Scholar] [CrossRef] [PubMed]
  19. Kopp, J.; Dichtl, N. Prediction of full-scale dewatering results of sewage sludges by the physical water distribution. Water Sci. Technol. 2001, 43, 135–143. [Google Scholar] [PubMed]
  20. Na, S.; Kim, Y.U.; Khim, J. Physiochemical properties of digested sewage sludge with ultrasonic treatment. Ultrason. Sonochem. 2007, 14, 281–285. [Google Scholar] [CrossRef] [PubMed]
  21. Xu, H.; He, P.; Yu, G.; Shao, L. Effect of ultrasonic pretreatment on anaerobic digestion and its sludge dewaterability. J. Environ. Sci. 2011, 23, 1472–1478. [Google Scholar] [CrossRef]
  22. Shao, L.; He, P.; Yu, G.; He, P. Effect of proteins, polysaccharides, and particle sizes on sludge dewaterability. J. Environ. Sci. 2009, 21, 83–88. [Google Scholar] [CrossRef]
  23. Kopp, J.; Dichtl, N. Influence of the free water content on the dewaterability of sewage sludges. Water Sci. Technol. 2001, 44, 177–183. [Google Scholar] [PubMed]
  24. Lawler, D.F.; Chung, Y.J.; Hwang, S.-J.; Hull, B.A. Anaerobic digestion: Effects on particle size and dewaterability. J. Water Pollut. Control Fed. 1986, 58, 1107–1117. [Google Scholar]
  25. Mahmoud, N.; Zeeman, G.; Gijzen, H.; Lettinga, G. Interaction between digestion conditions and sludge physical characteristics and behaviour for anaerobically digested primary sludge. Biochem. Eng. J. 2006, 28, 196–200. [Google Scholar] [CrossRef]

