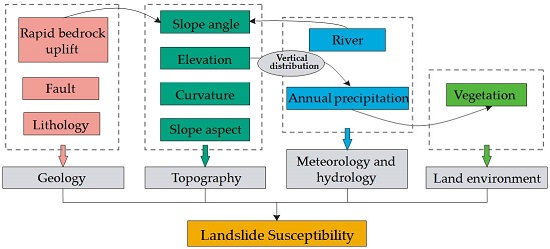
Article

Landslide Susceptibility Mapping in Vertical Distribution Law of Precipitation Area: Case of the Xulong Hydropower Station Reservoir, Southwestern China

College of Construction Engineering, Jilin University, Changchun 130026, China
*
Author to whom correspondence should be addressed.
Submission received: 15 May 2016 / Revised: 10 June 2016 / Accepted: 21 June 2016 / Published: 28 June 2016

Abstract

:
This study focused on landslide susceptibility analysis mapping of the Xulong hydropower station reservoir, which is located in the upstream of Jinsha River, a rapidly uplifting region of the Tibetan Plateau region. Nine factors were employed as landslide conditioning factors in landslide susceptibility mapping. These factors included the slope angle, slope aspect, curvature, geology, distance-to-fault, distance-to-river, vegetation, bedrock uplift and annual precipitation. The rapid bedrock uplift factor was represented by the slope angle. The eight factors were processed with the information content model. Since this area has a significant vertical distribution law of precipitation, the annual precipitation factor was analyzed separately. The analytic hierarchy process weighting method was used to calculate the weights of nine factors. Thus, this study proposed a component approach to combine the normalized eight-factor results with the normalized annual precipitation distribution results. Subsequently, the results were plotted in geographic information system (GIS) and a landslide susceptibility map was produced. The evaluation accuracy analysis method was used as a validation approach. The landslide susceptibility classes were divided into four classes, including low, moderate, high and very high. The results show that the four susceptibility class ratios are 12.9%, 35.06%, 34.11%and 17.92% of the study area, respectively. The red belt in the high elevation area represents the very high susceptibility zones, which followed the vertical distribution law of precipitation. The prediction accuracy was 85.74%, which meant that the susceptibility map was confirmed to be reliable and reasonable. This susceptibility map may contribute to averting the landslide risk in the future construction of the Xulong hydropower station.

Graphical Abstract

1. Introduction

The interaction between triggering mechanisms and natural conditions directly determines the occurrence and frequency of landslides [1,2,3,4,5]. To understand these natural hazards and predict potential landslide hazard areas, landslide susceptibility mapping (LSM) is considered to be an effective method to reduce the hazard impacts [6]. Many approaches can be used to predict the occurrence of slope failures, such as physically-based and statistical approaches [7,8,9,10]. The physically-based method is appropriate for analyzing the specific event. Combined with the field, GIS technology and the nonlinear method are utilized for LSM, which is more appropriate due to their flexibility.
Landslides are one of the most common natural hazards in the Three Gorges Reservoir [11]. The water level is an important factor to activate old landslides and trigger new landslides [12]. Thus, attention should be given to the reservoir area of the hydropower station, where landslides are more probable and frequently occur [11]. Landslide susceptibility mapping is necessary to mitigate and even avoid natural or secondary hazards. In fact, human field investigation in a large region, especially in mountainous areas, is very difficult. Hence, the prediction of hazards in a certain area based on limited data is difficult and demands a practical approach to achieve this goal. Some researchers have recently applied different classification methods to LSM prediction. Many statistical methods exist for LSM, such as the logistic regression (LR) method [13,14,15,16,17], statistical index (SI) [18,19], discriminant analysis (DA) [20] and bivariate statistical analysis (BSA) [21]. However, the statistical approaches have very strict mathematical reasoning, and their application must meet strict demands. In fact, the prediction samples usually cannot pass the hypothesis test in the assessment process. Some other approaches have also been developed, according to the methodologies of decision tree (DT) [22], genetic algorithm (GA) [23], artificial neural network (ANN) [15,24,25,26,27,28,29], and support vector machine (SVM) [30,31,32,33]. These objective statistical methods were used for evaluating the relationships between various influencing factors and landslide inventories. However, some methods have a few limitations in terms of LSM. Tehrany [34] stated that the DT method requires enhancement because some difficulties were encountered while defining the rules. During the process of ANN modeling, Tiwari and Chatterjee [35] stated that the length of the dataset could cause errors. Therefore, solely relying on objective methods has some limitations and can easily lead to misleading information. Hence, the introduction of a subjective method is necessary.
The pairwise comparison of the analytic hierarchy process (AHP) is based on expert opinions and thus introduces a degree of subjectivity for the criteria of significance [36]. However, it is sometimes criticized for its subjectivity. Along with traditional applications, a new trend uses AHP in conjunction with others methods [37]. An accurate objective method, the information content model (ICM), can be integrated with AHP to provide a framework for LSM in this study. The combined method makes use of the advantages of both the subjective method (AHP) and the objective method (ICM) to assess criteria and improve the accuracy of the results. The proposed method avoids the inherent disadvantages of using subjective or objective methods in isolation. Meanwhile, the geographical information system (GIS), which has quick access to the obtained data, global positioning technique, and remote sensing techniques, has been widely used and integrated with the aforementioned methods.
Approaches should be applicable for a special region. In this study, the Xulong hydropower station is located in a rapidly uplifting region in Southwestern China. Landslide susceptibility mapping should be considered from a new perspective based on the characteristics of this area. Based on GIS technology and field investigations, we obtained a database of 69 landslides along the Jinsha River at the Xulong hydropower station reservoir. The study area is located in the rapidly uplifting region of the Tibetan Plateau that is caused by the neotectonic movement. Furthermore, under the influence of the southwest and southeast monsoons, the study area is dry, with low values of rainfall, and the foehn effect is significant. Due to the foehn effect and topographical enclosure, the valley along the Jinsha River has a special dry and hot climate. According to the special climate and different influencing factors, this study selected nine factors, including vertical distributed annual precipitation, as the assessment factors, and established a landslide susceptibility assessment factor system. Meanwhile, this work chose the pixel unit as the evaluation unit to extract the information of each factor and discussed the intervals of each factor based on GIS technology. The analytic hierarchy process (AHP) and the information content model (ICM) were combined to establish a landslide susceptibility assessment model. Finally, the historic landslide data and evaluation accuracy analysis [38] were used for validation.

2. Methodology

2.1. The Analytic Hierarchy Process

The analytic hierarchy process (AHP) is a multi-criteria decision analysis method proposed by Saaty [39]. The weights of these criteria are defined after they are ranked according to their relative importance. Thus, once all the criteria are sorted in a hierarchical manner, a pairwise comparison matrix for each criterion is created to enable a significance comparison. The relative significances of the criteria are evaluated on a scale of 1–9, indicating less importance to greater importance. Weighting by AHP is widely used in many applications [40,41] and it is recommended to be used for regional studies. The steps of the AHP for weighting are as follows:
1. The first step is to build the hierarchical structure of the target problem.
2. Saaty proposed a scaling method to score the parameters in each layer. By comparing the importance of the parameters in each level, aij is used to present the ratio of xi and xj, which builds the judgment matrix A = (aij):
A = ( a i j ) n × n = [ a 11 a 12 a 21 a 22 a 1 n a 2 n a n 1 a n 2 a n n ]
3. The judge matrix needs to meet the following equation:
= λmaxω
where ω is maximum characteristic vector corresponding feature vector of judge matrix A. The weight value can be obtained after normalizing the feature vector.
4. The consistency check is needed to analyze whether the weights distribution is reasonable or not. The consistency indicator (CI) can be obtained by the following equation:
C I = λ m a x n n 1
The random consistence ratio (CR) can be obtained by the following equation:
C R = C I / R I
where n is the order of RI, RI is a random indicator (RI). A different order of the corresponding RI values can be obtained listed in Table 1.
If CR < 0.1, the judgment matrix has met the consistency test standards. This means that the weight of the factors is reasonable. It is necessary to adjust the matrix until the CR meets the requirement.

2.2. The Information Content Model

The information content model (ICM) is evaluated from the theory of communication proposed by C.E Shannon. He firstly proposed the concept of information and the calculation equation of information entropy. Recently, more and more researchers applied the ICM on geological hazard assessment and environmental quality evaluation [42,43,44]. This method overlays the information content provided by landslide influencing factors and sets the total information content as the quantitative expression factor of landslide susceptibility assessment. The calculation equation is as follows:
I ( y ,   x 1 x 2 x n ) = ln P ( y ,   x 1 x 2 x n ) P ( y )
where I ( y ,   x 1 x 2 x n ) is the information content provided by factor combinations x1 x2xn for landslide hazard, P ( y ,   x 1 x 2 x n ) is the probability of landslide under the condition of factors combinations x1 x2xn, P(y) is the probability of landslide.
The procedure of the GIS-based information content model is as follows:
1. Calculate the information content I (xi, H) of each influencing factor xi:
I ( x i ,   H ) = ln P ( x i / H ) P ( x i )
where P ( x i / H ) is the probability of x i under the condition of landslide, P ( x i ) is the occurrence probability of x i in the study area. This equation is a theoretical model; frequency is used for probability calculation in the actual application:
I ( x i ,   H ) = ln N i / N S i / S
where S is the total amount of pixels in the study area, N is total landslide pixels amount in the study area, Si is the pixels amount of factor x i in the study area, Ni is landslide pixels amount among the factor x i pixels.
2. Calculate the amount information content of each evaluation factor:
I i = i = 1 n I ( x i ,   H ) = i = 1 n ln N i / N S i / S
where I i is the amount information content of each evaluation factor, n is total number of factors.
3. The total information content I i is used as the comprehensive factor. The higher the value is, the greater the landslide susceptibility.

2.3. The Landslide Susceptibility Assessment

Based on the information content model, this study considered the weight of each influencing factor. Combined with the AHP weighting method, this study overlays the related factor information content to calculate the information weight values and the total information weighs of each evaluation unit:
I ( x i ,   H ) w = W i × I ( x i ,   H ) =   W i × ln N i / N S i / S
I i w = i = 1 n I ( x i ,   H ) =   i = 1 n W i × ln N i / N S i / S
The information weight value of each evaluation factor and each evaluation unit are calculated by the following equations: where I i w is the comprehensive information weight value of evaluation unit for the evaluation factors except for precipitation, W i are the weights of the evaluation factors calculated by the AHP method, S is the total amount of pixels in the study area, N is total amount of the number of landslide pixels amount in the study area, Si is the amount of pixels of factor x i in the study area, and Ni is the number of landslide pixels among the factor x i pixels.

3. Study Area and Data

3.1. Study Area

The study area is located in the mountains separating the Sichuan and Yunnan provinces of China, along the upper reaches of the Jinsha River (Figure 1). The Jinsha River flows from south to north and is controlled by regional tectonics. In this area, the topography is characterized as a steep and deep valley within the area of the high and very high mountains. The Xulong hydropower station reservoir is located in the middle-high tectonic erosion mountains, with erosion accumulation landform types. The elevation difference is mainly greater than 1000 m, and the maximum elevation difference is 2800 m.
The reservoir area is located along the southeastern margin of the Tibetan Plateau. Since the Quaternary, neotectonic movement has made the study area a rapidly uplifting region [45]. Due to the landform characteristics and intensity differences of the neotectonic movement, landslides have widely occurred [46]. The deformation rate of the Jinsha River belt is 5 mm a year [47]. The regional neotectonic movement zoning is shown in Figure 2. The structural movement of the strong uplift caused a rapid river incision, yielding secondary disasters, such as landslides and collapses. Meanwhile, this area is influenced by the southwest and southeast monsoons, which contribute to the foehn effect in this area. Due to the foehn effect and the topographical enclosure, the characteristics are complex. The climate is very dry and has sufficient sunlight. Additionally, the diurnal temperature variation is quite big. The annual temperature is 13.8–19.2°C. The mean annual precipitation ranges from 354.2 mm to 648 mm in the low and middle elevation area. However, because of the unique landforms and high mean elevation, this area follows a significant vertical distribution law of precipitation. The annual precipitation at the high elevation may reach more than 1000 mm. The Jinsha River and its tributaries mainly form a V shape. The flow velocity and river discharge are both high, which has a great impact on the landslides along the river.
The exposed strata in the reservoir are from the Middle Proterozoic, Paleozoic, Mesozoic and Cenozoic. Magmatite and metamorphic rocks also exist. The Middle Proterozoic strata include the Xiongsong formation (Pt2X). The lithology of Pt2X is mainly composed of phyllite, marble, limestone, schist, and slate, which are materials that are prone to landslides. The stratigraphic groups in the Paleozoic include the Gerong formation (D1g), Qiongcuo formation (D1q), and Ophiolite formation (DTJ). The lithology of the Jinsha River Ophiolite formation is mainly composed of basic-ultrabasic rocks, spilite keratophyre, and radiolarian cherts. The stratigraphic groups in the Mesozoic are mainly Triassic (T) and include the Bulun formation (T1b), the Qugasi formation (T3q), the Waigucun formation (T3w), the Jiabila formation (T3j), the Sanhedong formation (T3sh), the Waluba formation (T3wl), and the Maichujing formation (T3m). The lithology of the Triassic formations is mainly composed of mafic volcanic rocks, carbonate, limestone, basalt, and esite, conglomerate, and sandstone. The Cenozoic strata include the Relu formation (E2r) and Quaternary sediment. The Relu formation mainly includes gravelly sandstone and gritstone. The Quaternary Period sediment includes alluvial and lateral moraine material, in addition to lacustrine accumulation, chemical accumulation, and residual accumulation. There are many deep and major faults in the study area, which are affected by tectonic movement. Most of the faults formed as active faults on the basis of the old faults.
Extensive field investigations and observations were identified and mapped in the Xulong hydropower reservoir, which was used to produce a detailed and reliable landslide inventory map. A total of 69 landslides were identified and mapped in the study area by evaluating aerial photos supported by field investigation (
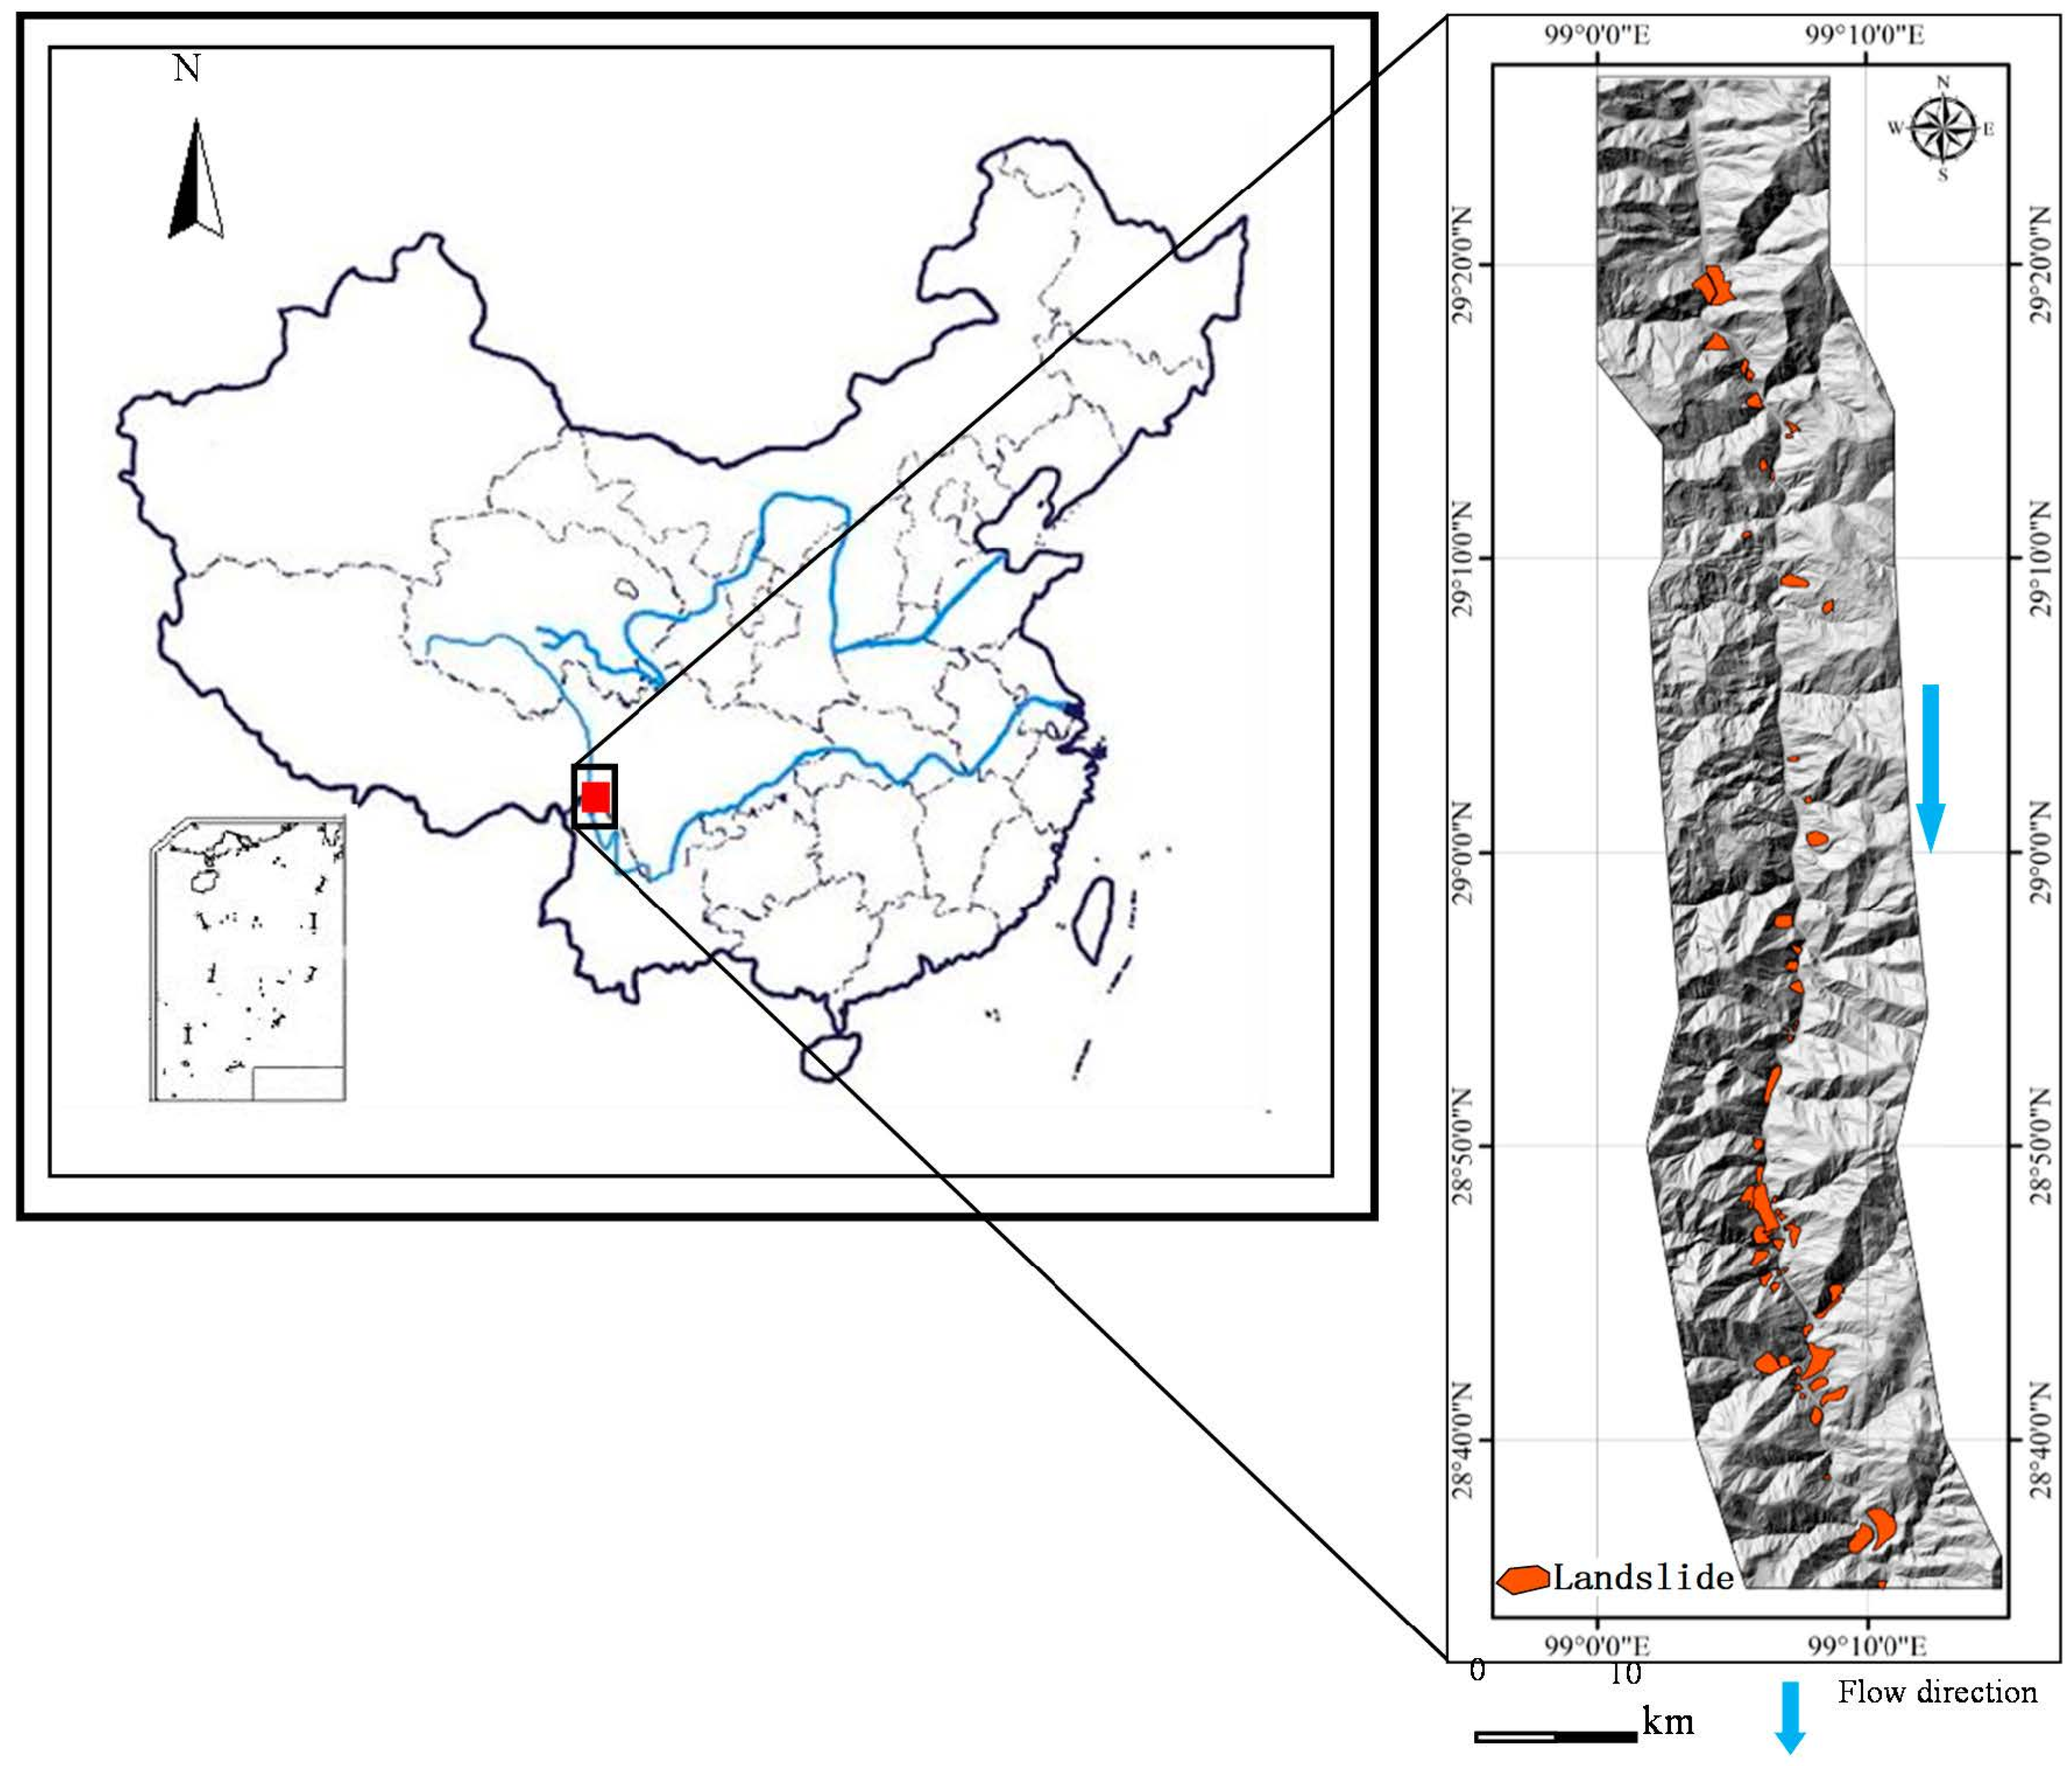
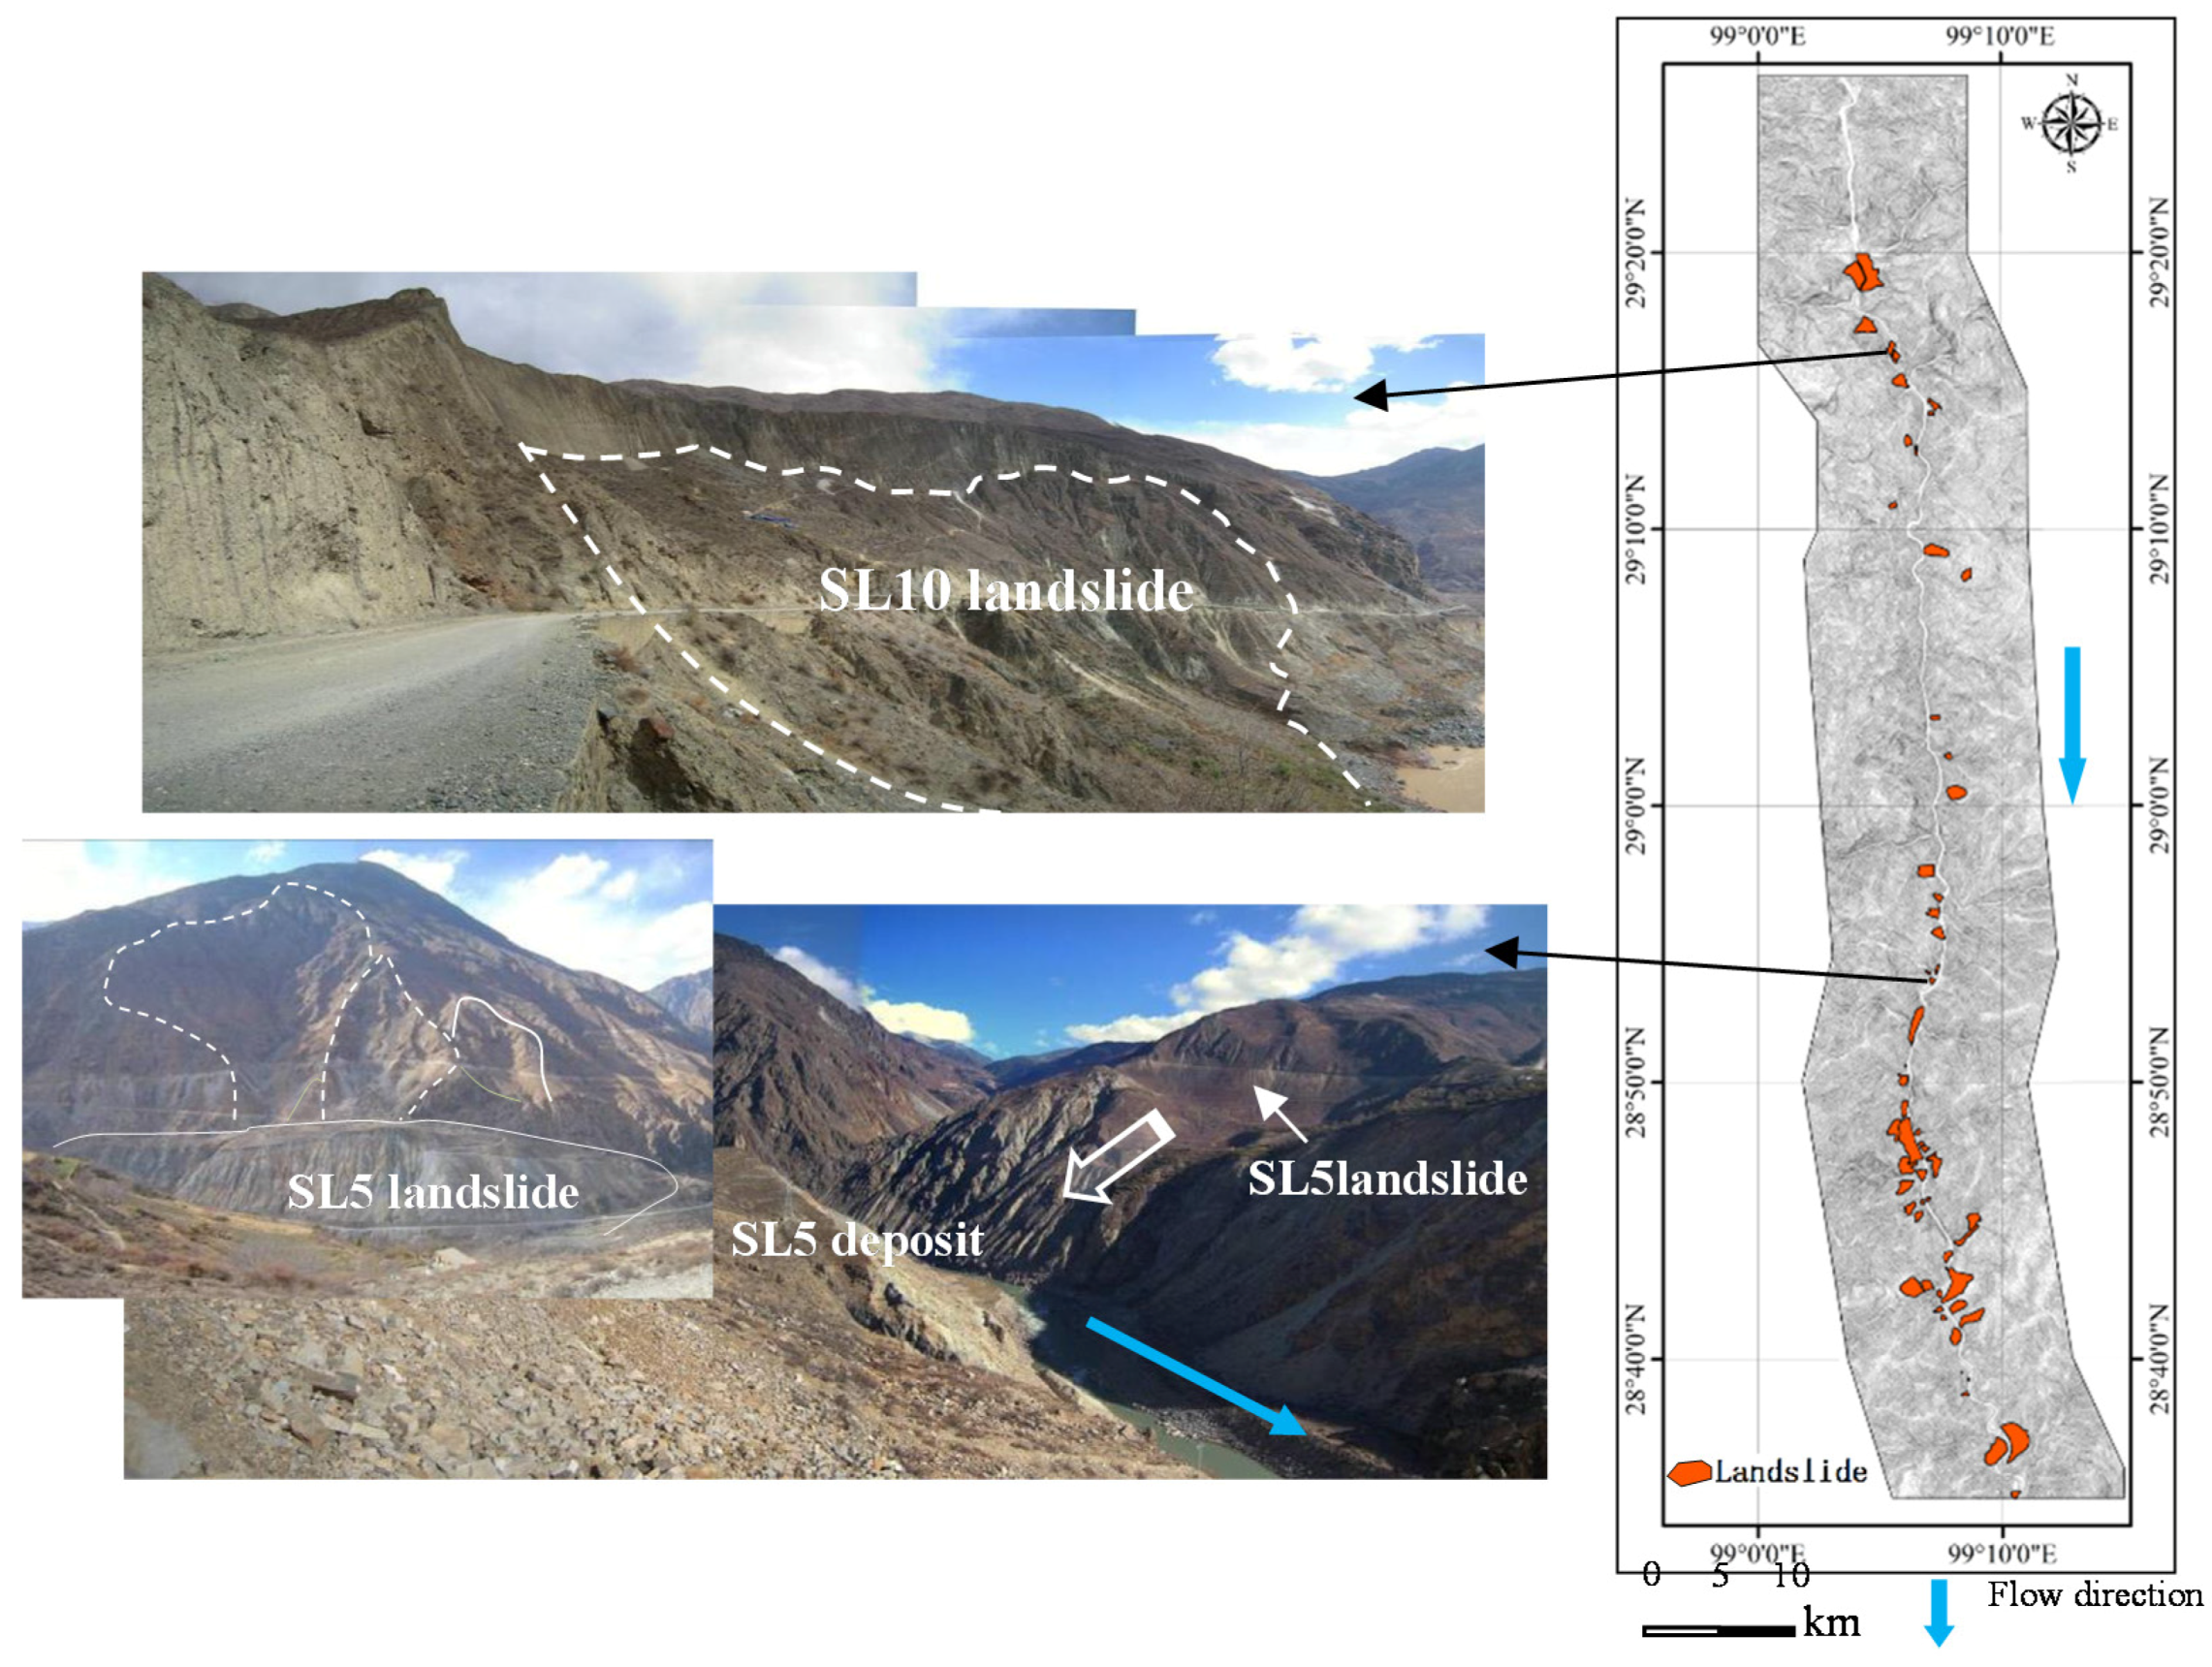
Figure 1). A series of field investigations were undertaken to identify the relationship between the occurrence of landslides and the environmental factors. The landslide types of the 69 landslides were various, mainly including rock slope deformation, rock planar slide, and rock flexural topple [48]. Figure 3 gives some examples of the landslides.

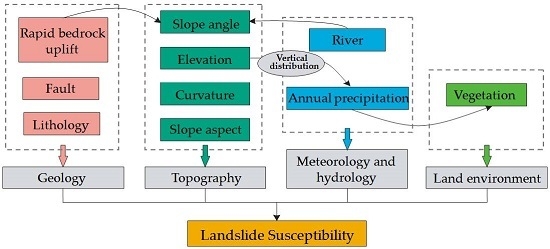
3.2. Influencing Factors

Various causative factors data, such as the slope angle, slope aspect, curvature, geology, distance-to-fault, distance-to-river, vegetation, bedrock uplift, and annual precipitation, were selected for the LSM of the Xulong hydropower station. These variables were selected because they have been successfully used in previous studies [31,49,50,51,52,53,54,55]. Note that there are few people living in the study area. Hence, the traffic is not significant and people’s activities have little influence on landslide occurrences. Precipitation follows a vertical distribution law due to the foehn effect; the higher the elevation is, the higher the precipitation is. Precipitation-induced landslides have been the main topic in recent years [56,57,58]. Evidence has shown that precipitation follows a vertical distribution law. Higher precipitation zones should, thus, have more landslides. Precipitation and landslides show a very close relationship over large spatial scales, suggesting that precipitation drives landslide variations [59]. Considering the distribution of the investigated landslides, solely using the ICM cannot reflect this discipline. Precipitation is the main predisposing factor of landslides, which should be given more attention. Thus, the annual precipitation should not be treated as the other predisposing factors; it was necessary to analyze the annual precipitation factor separately for landslide susceptibility assessment.
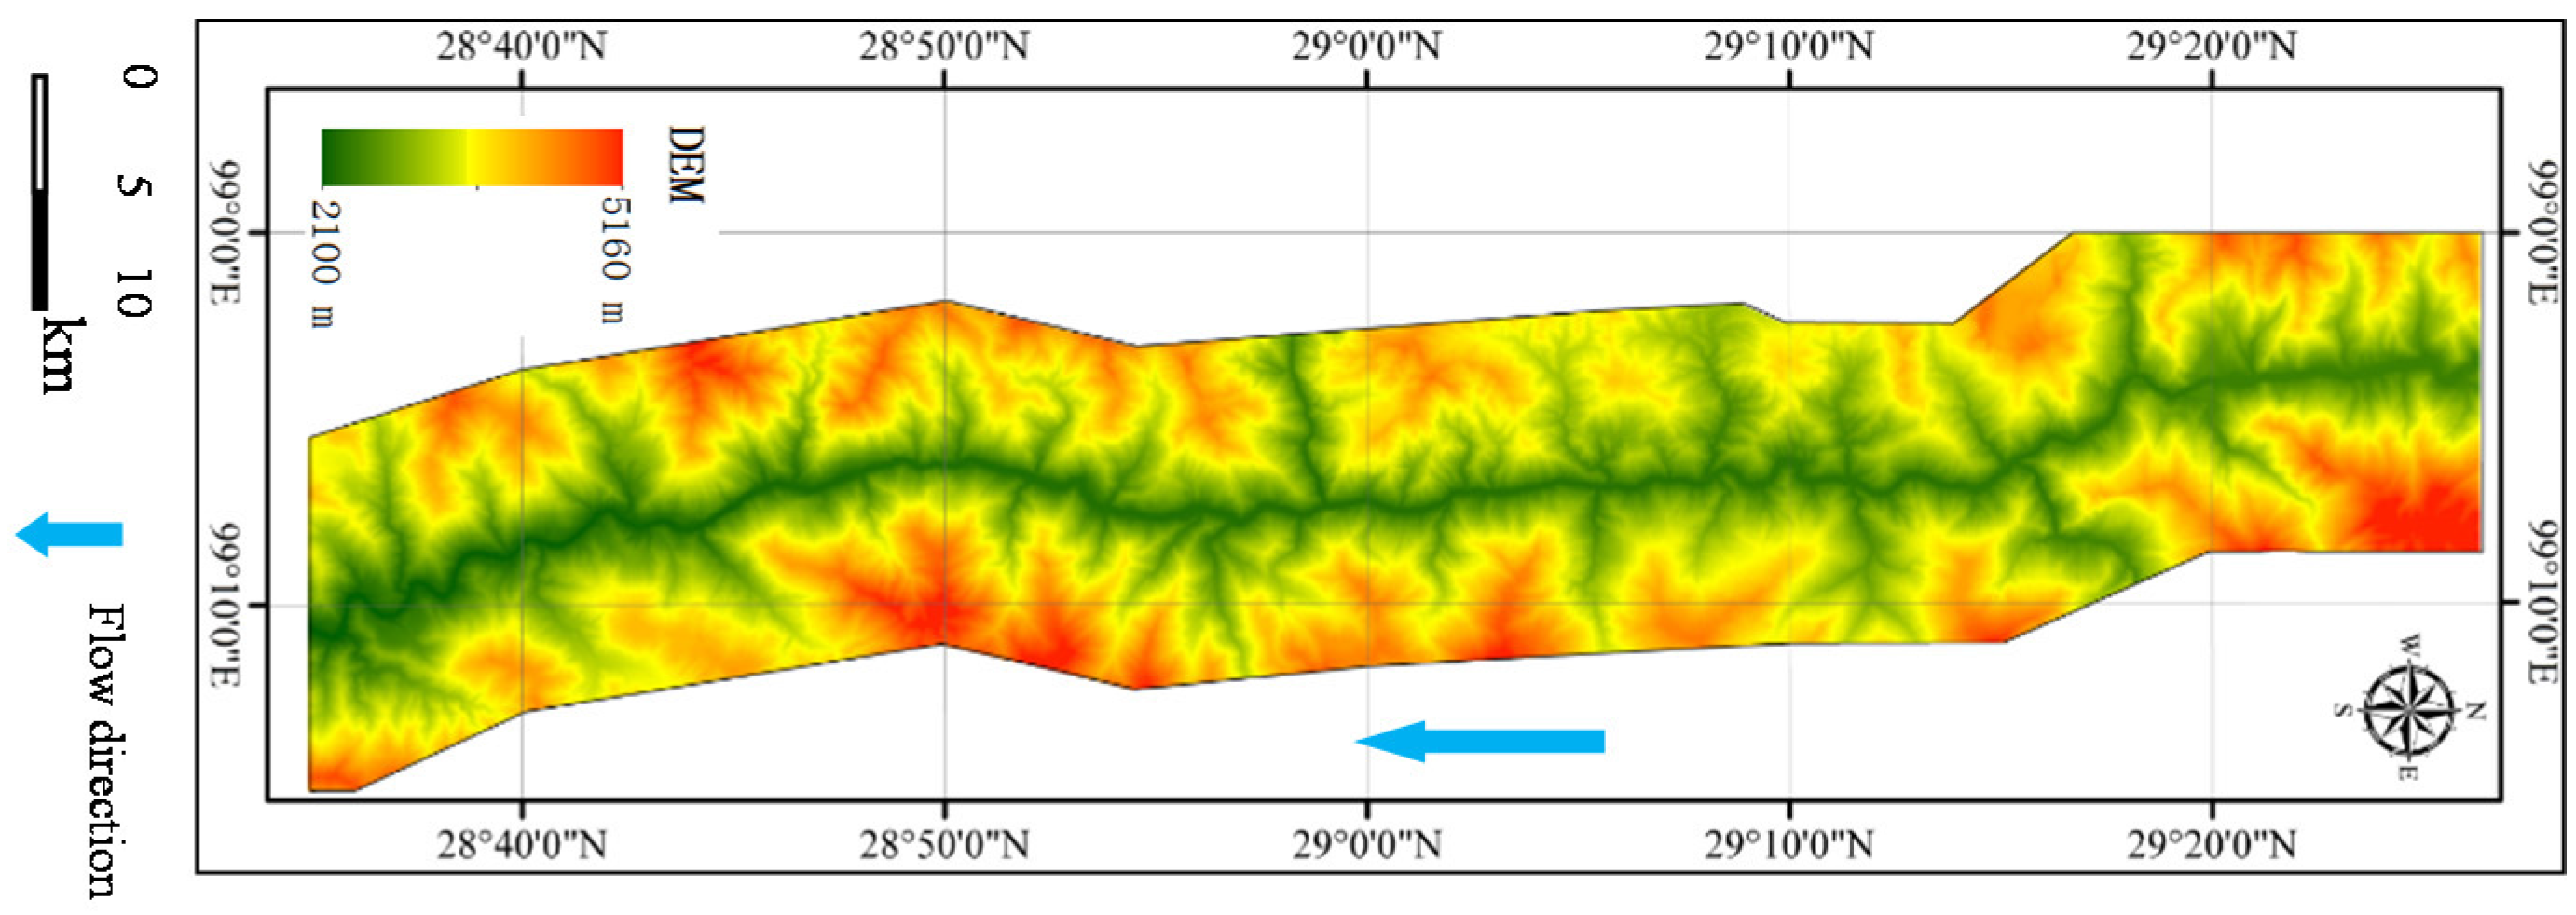
In fact, the selection of regional LSM influencing factors should be applicable and practical for the Xulong hydropower station. Meanwhile, the data obtained by GIS should be reliable. Elevation is controlled by some geologic and geomorphologic processes [60]. The geological map has a scale of 1:10,000, and the digital elevation model (DEM) has a resolution of 5 m × 5 m, covering an area of 1413 km2 (
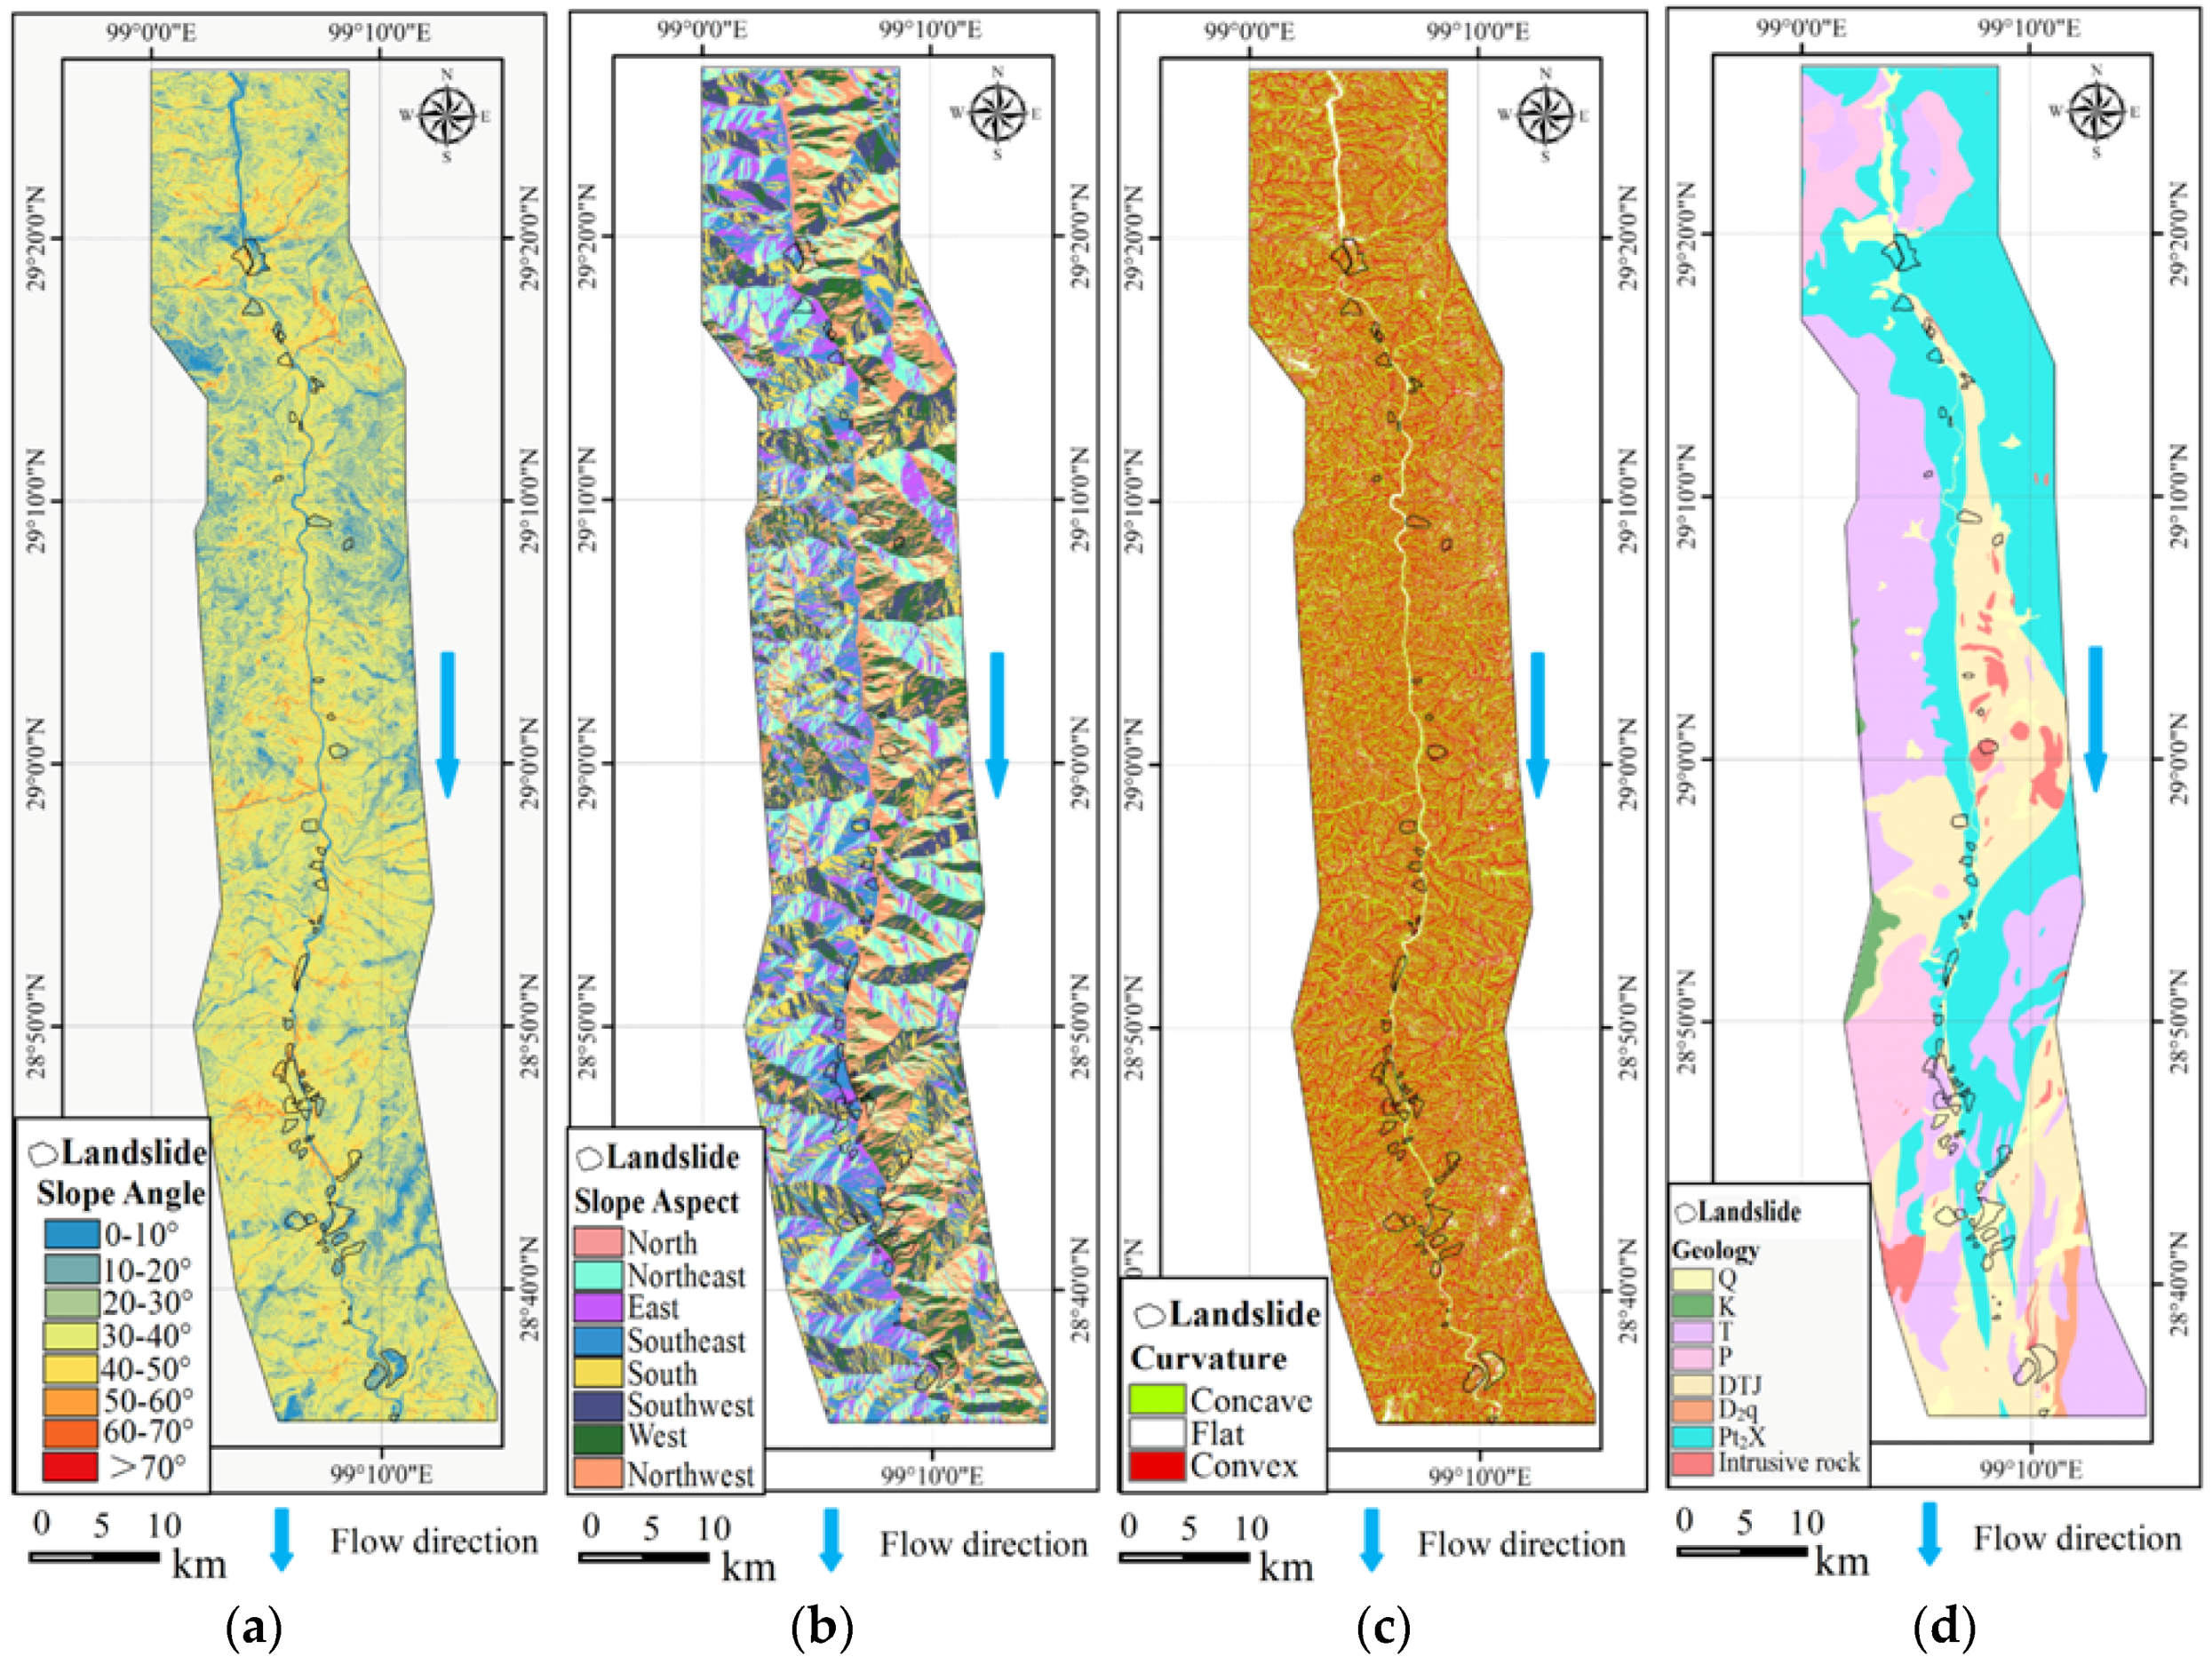
Figure 4). The topography of the reservoir area is highland with elevation ranging from 2100 m to 5160 m, with 20 m interval contours in the geological map. Slope angle is an important factor influencing the slope stability. It was extracted from the DEM through the GIS software at a resolution of 5 m × 5 m. The slope angle varies between flat and 73.8°. The slope map was reclassified into eight classes: (1) 0–10°, (2) 10°–20°, (3) 20°–30°, (4) 30°–40°, (5) 40°–50°, (6) 50°–60°, (7) 60°–70°, and (8) >70° (Figure 5a). The slope aspect map was also extracted from the DEM through the GIS software at a resolution of 5 m × 5 m. Some microclimatic parameters, such as exposure to sunlight and winds, precipitation intensity, and soil moisture are controlled by slope aspect [29]. The slope aspect was divided into nine types, including flat, north (337.5°–22.5°), northeast (22.5°–67.5°), east (67.5°–112.5°), southeast (112.5°–157.5°), south (157.5°–202.5°), southwest (202.5°–247.5°), west (247.5°–292.5°), and northwest ( 292.5°–337.5°) (Figure 5b). Curvature describes the slope shape. The slope shape affects the landslide development, which provides space for slope sliding. Based on the slope shape, the slope can be divided into three types, including concave, convex, and flat (Figure 5c). The influence of curvature on the slope erosion processes is the convergence or divergence of water during downhill flow [61].
The study area is covered with various types of geologic formations. According to the geological map of scale 1:50,000 and field investigation, this study mainly groups the geology into eight types. The general geological setting of the area is shown in 
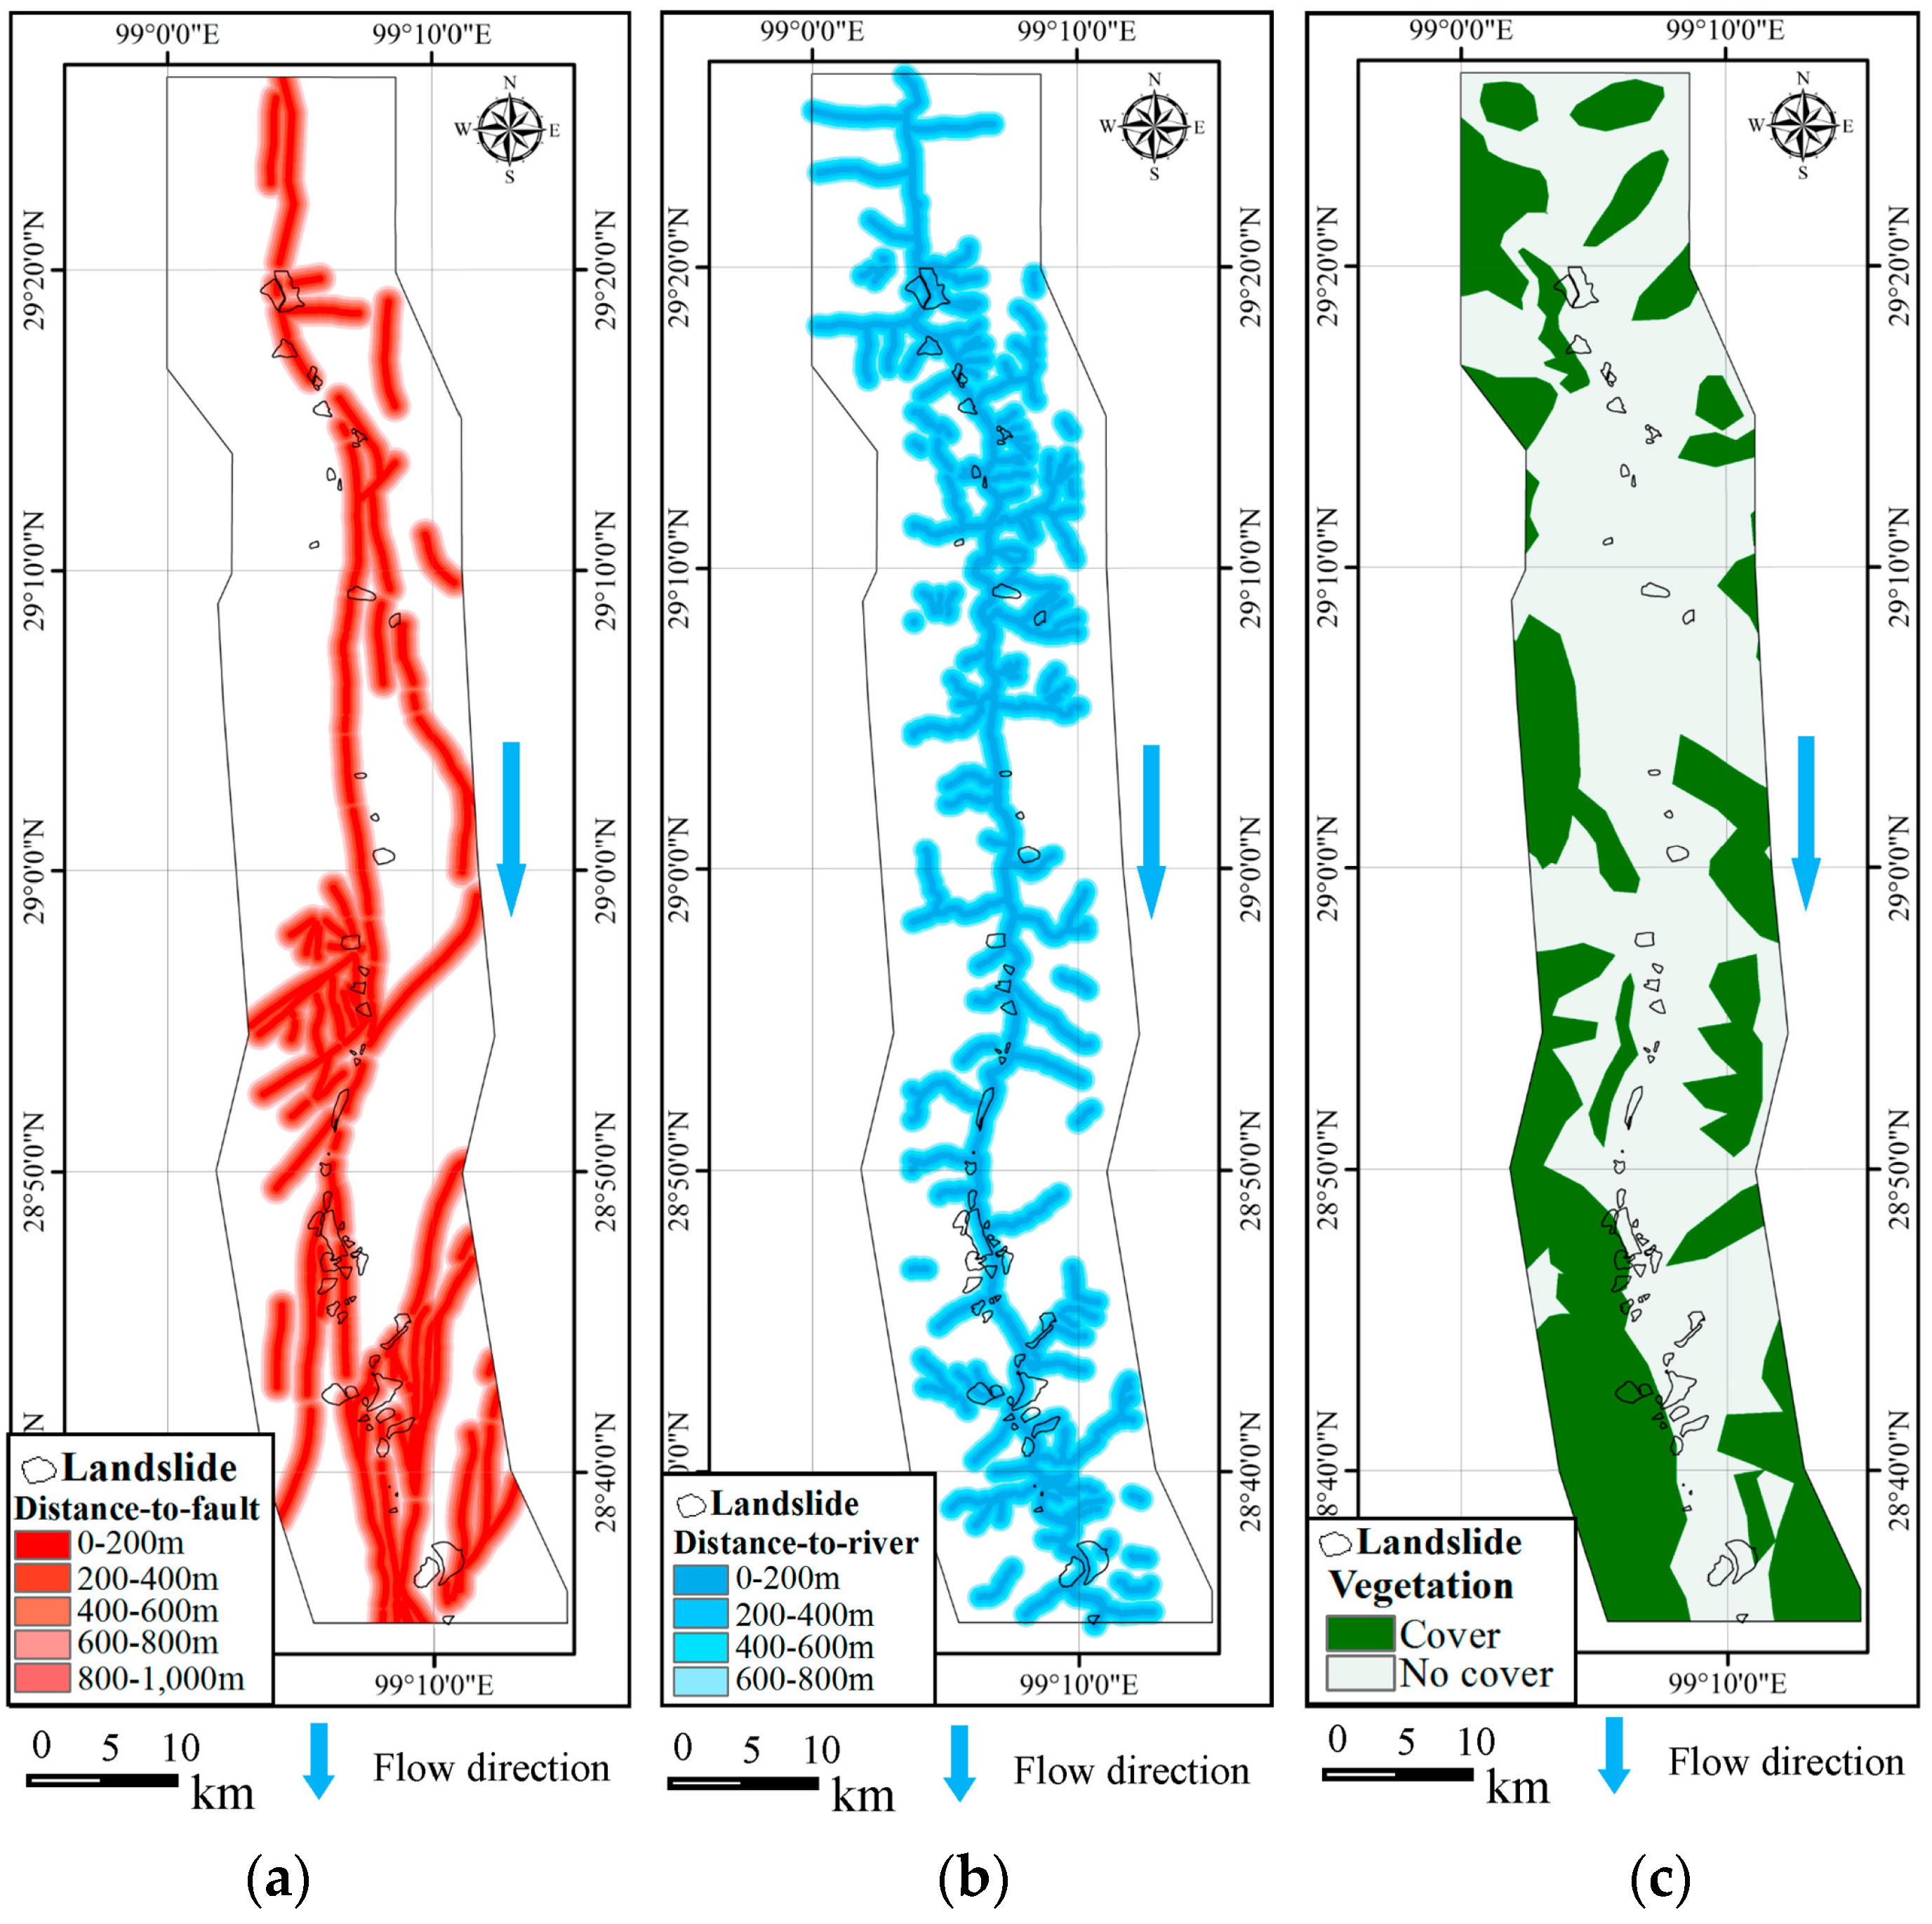
Figure 5d. Field surveys show that faults have a great influence on landslide occurrence. In the reservoir of the Xulong hydropower station, deep and long faults developed substantially. The distance-to-fault is an extremely important evaluation, factor and the distance-to-fault map was calculated in 200 m intervals (Figure 6a). The landslides in the reservoir are mostly distributed within 1000 m of faults. The slopes on the banks of the river often suffer river erosion. In general, at a closer distance to the river, the erosion is stronger and the probability of the occurrence of landslides is higher. The distance-to-river map was calculated in 200 m intervals (Figure 6b).The dominant vegetation species are grasses and shrubs. The vegetation distribution is obtained by SPOT5 images. The vegetation distribution is shown in Figure 6c, and the vegetation is divided into vegetation cover and no cover.
The reservoir belongs to the Daocheng-Gongga Mountain tilted uplift zone (Figure 2), which has been experiencing rapid bedrock uplift since the Quaternary Period. According to the observation data collected from 1970 to 2012, the rate of bedrock uplift could have reached 5.8 ± 1.0 mm a year in this study area [62]. The increase of landslides is proportional to the increase rates of bedrock uplift [63,64]. It is apparent that landslides mainly occur along the banks of the Jinsha River (Figure 1), which means that the interaction of bedrock uplift and river incision contributes to the landslide occurrence. In the active landslide period, the landslides were impacted by the interaction between rapid tectonic uplift and the Jinsha River incision. In this period, the angle of slope increased along the river, as well as the slope potential energy [63]. Burbank [46] considered that the equilibrium was maintained between bedrock uplift and river incision, with landslides allowing hillslopes to adjust efficiently to the rapid river incision. The evidence reflected that a relationship exists between the landslide occurrence and rapid bedrock uplift. The average slope angle among all areas suggested that a common threshold controlled the occurrence of landslides [46]. Additionally, it has often been argued that high rates of bedrock uplift and denudation should be correlated with steep slope angles [65]. This study used the slope angle to represent the influence of the bedrock uplift.
There is a vertical distribution law of precipitation in this area. According to previous studies [66,67], precipitation is proportional to the elevation. The coefficients of tendency increase with increasing elevation, and it is particularly evident in areas above an elevation of 2500 m. The higher elevation enhances the increasing trend of precipitation erosion. The precipitation erosion force change trend coefficient increases by 0.05 for every 500 m increase in elevation. The elevation of the reservoir ranges from 2100 m to 5160 m. In this study, the elevation is divided into six zones based on Liu [67]: (1) 2100 m–2600 m, (2) 2600 m–3100 m, (3) 3100 m–3600 m, (4) 3600 m–4100 m, (5) 4100 m–4600 m and (6) 4600 m–5160 m.
Most of the precipitation stations are distributed from Benzilan to Batang county, rather than along the Jinsha River. Four precipitation stations are distributed along the Jinsha River, as listed in Table 2 [68,69,70]. This study established a linear relationship between the annual precipitation and the elevation (Figure 7). In Figure 7, the blue points represent the data from the four precipitation stations in Table 2. The linear equation is shown as follows:
y = 0.244 e − 157.7 (2100m < e < 5160m)
where y (mm) is the annual precipitation and e (m) is the elevation. The precipitation gradient is 24.4 mm/100 m, in terms of the spatial distribution. The annual precipitation was divided into six zones based on Equation (11):(1) the annual precipitation range in the elevation range of 2100 m to 2600 m is 355 mm to 477 mm; (2) the annual precipitation range in the elevation range of 2600 m to 3100 m is 477 mm to 599 mm; (3) the annual precipitation range in the elevation range of 3100 m to 3600 m is 599 mm to 720 mm; (4) the annual precipitation range in the elevation range of 3600 m to 4100 m is 720 mm to 843 mm; (5) the annual precipitation range in the elevation range of 4100 m to 4600 m is 843 mm to 965 mm; and (6) the annual precipitation range in the elevation range of 4600 m to 5160 m is 965 mm to 1101 mm. The annual precipitation distribution map is shown in Figure 8. Moreover, the landform of the Xulong reservoir is similar to Gongwang Mountain [71], which is located in the north of Yunnan Province along the Jinsha River. The precipitation of Gongwang Mountain is very low, and the precipitation gradient is 24 mm/100 m, which is close to that observed at the study site, that is, 24.4 mm/100 m. Therefore, 24.4 mm/100 m is a reasonable precipitation gradient of the Xulong hydropower station reservoir.

3.3. Data Processing

Note that the AHP–ICM method for the landslide susceptibility mapping is only used for the eight factors: slope angle, slope aspect, curvature, geology, distance-to-fault, distance-to-river, vegetation and bedrock uplift (represented by slope angle). Since the eight-factor comprehensive information content (CIC) and annual precipitation have different ranges, normalizing the eight-factor CIC and the annual precipitation is necessary. This study normalizes the data to (0, 1) on the basis of the following equation:
A = (CICCICmin)/(CICmaxCICmin)
where A is the landslide susceptibility value of the eight factors, CIC is the different unit information content, and CICmax and CICmin are the maximum and minimum comprehensive information contents, respectively.
In this study, the elevation is divided into six zones based on Liu [67]: (1) 2100 m–2600 m, (2) 2600 m–3100 m, (3) 3100 m–3600 m, (4) 3600 m–4100 m, (5) 4100 m–4600 m, and (6) 4600 m–5160 m. The six divisions of annual precipitation are: (1) 355 mm–477 mm, (2) 477 mm–599 mm, (3) 599 mm–720 mm and (4) 720 mm–843 mm, (5) 843 mm–965 mm, and (6) 965 mm–1101 mm. The assignment value is based on the following equation:
V i =   ( r i + r i + 1 ) ( e i + 1 e i ) ( r m a x + r m i n ) ( e m a x e m i n ) ( i = 1 , 2 , , 6 )
where Vi is the assignment value of the annual precipitation pixel; ri is the annual precipitation interpolation; ei is the corresponding elevation; rmax and rmin are maximum and minimum annual precipitation in the study area, respectively; and emax and emin are maximum and minimum elevation in the study area, respectively. As discussed in Section 3.1, the annual precipitation has a linear relationship with the elevation.
The normalization of annual precipitation is calculated by the following equation:
N = (ViVmin)/(VmaxVmin)(i =1,2,…,6)
where N is the normalization of annual precipitation, Vi is the assignment value of the annual precipitation pixel, and Vmax and Vmin are the maximum and minimum assignment values of the annual precipitation, respectively. Eventually, the landslide susceptibility value is calculated by the following equation:
S = ( 1 W r ) × A + W r × N
where S is the eventual landslide susceptibility value, A is the eight-factor assessment value of landslide susceptibility, Wr is the weight of the annual precipitation calculated by AHP, and Ni is the annual precipitation normalization value of the six zones, respectively.

4. Results and Discussion

Many of the factors influencing landslide occurrence could be collected to systematically assess the other areas that might have slope failures. For some areas, this analysis is essential so that people can consult the landslide susceptibility maps to avoid areas of higher landslide risk. In this study, landslide susceptibility maps had been constructed using the analytic hierarchy process and the information content method for the Xulong hydropower station reservoir. A landslide susceptibility map is provided for this area. In the future construction of this hydropower station, this map may help avoid losses in human lives and property.

4.1. Determination of Analytic Hierarchy Process (AHP)Weights

Based on the landslide susceptibility assessment factor system, the hierarchical structure was established. According to previous studies about the relationships between influencing factors and landslides, the judgment matrix of landslide susceptibility assessment is shown in Table 3. Note that this study took nine influencing factors into consideration for landslide susceptibility. However, the influence of the rapid bedrock uplift factor was represented by slope angle (Figure 5a). This study used the slope angle, slope aspect, curvature, geology, distance-to-fault, distance-to-river, vegetation, and annual precipitation for weighting with the AHP method. The feature vector (the weight) was calculated (Table 3). Based on Equations (3) and (4), the CR was calculated; CR = 0.0403, which was less than 0.1. This means that the judgment matrix met the consistency check and weight allocation was reasonable.

4.2. The Information Content (IC) of Eight Factors

Based on Figure 5 and Figure 6, the eight factors were calculated and listed in Table 4. According to Equations (7) and (8), the information contents of units of influencing factors were calculated. If I i < 0 , the landslide occurrence probability of the influencing factor is lower than that of the average probability. When I i = 0 , the landslide occurrence probability of the influencing factor is equal to that of the average probability. If I i > 0 , the landslide occurrence probability of the influencing factor is higher than that of the average probability.
Table 4 shows that for most landslides (72.81%), the slope angle is distributed between 20° and 50°. However, the IC values of 0° to 10°, 10° to 20°, 50° to 60° and 60° to 70° were 0.8997, 0.3498, 0.4180, and 0.2850, respectively. This indicates that the slopes with slope angles of 0° to 20° and 50° to 70° were prone to failure in this study area. The substitution of steeper slopes for gentler slopes is the reason for landslide occurrence, which is a process driven by the rapid bedrock uplift and river incision. This was the most advantageous slope angle condition of landslides. For the slope aspect factor, the highest probabilities of landslide occurrence were mainly in the east, southeast, and south directions. The IC values were 0.5566, 0.3843, and 0.3583, respectively. The north, southwest, and northwest did not develop. Because the slope body of the south is easily loosened and broken under water and heat, the critical slope angle was lower than that of the northern slopes. The curvature of landslides was mainly concave (43.9%) and convex (43.19%), but the IC values were not high. For the landslides in the reservoir, most of the geological formations were composed of Quaternary Period (Q) loess, mud, and gravel, Xiongsong Formation (Pt2) schist, phyllite and marble, and the Devonian to Triassic ophiolite suite. The IC values were 1.3652, 0.3278, and 0.3023, respectively. The landslides along the Jinsha River were widely developed. The Xiongsong Formation (Pt2) geologic suite had a layered fracture structure. Their rock strength was not high, which provided a pre-condition for the occurrence of landslides. Meanwhile, the ophiolite suite had a complicated geologic combination, and its anti-weathering ability was poor. The landslides were mainly distributed within 200 m–600 m of the faults and 0 m–400 m of the river. It could be observed that the farther distance from the river, the smaller the probability of landslides occurrence. The plants on the ground could improve the shear strength of rock and soil mass. The IC values of vegetation cover and no cover were −0.7883 and 0.2879, respectively. This suggests that the ground with no vegetation was more prone to landslides. The eight-factor LSM result is displayed in Figure 9a.

4.3. Landslides Susceptibility Mapping

The weights of the influencing factors were calculated by the AHP. The method for the eight-factor LSM result was based on the ICM, whereas the annual precipitation factor was analyzed separately. Then, the eight-factor LSM was combined with the annual precipitation factor based on Equation (15) for the eventual landslide susceptibility mapping. The eventual landslide susceptibility map was generated through the GIS software and the value scope is 0–0.8533. The discrete result is shown in Figure 9b. The natural break classification scheme was applied for the classification of the landslide susceptibility zones. Recently, the classification method mainly used the natural break classification scheme [72,73,74,75,76]. The landslide susceptibility maps were reclassified into four classes: low (0–0.3323), moderate (0.3323–0.4593), high (0.4593–0.5699), and very high (0.5699–0.8533).
The eventual landslide susceptibility results are shown in Figure 9c. The area of the very high zone was 252.23 km2, accounting for 15.17% of the whole study area (Table 5). This area is mainly distributed in the high elevation areas of Quaternary-aged material. The very high susceptibility zone is not stable and is prone to large-scale landslides. The high susceptibility zone is 479.99 km2, accounting for 34.11% of the whole reservoir. This sub-class basically represents the landslide susceptibility of the whole study area. It is mainly distributed on the left bank of the Jinsha River in the middle elevation areas. The geology of this area was mostly Xiongsong Formation (Pt2X) schist, phyllite, marble, and the Devonian to Triassic ophiolite suite. Middle-large landslides were prone to occur in this zone. The moderate zone was 493.46 km2, accounting for 35.06% of the area. This zone mainly had small-middle scale landslides. However, the moderate zone was mainly distributed in the low elevation area, where the annual precipitation was not as high as the higher elevation area. The rest of the 181.58 km2 was of low susceptibility, that is, landslides were not likely to occur. Overall, approximately 87.1% of the reservoir area may have experienced landslides. It was found that 89.8% of the landslides occurred in areas allocated to the moderate, high and very high areas. The low, moderate, high, and very high zones accounted for 10.2%, 48.92%, 30.12% and 10.46% of the landslide occurrence, respectively. This suggests that the susceptibility mapping of the study area was consistent with the actual consequences. The high and very high susceptibility zones accounted for 52.03% of the Xulong hydropower station reservoir.

4.4. Discussions and Validation

Most of the aforementioned literature used objective methods for LSM, which were mostly based on objective data from field investigation aerial photos. However, regarding the implemented special area, these approaches had limitations, such as obtaining unclear data [35] and the strict demands of the methods. Any incorrect results can easily be conveyed into the weighting assignments. Therefore, solely relying on objective methods has some limitations and can easily lead to misleading information. Based on expert opinion, AHP introduced a degree of subjectivity when used to make comparison judgments. The expert experiences combined with ICM permitted a better flexibility in the landslide susceptibility analysis. The proposed approach retained many advantages that AHP had, especially its hierarchical structure, reduced inconsistency from the pairwise comparison, and the priority vectors generated [77]. The AHP-ICM approach can be applied as a quantitative solution for LSM considering both the priority for landslide susceptibility factors and the objective investigated information. The results using the combination method were superior to those from using the alternative method alone.
It was found that most of the study area was rocky and poorly vegetated. Due to the effects of the vertical distribution law of precipitation, the vegetation also had a vertical distribution law along with precipitation. There was almost no vegetation in the low elevation area, whereas the vegetation at high elevation was widely distributed. The vegetation coverage increased with the elevation because of the higher precipitation.
Precipitation commonly occurred as snowfall during the winter in the high elevation area. Matsuura [78] found that the maximum daily displacements of each year were observed not in snow melting periods, but immediately before or at the beginning of snow cover periods. According to [78], the displacement of a landslide that has a shallow sliding surface in a snowy region was found to be affected by snow accumulation conditions. A slight effect was still observed for landslides in the snow cover period. Snow accumulation is not annual. In warm seasons, the snow melts. In this study, precipitation is considered throughout the whole year. Slope instability appears to be mainly forced by the snow melt accumulated during the winter season, which, in turn, promotes rock and soil water saturation and landslide occurrence in the following spring-summer generated by the snow melt [79]. Yamasaki [80] also considered that precipitation was presented as snowfall, suggesting a possible increase in slope instability because of the more frequent rock water saturation in high elevation areas.
This study introduced an approach for landslide susceptibility mapping considering the vertical distribution law of precipitation in the study area. Figure 9a shows the eight-factor LSM results. It shows that the very high susceptibility zones were mainly distributed in the area covered by Quaternary material. The high susceptibility zones were mainly distributed in the areas of the Xiongsong Formation (Pt2) geologic suite and Ophiolite formation (DTJ). It seemed that the lithology played a dominant role in the LSM. However, based on Table 3, the precipitation was the most important factor influencing landslide occurrence. When taking the vertical distribution of precipitation into consideration, the LSM results became totally different. It is shown in Figure 9c that the susceptibility values of the high elevation areas were higher than those of the low elevation areas. The susceptibility values increased with increasing elevation. It was obvious that the vertical precipitation distribution had a great contribution to the landslide distribution. It should be noted that there were some red belts at the top of the mountain (Figure 9c). The red belts represent the very high susceptibility zones. This pattern followed the vertical distribution law of precipitation.
To validate the accuracy of the results, this study used the evaluation accuracy analysis method as the validation [38]. The equation is as follows:
P = M 1 N 1 × ( M M 1 N N 1 ) 1 / 3
where P is the accuracy of the prediction, N is the total pixel number of the study area, N1 is the pixel number of landslides, M is the pixel number above the critical value of the study area, and M1 is the pixel number of landslides above the critical value. Since all of the moderate, high and very high susceptibility zones yield different sized landslides, this study sets the moderate susceptibility zone as the critical value. The parameters are shown in Table 6.
Based on Equation (16), the prediction accuracy was calculated as P = 85.74%. The prediction accuracy was very high and the landslide susceptibility map using the AHP-ICM evaluation results was reasonable and reliable in terms of the vertical distribution law of precipitation.

5. Conclusions

The preparation of the landslide susceptibility map is one of most important planning agencies for hazard prediction in the reservoir of the Xulong hydropower station. It should be implemented in the process of the hydropower station construction. Based on the field investigation data, this study provided a landslide distribution and data of their basic influencing factors. Among the landslide-related factors, the slope angle, slope aspect, curvature, geology, distance-to-river, distance-to-fault, vegetation, bedrock uplift, and annual precipitation were used for landslide susceptibility mapping.
It has often been argued that the high rates of bedrock uplift and denudation should be correlated with steep slope angles. The rapid bedrock uplift of this area also plays an important role in the slope angle distribution, which directly influences the occurrence of landslides. With the analytic hierarchy process, this study collected the observations and suggestions of many experts and references and established a weighting model of the related factors. The eight factors were analyzed with the information content method, except for annual precipitation.
The evidence shows that a vertical distribution law of precipitation exists in the study area. The precipitation directly determines the occurrence probability of landslides. The ICM cannot reflect the vertical distribution law of precipitation, which represents the characteristics of the implemented area. Analyzing the annual precipitation factor separately can satisfy this condition. The eight-factor landslide susceptibility map was combined with the annual precipitation map for the eventual landslide susceptibility mapping. The landslide susceptibility map was generated and the value scope was 0–0.8533.
Objective methods have been widely used for landslide susceptibility analysis. However, most objective methods have their limitations, which would easily introduce some mistakes in assigning factor weights. The AHP method was useful for many cases because of its ease of applicability and the structure of AHP. This study proposed an approach for integrating an accurate objective method (ICM) with an overall guidance subjective method (AHP) to develop a landslide susceptibility map. The combined method with the advantages of the two methods can obtain accurate results. Moreover, the proposed method permits better flexibility in LSM. GIS was applied to obtain the landslide susceptibility map.
The landslide susceptibility map comprises four classes, including low, moderate, high and very high. These susceptibility zone ratios were 12.9%, 35.06%, 34.11% and 17.92% of the study area, respectively. The precipitation had a great effect on the occurrence of landslides. It was necessary to consider this factor correctly. Since there was a vertical distribution law of precipitation in the study area, the top of the mountain displayed a series of very high susceptibility pixels. The validation results showed that the prediction accuracy was 85.74%, which meant that the susceptibility map was confirmed to be reliable and reasonable. This study could serve as an effective guide for the further construction of the Xulong hydropower station. It also verifies that the method for obtaining the vertical distribution law of precipitation in the study area was appropriate.

Acknowledgments

This work was supported by the State Key Program of National Natural Science of China (Grant No.41330636). Natural Science Foundations of China (Grant No. 41402243). Graduate student innovation fund project of Jilin University (No. 2015013). Thanks to anonymous reviewers for their valuable feedback on the manuscript.

Author Contributions

Chen Cao contributed to data analysis and manuscript writing. Qing Wang and Jianping Chen proposed the main structure of this study. Yunkai Ruan, Lianjing Zheng, Shengyuan Song and Cencen Niu provided useful advice and revised the manuscript. All authors read and approved the final manuscript.

Conflicts of Interest

The authors declare no conflict of interest.

References

  1. Roering, J.J.; Kirchner, J.W.; Dietrich, W.E. Evidence for nonlinear, diffusive sediment transport on hillslopes and implications for landscape morphology. Water Resour. Res. 1999, 35, 853–870. [Google Scholar] [CrossRef]
  2. Malamud, B.D.; Turcotte, D.L.; Guzzetti, F.; Reichenbach, P. Landslides, earthquakes, and erosion. Earth Planet. Sci. Lett. 2004, 229, 45–59. [Google Scholar] [CrossRef]
  3. Kawabata, D.; Bandibas, J. Landslide susceptibility mapping using geological data, a DEM from ASTER images and an artificial neural network (ANN). Geomorphology 2009, 113, 97–109. [Google Scholar] [CrossRef]
  4. Guzzetti, F.; Mondini, A.C.; Cardinali, M.; Fiorucci, F.; Santangelo, M.; Chang, K.-T. Landslide inventory maps: New tools for an old problem. Earth Sci. Rev. 2012, 112, 42–66. [Google Scholar] [CrossRef]
  5. Peruccacci, S.; Brunetti, M.T.; Luciani, S.; Vennari, C.; Guzzetti, F. Lithological and seasonal control on rainfall thresholds for the possible initiation of landslides in central Italy. Geomorphology 2012, 139, 79–90. [Google Scholar] [CrossRef]
  6. Feizizadeh, B.; Blaschke, T. Landslide risk assessment based on GIS multi-criteria evaluation: A case study in Bostan-Abad County, Iran. J. Earth Sci. Eng. 2011, 1, 66–71. [Google Scholar]
  7. Montgomery, D.R.; Dietrich, W.E. A physically based model for the topographic control on shallow landsliding. Water Resour. Res. 1994, 30, 1153–1171. [Google Scholar] [CrossRef]
  8. Van Westen, C.; Van Asch, T.W.; Soeters, R. Landslide hazard and risk zonation—Why is it still so difficult? Bull. Eng. Geol. Environ. 2006, 65, 167–184. [Google Scholar] [CrossRef]
  9. Van Westen, C.J.; Castellanos, E.; Kuriakose, S.L. Spatial data for landslide susceptibility, hazard, and vulnerability assessment: An overview. Eng.Geol. 2008, 102, 112–131. [Google Scholar] [CrossRef]
  10. Corominas, J.; van Westen, C.; Frattini, P.; Cascini, L.; Malet, J.P.; Fotopoulou, S.; Catani, F.; Van Den Eeckhaut, M.; Mavrouli, O.; Agliardi, F.; et al. Recommendations for the quantitative analysis of landslide risk. Bull. Eng. Geol. Environ. 2014, 73, 209–263. [Google Scholar] [CrossRef] [Green Version]
  11. Bi, R.N.; Schleier, M.; Rohn, J.; Ehret, D.; Xiang, W. Landslide susceptibility analysis based on arcgis and artificial neural network for a large catchment in three gorges region, China. Environ. Earth Sci. 2014, 72, 1925–1938. [Google Scholar] [CrossRef]
  12. Li, D.; Yin, K.; Leo, C. Analysis of baishuihe landslide influenced by the effects of reservoir water and rainfall. Environ. Earth Sci. 2010, 60, 677–687. [Google Scholar] [CrossRef]
  13. Can, T.; Nefeslioglu, H.A.; Gokceoglu, C.; Sonmez, H.; Duman, T.Y. Susceptibility assessments of shallow earthflows triggered by heavy rainfall at three catchments by logistic regression analyses. Geomorphology 2005, 72, 250–271. [Google Scholar] [CrossRef]
  14. Lee, S.; Evangelista, D. Earthquake-induced landslide-susceptibility mapping using an artificial neural network. Nat. Hazards Earth Syst. Sci. 2006, 6, 687–695. [Google Scholar] [CrossRef]
  15. Pradhan, B.; Lee, S. Landslide susceptibility assessment and factor effect analysis: Backpropagation artificial neural networks and their comparison with frequency ratio and bivariate logistic regression modelling. Environ. Model. Softw. 2010, 25, 747–759. [Google Scholar] [CrossRef]
  16. Akgun, A. A comparison of landslide susceptibility maps produced by logistic regression, multi-criteria decision, and likelihood ratio methods: A case study at Izmir, Turkey. Landslides 2012, 9, 93–106. [Google Scholar] [CrossRef]
  17. Oh, H.-J.; Park, N.-W.; Lee, S.-S.; Lee, S. Extraction of landslide-related factors from aster imagery and its application to landslide susceptibility mapping. Int. J. Remote Sens. 2012, 33, 3211–3231. [Google Scholar] [CrossRef]
  18. Regmi, A.D.; Devkota, K.C.; Yoshida, K.; Pradhan, B.; Pourghasemi, H.R.; Kumamoto, T.; Akgun, A. Application of frequency ratio, statistical index, and weights-of-evidence models and their comparison in landslide susceptibility mapping in Central Nepal Himalaya. Arab. J. Geosci. 2014, 7, 725–742. [Google Scholar] [CrossRef]
  19. Bui, D.T.; Lofman, O.; Revhaug, I.; Dick, O. Landslide susceptibility analysis in the Hoa Binh province of Vietnam using statistical index and logistic regression. Nat. Hazards 2011, 59, 1413–1444. [Google Scholar] [CrossRef]
  20. Dong, J.J.; Tung, Y.H.; Chen, C.C.; Liao, J.J.; Pan, Y.W. Discriminant analysis of the geomorphic characteristics and stability of landslide dams. Geomorphology 2009, 110, 162–171. [Google Scholar] [CrossRef]
  21. Wang, L.J.; Guo, M.; Sawada, K.; Lin, J.; Zhang, J.C. Landslide susceptibility mapping in Mizunami City, Japan: A comparison between logistic regression, bivariate statistical analysis and multivariate adaptive regression spline models. Catena 2015, 135, 271–282. [Google Scholar] [CrossRef]
  22. Wan, S. A spatial decision support system for extracting the core factors and thresholds for landslide susceptibility map. Eng. Geol. 2009, 108, 237–251. [Google Scholar] [CrossRef]
  23. Liu, S.-H.; Lin, C.-W.; Tseng, C.-M. A statistical model for the impact of the 1999 Chi-Chi earthquake on the subsequent rainfall-induced landslides. Eng. Geol. 2013, 156, 11–19. [Google Scholar] [CrossRef]
  24. Lee, S.; Ryu, J.-H.; Won, J.-S.; Park, H.-J. Determination and application of the weights for landslide susceptibility mapping using an artificial neural network. Eng. Geol. 2004, 71, 289–302. [Google Scholar] [CrossRef]
  25. Gomez, H.; Kavzoglu, T. Assessment of shallow landslide susceptibility using artificial neural networks in Jabonosa River Basin, Venezuela. Eng. Geol. 2005, 78, 11–27. [Google Scholar] [CrossRef]
  26. Caniani, D.; Pascale, S.; Sdao, F.; Sole, A. Neural networks and landslide susceptibility: A case study of the urban area of Potenza. Nat. Hazards 2008, 45, 55–72. [Google Scholar] [CrossRef]
  27. Melchiorre, C.; Matteucci, M.; Azzoni, A.; Zanchi, A. Artificial neural networks and cluster analysis in landslide susceptibility zonation. Geomorphology 2008, 94, 379–400. [Google Scholar] [CrossRef]
  28. Lin, H.-M.; Chang, S.-K.; Wu, J.-H.; Juang, C.H. Neural network-based model for assessing failure potential of highway slopes in the Alishan, Taiwan area: Pre-and post-earthquake investigation. Eng. Geol. 2009, 104, 280–289. [Google Scholar] [CrossRef]
  29. Conforti, M.; Pascale, S.; Robustelli, G.; Sdao, F. Evaluation of prediction capability of the artificial neural networks for mapping landslide susceptibility in the Turbolo River catchment (Northern Calabria, Italy). Catena 2014, 113, 236–250. [Google Scholar] [CrossRef]
  30. Samui, P. Slope stability analysis: A support vector machine approach. Environ. Geol. 2008, 56, 255–267. [Google Scholar] [CrossRef]
  31. Marjanović, M.; Kovačević, M.; Bajat, B.; Voženílek, V. Landslide susceptibility assessment using SVM machine learning algorithm. Eng. Geol. 2011, 123, 225–234. [Google Scholar] [CrossRef]
  32. Xu, C.; Dai, F.; Xu, X.; Lee, Y.H. Gis-based support vector machine modeling of earthquake-triggered landslide susceptibility in the Jianjiang River Watershed, China. Geomorphology 2012, 145, 70–80. [Google Scholar] [CrossRef]
  33. Peng, L.; Niu, R.; Huang, B.; Wu, X.; Zhao, Y.; Ye, R. Landslide susceptibility mapping based on rough set theory and support vector machines: A case of the Three Gorges area, China. Geomorphology 2014, 204, 287–301. [Google Scholar] [CrossRef]
  34. Tehrany, M.S.; Pradhan, B.; Jebur, M.N. Spatial prediction of flood susceptible areas using rule based decision tree (DT) and a novel ensemble bivariate and multivariate statistical models in GIS. J. Hydrol. 2013, 504, 69–79. [Google Scholar] [CrossRef] [Green Version]
  35. Tiwari, M.K.; Chatterjee, C. Uncertainty assessment and ensemble flood forecasting using bootstrap based artificial neural networks (BANNs). J. Hydrol. 2010, 382, 20–33. [Google Scholar] [CrossRef]
  36. Kazakis, N.; Kougias, I.; Patsialis, T. Assessment of flood hazard areas at a regional scale using an index-based approach and analytical hierarchy process: Application in Rhodope-Evros region, Greece. Sci. Total Environ. 2015, 538, 555–563. [Google Scholar] [CrossRef] [PubMed]
  37. Ho, W. Integrated analytic hierarchy process and its applications—A literature review. Eur. J. Oper. Res. 2008, 186, 211–228. [Google Scholar] [CrossRef]
  38. Jade, S.; Sarkar, S. Statistical models for slope instability classification. Eng.Geol. 1993, 36, 91–98. [Google Scholar] [CrossRef]
  39. Saaty, T.L. Modeling unstructured decision problems—The theory of analytical hierarchies. Math. Comput. Simul. 1978, 20, 147–158. [Google Scholar] [CrossRef]
  40. Junior, R.V.; Varandas, S.; Fernandes, L.S.; Pacheco, F. Environmental land use conflicts: A threat to soil conservation. Land Use Policy 2014, 41, 172–185. [Google Scholar] [CrossRef]
  41. Oikonomidis, D.; Dimogianni, S.; Kazakis, N.; Voudouris, K. A GIS/remote sensing-based methodology for groundwater potentiality assessment in Tirnavos area, Greece. J. Hydrol. 2015, 525, 197–208. [Google Scholar] [CrossRef]
  42. Lin, M.-L.; Tung, C.-C. A GIS-based potential analysis of the landslides induced by the Chi-Chi earthquake. Eng. Geol. 2004, 71, 63–77. [Google Scholar] [CrossRef]
  43. Gao, K.; Cui, P.; Zhao, C.; Wei, F. Landslide hazard evaluation of wanzhou based on GIS information value method in the Three Gorges reservoir. Chin. J. Rock Mech. Eng. 2006, 25, 991–996. [Google Scholar]
  44. Du, J.; Yang, Q.; Yan, J. Hazard evaluation of secondary geological disaster based on GISand information value method. Earth Sci. J. China Univ. Geosci. 2010, 35, 324–330. [Google Scholar]
  45. Chen, Y.; Booth, D.C. The Wenchuan Earthquake of 2008: Anatomy of a Disaster; Springer Science & Business Media: New York, NY, USA, 2011. [Google Scholar]
  46. Burbank, D.W.; Leland, J.; Fielding, E.; Anderson, R.S.; Brozovic, N.; Reid, M.R.; Duncan, C. Bedrock incision, rock uplift and threshold hillslopes in the northwestern Himalayas. Nature 1996, 379, 505–510. [Google Scholar] [CrossRef]
  47. Wang, E.; Burchfiel, B.C. Late cenozoic to holocene deformation in southwestern Sichuan and Adjacent Yunnan, China, and its role in formation of the southeastern part of the Tibetan Plateau. Geol. Soc. Am. Bull. 2000, 112, 413–423. [Google Scholar] [CrossRef]
  48. Hungr, O.; Leroueil, S.; Picarelli, L. The varnes classification of landslide types, an update. Landslides 2014, 11, 167–194. [Google Scholar] [CrossRef]
  49. Guzzetti, F.; Reichenbach, P.; Ardizzone, F.; Cardinali, M.; Galli, M. Estimating the quality of landslide susceptibility models. Geomorphology 2006, 81, 166–184. [Google Scholar] [CrossRef]
  50. Kanungo, D.; Arora, M.; Sarkar, S.; Gupta, R. A comparative study of conventional, ann black box, fuzzy and combined neural and fuzzy weighting procedures for landslide susceptibility zonation in Darjeeling Himalayas. Eng.Geol. 2006, 85, 347–366. [Google Scholar] [CrossRef]
  51. Yalcin, A. Gis-based landslide susceptibility mapping using analytical hierarchy process and bivariate statistics in Ardesen (Turkey): Comparisons of results and confirmations. Catena 2008, 72, 1–12. [Google Scholar] [CrossRef]
  52. Akgun, A.; Sezer, E.A.; Nefeslioglu, H.A.; Gokceoglu, C.; Pradhan, B. An easy-to-use MATLAB program (Mamland) for the assessment of landslide susceptibility using a Mamdani fuzzy algorithm. Comput. Geosci. UK 2012, 38, 23–34. [Google Scholar] [CrossRef]
  53. Mohammady, M.; Pourghasemi, H.R.; Pradhan, B. Landslide susceptibility mapping at Golestan Province, iran: A comparison between frequency ratio, Dempster–Shafer, and weights-of-evidence models. J. Asian Earth Sci. 2012, 61, 221–236. [Google Scholar] [CrossRef]
  54. Pradhan, B.; Chaudhari, A.; Adinarayana, J.; Buchroithner, M.F. Soil erosion assessment and its correlation with landslide events using remote sensing data and GIS: A case study at Penang Island, Malaysia. Environ. Monit. Assess. 2012, 184, 715–727. [Google Scholar] [CrossRef] [PubMed]
  55. Roodposhti, M.S.; Rahimi, S.; Beglou, M.J. PROMETHEE II and fuzzy AHP: An enhanced GIS-based landslide susceptibility mapping. Nat. Hazards 2014, 73, 77–95. [Google Scholar] [CrossRef]
  56. Chue, Y.S.; Chen, J.W.; Chen, Y.R. Rainfall-induced slope landslide pontential and landslide distribution characteristics assessment. J. Mar. Sci. Technol. Taiwan 2015, 23, 705–716. [Google Scholar]
  57. Kritikos, T.; Davies, T. Assessment of rainfall-generated shallow landslide/debris-flow susceptibility and runout using a GIS-based approach: Application to western Southern Alps of New Zealand. Landslides 2015, 12, 1051–1075. [Google Scholar] [CrossRef]
  58. Lee, M.J.; Park, I.; Won, J.S.; Lee, S. Landslide hazard mapping considering rainfall probability in Inje, Korea. Geomat. Nat. Hazard Risk 2016, 7, 424–446. [Google Scholar] [CrossRef]
  59. Kirschbaum, D.; Adler, R.; Adler, D.; Peters-Lidard, C.; Huffman, G. Global distribution of extreme precipitation and high-impact landslides in 2010 relative to previous years. J. Hydrometeorol. 2012, 13, 1536–1551. [Google Scholar] [CrossRef]
  60. Ayalew, L.; Yamagishi, H. The application of Gis-based logistic regression for landslide susceptibility mapping in the Kakuda-Yahiko Mountains, Central Japan. Geomorphology 2005, 65, 15–31. [Google Scholar] [CrossRef]
  61. Oh, H.-J.; Pradhan, B. Application of a neuro-fuzzy model to landslide-susceptibility mapping for shallow landslides in a tropical hilly area. Comput. Geosci. UK 2011, 37, 1264–1276. [Google Scholar] [CrossRef]
  62. Hao, M.; Wang, Q.; Shen, Z.; Cui, D.; Ji, L.; Li, Y.; Qin, S. Present day crustal vertical movement inferred from precise leveling data in eastern margin of Tibetan Plateau. Tectonophysics 2014, 632, 281–292. [Google Scholar] [CrossRef]
  63. Deng, L.-Q.; Wamg, X.-P. Relationship between neotectonism and landslides in Reservoir area of three-gorges project on Yangtze River. J. Eng. Geol. 2000, 8, 136–141. [Google Scholar]
  64. Zhang, X.-J.; Zeng, Q.-L.; Ma, Y.-S. Basic characteristics of the differential uplift of the yulong-haba block and its geological hazard effects. Geol. China 2006, 5, 1075–1082. [Google Scholar]
  65. Simons, M. The Morphological Analysis of Landforms: A New Review of the Work of Walther Penck (1888–1923); JSTOR: New York, NY, USA, 1962. [Google Scholar]
  66. Gouvas, M.; Sakellariou, N.; Xystrakis, F. The relationship between altitude of meteorological stations and average monthly and annual precipitation. Stud. Geophys. Geod. 2009, 53, 557–570. [Google Scholar] [CrossRef]
  67. Liu, B.-T.; Tao, H.-P.; Song, C.-F. Temporal and spatial variations of rainfall erosivity in southwest China from 1960 to 2009. Adv. Earth Sci. 2012, 27, 499–509. [Google Scholar]
  68. Huang, Y.; Li, Z.-S. Analysis of little rainfall of dry valley in low latitude area. Res. Water Resour. 2006, 27, 1–3. [Google Scholar]
  69. Shan, B. Reservoir Bank Geological Disaster Susceptibility Assessment and Study on Zoning of Disaster Risk in Benzilan Water-Source Reservoir Area Based on 3s Technology. Ph.D. Thesis, Jilin University, Changchun, China, 2014. [Google Scholar]
  70. Li, L.-Q.; Xiong, L.-H.; Jiang, C.; Zhang, H.-G. Impact of air temperature on annual runoff of batang station in the headstream of Yangtze River. Resour. Environ. Yangtze Basin 2015, 24, 1142–1149. [Google Scholar]
  71. Wu, L.-Q.; Li, X.-H. Analysis on change of annual precipitation with altitude in high mountain areas. Yunnan Geogr. Environ. Res. 2004, 2, 4–7. [Google Scholar]
  72. Falaschi, F.; Giacomelli, F.; Federici, P.R.; Puccinelli, A.; Avanzi, G.D.; Pochini, A.; Ribolini, A. Logistic regression versus artificial neural networks: Landslide susceptibility evaluation in a sample area of the Serchio River Valley, Italy. Nat. Hazards 2009, 50, 551–569. [Google Scholar] [CrossRef]
  73. Bednarik, M.; Magulova, B.; Matys, M.; Marschalko, M. Landslide susceptibility assessment of the kralovany-liptovsky mikulas railway case study. Phys. Chem. Earth 2010, 35, 162–171. [Google Scholar] [CrossRef]
  74. Constantin, M.; Bednarik, M.; Jurchescu, M.C.; Vlaicu, M. Landslide susceptibility assessment using the bivariate statistical analysis and the index of entropy in the Sibiciu Basin (Romania). Environ. Earth Sci. 2011, 63, 397–406. [Google Scholar] [CrossRef]
  75. Pourghasemi, H.R.; Mohammady, M.; Pradhan, B. Landslide susceptibility mapping using index of entropy and conditional probability models in GIS: Safarood Basin, Iran. Catena 2012, 97, 71–84. [Google Scholar] [CrossRef]
  76. Pourghasemi, H.R.; Jirandeh, A.G.; Pradhan, B.; Xu, C.; Gokceoglu, C. Landslide susceptibility mapping using support vector machine and GIS at the Golestan Province, Iran. J. Earth Syst. Sci. 2013, 122, 349–369. [Google Scholar] [CrossRef] [Green Version]
  77. Feizizadeh, B.; Roodposhti, M.S.; Jankowski, P.; Blaschke, T. A GIS-based extended fuzzy multi-criteria evaluation for landslide susceptibility mapping. Comput. Geosci. UK 2014, 73, 208–221. [Google Scholar] [CrossRef] [PubMed]
  78. Matsuura, S.; Asano, S.; Okamoto, T.; Takeuchi, Y. Characteristics of the displacement of a landslide with shallow sliding surface in a heavy snow district of Japan. Eng. Geol. 2003, 69, 15–35. [Google Scholar] [CrossRef]
  79. Moreiras, S.; Lisboa, M.S.; Mastrantonio, L. The role of snow melting upon landslides in the central Argentinean Andes. Earth Surf. Proc. Landf. 2012, 37, 1106–1119. [Google Scholar] [CrossRef]
  80. Yamasaki, S.; Nagata, H.; Kawaguchi, T. Long-traveling landslides in deep snow conditions induced by the 2011 Nagano Prefecture Earthquake, Japan. Landslides 2014, 11, 605–613. [Google Scholar] [CrossRef]
Figure 1. Geographical position of the reservoir area of Xulong hydropower station.
Water 08 00270 g001
Figure 2. Regional neotectonic movement zoning map: I: Zhongdian-Yulong-jokul rapid uplift zone; II: The western of Sichuan rapid uplift zone; II1: Gajinjokul strong rapid uplift zone; II2: Daocheng-Gongga mountain tilted uplift zone; III: Qiangtang-Changdu rapid uplift zone; III1: Bijiang-Baoshan tilted uplift zone; III2: Changdu fault block uplift zone; IV: Nianqingtanggula-Gaoligong mountain fault block uplift zone; A: The Jinsha River; B: The Lancang River, C: The Nu River.
Water 08 00270 g002
Figure 3. Landslide inventory in the study area.
Water 08 00270 g003
Figure 4. The digital elevation model of reservoir in Xulong hydropower station.
Water 08 00270 g004
Figure 5. Influencing factors maps of the study area: (a) slope angle; (b) slope aspect; (c) curvature; and (d) geology.
Water 08 00270 g005
Figure 6. Influencing indicators maps of the study area: (a) distance-to-fault; (b) distance-to-river; and (c) vegetation.
Water 08 00270 g006
Figure 7. The relationship between elevation and annual precipitation based on the four meteorological stations.
Water 08 00270 g007
Figure 8. The annual precipitation classification of the study area.
Water 08 00270 g008
Figure 9. Landslide susceptibility map results using the new approach: (a) eight-factor LSM results; (b) LSM discrete results; and (c) LSM classification results.
Water 08 00270 g009
Table 1. Consistency random factor (RI).
m3456789101112
RI0.580.901.121.241.321.411.451.491.521.54
Table 2. Annual precipitation measured by precipitation stations along the upstream of the Jinsha River at different elevation.
Precipitation StationLongitudeLatitudeElevation/mAnnual Precipitation/mmData Resources/year
Benzilan99°17’28°17’20233081965–1988
Shangqiaotou99°24’28°10’2040369.681961–2004
Batang99°06’30°00’2590474.41960–2012
Dege98°35’31°48’3184619.811960–2012
Table 3. The analytic hierarchy process judgment matrix and influencing factor weights.
HeadingX1X2X3X4X5X6X7X8Weights
X1112446780.2803
X2112335670.2452
X31/21/21334560.1800
X41/41/31/3113450.0948
X51/41/31/3113450.0948
X61/61/51/41/31/21230.0482
X71/71/61/51/41/31/2120.0329
X81/81/71/61/51/41/31/210.0237
Notes: X1: precipitation; X2: lithology; X3: slope angle; X4: distance-to-river; X5: distance-to-fault; X6: vegetation; X7: slope curvature; X8: slope aspect.
Table 4. Distribution of the training pixels.
FactorClassLandslide Not OccurredLandslide OccurredTotal CountInformation Content
CountRatio/%CountRatio/%
Slope Angle (Rapid Bedrock Uplift)/°0–101,858,7233.36110,0248.561,968,7470.8997
10–205,788,72710.48192,87615.015,981,6030.3498
20–3014,993,60327.14326,07325.3815,319,676–0.0656
30–4022,210,92440.21389,65130.3322,600,575–0.2763
40–509,069,97316.42219,55117.099289,5240.0391
50–601,195,6552.1642,7503.331,238,4050.4180
60–70118,7230.2137000.29122,4230.2850
>70157200015720
Slope AspectFlat499,2510.0112,6480.01511,8990.1861
North6,890,5970.1290,2230.076,980,820−0.5644
Northeast5,660,1240.10138,1290.115,798,2530.0470
East6,459,4190.12266,7250.216,726,1440.5566
Southeast6,699,4680.12231,3210.186,930,7890.3843
South6,775,6010.12227,7480.187,003,3490.3583
Southwest6,890,4290.1214,2620.016,904,691−2.3973
West7,870,2010.14168,5620.138,038,763−0.0806
Northwest7,492,7960.14135,0020.117,627,798−0.2501
CurvatureConcave23,966,88143.39563,96943.9024,530,8500.0115
Flat5,947,54610.77165,78112.906,113,3270.1766
Convex25,323,47545.84554,87843.1925,878,353−0.0582
GeologyQ2,451,0974.44239,01218.612,690,1091.3652
K4,718,960.8500471,8960.0000
T16,883,87130.57160,52612.517,044,397−0.8791
P7,619,94913.7919,6291.537,639,578−2.1783
DTJ12,172,39422.04395,71930.812,568,1130.3278
D2q491,5120.8900491,5120.0000
Pt2X13,753,46924.90435,50833.914,188,9770.3023
Intrusive rock1,393,8832.5234,1422.661,428,0250.0527
Distance-to-Fault/m0-2005,488,20724.54170,37116.075,658,578−0.4073
200–4005,129,12122.93298,30328.145,427,4240.1945
400–6004,465,69819.97300,73928.374,766,4370.3326
600–8003,871,12317.31181,96917.174,053,092−0.0077
800–10003,412,90115.26108,54810.243,521,449−0.3837
Distance-to-River/m0–2007,180,37828.70424,59537.737,604,9730.2602
200–4006,451,04825.79345,49230.706,796,5400.1665
400–6006,005,60624.01211,14618.766,216,752−0.2368
600–8005,378,63121.50144,18112.815,522,812−0.5000
VegetationCover21,230,45838.44221,76917.2621,452,227−0.7883
No cover34,006,78961.561,063,50082.7435,070,2890.2879
Table 5. Statistical results of LSM in the Xulong hydropower station reservoir.
SusceptibilityLandslide OccurredTotal Study Area
CountRatio (%)Area (km2)CountRatio (%)Area (km2)
Low131,02710.203.287,263,25112.90181.58
Moderate628,50448.9215.7119,738,35235.06493.46
High390,77430.129.7719,199,91534.11479.99
Very High134,42210.463.3610,089,27717.92252.23
Table 6. The evaluation results accuracy analysis.
Susceptibility DegreeMNM1N1P
Moderate19,738,35256,290,795628,5041,284,72785.74%
High19,199,915390,774
Very High10,089,277134,422
Counts Number49,027,5441,153,700

