Published online Feb 21, 2014. doi: 10.3748/wjg.v20.i7.1807
Revised: September 13, 2013
Accepted: October 14, 2013
Published online: February 21, 2014
AIM: To explore lipocalin-2 (LCN-2) expression and its possible role and mechanism(s) of production in rat models of diet-inducible fatty liver.
METHODS: Fatty liver was triggered in male Sprague-Dawley rats fed either with liquid Lieber-DeCarli (LDC) or LDC + 70% cal fructose (L-HFr) diet for 4 or 8 wk. Chow-nourished animals served as controls. Hepatic expression of LCN-2 and other metabolic and inflammatory mediators was assessed by quantitative reverse transcription polymerase chain reaction and Western blotting. Serum LCN-2, fasting leptin, and lipid profile were evaluated via Enzyme-Linked Immunosorbent Assay, Radioimmunoassay, and colorimetric assays, respectively. The localization of LCN-2 in the liver was detected by using immunofluorescence staining. Furthermore, HE stain was used to evaluate hepatic fat degeneration and inflammation.
RESULTS: Both LDC-fed and L-HFr-fed rat histologically featured fatty liver. In the liver, mRNA transcriptions of Mcp-1, a2-m, Il-8 and Glut5 were increased in the L-HFr group at both time points (P < 0.001), while the transcription of Tlr4, Inos, and Tnf-α was significantly up-regulated at week 4. Interestingly, hepatic Lcn-2 expression was 90-fold at week 4 and 507-fold at week 8 higher in L-HFr-subjected rats vs control (P < 0.001). In contrast to HDL-cholesterol, systemic levels of LCN-2, fasting leptin and triglycerides were elevated in the L-HFr regimen (P < 0.001). Moreover, protein expression of hepatic LCN-2, CD14, phospho-MAPK, caspase-9, cytochrome c and 4-hydroxynonenal was increased in the L-HFr group. Conversely, the hepatic expression of PGC-1α (a mitochondrial-biogenic protein) was reduced in the L-HFr category at week 8. The localization of LCN-2 in the liver was predominantly restricted to MPO+ granulocytes.
CONCLUSION: Fructose diet up-regulates hepatic LCN-2 expression, which correlates with the increased indicators of oxidative stress and mitochondrial dysfunction. The LCN-2 may be involved in liver protection.
Core tip: Both Lieber-DeCarli (LDC) and LDC + 70% cal fructose (L-HFr) models featured fatty liver. Fructose-enriched regimen induced metabolic syndrome in the corresponding rats. Lipocalin-2 (LCN-2) was strikingly increased in the liver and serum of the L-HFr group. In this group, the increase of LCN-2 synthesis was associated with inflammation at week 4, whereas the peak value of LCN-2 at week 8 was mainly accompanied by impairment of the mitochondrial function. Nevertheless, an interaction coexists between both processes. The indicators of stress conditions and apoptosis were elevated at both time points. Evidently, the expression of LCN-2 was correlated to inflammatory and metabolic processes.
- Citation: Alwahsh SM, Xu M, Seyhan HA, Ahmad S, Mihm S, Ramadori G, Schultze FC. Diet high in fructose leads to an overexpression of lipocalin-2 in rat fatty liver. World J Gastroenterol 2014; 20(7): 1807-1821
- URL: https://www.wjgnet.com/1007-9327/full/v20/i7/1807.htm
- DOI: https://dx.doi.org/10.3748/wjg.v20.i7.1807
Non-alcoholic fatty liver disease (NAFLD) is presently the most prominent form of chronic liver diseases affecting people at different ages[1]. This entity is also considered as the hepatic manifestation of metabolic disorders including insulin resistance (IR) and dyslipidemia[2]. The prevalence of NAFLD is increasing among the population of Western countries[3]. However, the pathogenesis of NAFLD remains poorly understood, and therapeutic options are quite limited.
There is strong evidence that the diet may affect the development of NAFLD[4]. Fructose is a monosaccharide which is commonly used as a sweetener, e.g., high fructose corn syrups. Industrially, it is frequently found in soft drinks and pre-packaged foods[5]. A correlation is observed between dietary fructose intake and the prevalence of metabolic syndrome and fatty liver[6].
Unlike glucose, which is widely used by tissues throughout the body, fructose is primarily metabolized in the liver, and it facilitates oxidative damage and lipid peroxidation[7]; a process in which unsaturated lipids become oxidatively degraded to a variety of products at sites of inflammation. One of the end products of lipid peroxidation is 4-hydroxynonenal (4-HNE) which exhibits a chemotactic activity toward neutrophils[8]. In mice, a chronic moderate fructose intake was shown to be associated with an increased translocation of lipopolysaccharide (LPS, endotoxin) from the gut into the portal vein, as a result of bacterial overgrowth and increased intestinal permeability, additionally. This may cause a further activation of hepatic Kupffer cells and formation of reactive oxygen species (ROS) in the liver and an induction of hepatic TNF-α expression via nuclear transcription factor κB (NF-κB)[9].
The lipocalin family in general plays the role of transporters with various functions, e.g., regulation of immune responses[10], and in binding of small lipophilic substances (e.g., arachidonic acid, iron, and lipids)[11]. Lipocalin-2 (LCN-2) is a 25-kDa secretory glycoprotein initially identified in human neutrophils[12] and cells that are exposed to microorganisms, and it is abundantly present in the circulation[13]. It was demonstrated that the liver is the main source of serum LCN-2[14]. The latter plays a key role in implementing the acute-phase response[15], and in the regulation of apoptosis[16].
Interestingly, LCN-2 has been characterized as a critical regulator of energy metabolism, glucose and lipid homeostasis, and IR in LCN-2-deficient mice[17]. It was reported that LCN-2 suppression could attenuate obesity-induced IR[18]. In human beings, elevated serum LCN-2 concentration was also observed among diabetic patients, and this increase could be reversed by the insulin-sensitizing drug rosiglitazone[19]. As most in vivo models involved in LCN-2 studies used genetically modified mice like Lcn-2-/-, ob/ob, and db/db[18-21], there are few studies regarding to LCN-2 in rat fatty liver models especially when caused by fructose.
Based on the current background, we hypothesized that dietary fructose-caused oxidative stress and gut-derived endotoxin could trigger hepatic LCN-2 expression in nutritionally induced (non-genetically modified) rat fatty liver models. We also assumed that LCN-2 may have hepatoprotective effects. Thus, we comparatively investigated LCN-2 expression in two rat fatty liver models under effects of different diets, to explore the mechanism(s) of LCN-2 induction and its relationship with inflammatory response and metabolism.
Fructose and skim milk were purchased from AppliChem, Darmstadt, Germany; the chow and Lieber-DeCarli (LDC) diets, ssniff Spezialdiäten GmbH, Germany; Qiagen RNeasy Mini Kit, Qiagen GmbH, Germany; Moloney murine leukemia virus reverse transcriptase (M-MLV RT), Promega, Germany; SYBRGreen master mix, TaqMan and stepOne software, AB, Applied Biosystems, Germany; Complete Protease Inhibitor Cocktail Tablets, Roche, Germany; Hyoid-ECL nitrocellulose membranes, Habersham Biosciences, Buckinghamshire, United Kingdom. ECL chemiluminescent solutions A and B were from GE Healthcare, United States; Lipocalin-2 Enzyme-Linked Immunosorbent Assay (ELISA), Bioporto Diagnostics Kit 046, Gentofte, Denmark; microtome, Microm HM325, Thermo Scientific, Germany; and 4,6-diamidino-2-phenylindole (DAPI) were from Molecular Probes Europe BV, Germany; Fluoromount-G, 0100-01, Southern Biotech. The Netherlands; Rabbit serum, Dako, Glostrup, Denmark; Ponceau S, SERVA Electrophoresis GmbH, Heidelberg, Germany; leptin, Radioimmunoassay (RIA) kit, was from Millipore, United States.
Healthy male Sprague-Dawley rats (160-180 g) were used. All animals were purchased from Charles River, Sulzfeld, Germany. On arrival at facility, the rats were placed immediately into their respective experimental conditions. For house acclimatization, the rats were provided with standard chow diet and tap water for 4 d ad libitum. To facilitate measures of food intake and to promote minimal sedentary movement patterns; the rats were maintained individually in conventional cages in a 12:12 h light-dark cycle and hygienically controlled room. Ethically, all animals received humane care within the provision of the German Law on the Protection of Animals and the institutional guidelines. All animal experiments were approved by the ethics review board and supervised by the local ethics commission.
Animals were randomly allocated (n = 4 per group/time point) as follows: oval chow pellets [control (Co)] group, modified liquid LDC group which is also called high-fat diet[22], and LDC + high (70% cal) fructose (L-HFr) group. The animals were allowed access to a pre-weighed amount of food for 4 or 8 wk. Amounts of consumed food were recorded daily, while animals’ body weights (BW) were measured weekly throughout the study. The animals were deprived of any food 10 h before being euthanized.
The animals were weighed and euthanized using sodium pentobarbital (Narcoren®, Merial GmbH, Hallbergmoos, Germany) (0.2 mL per 100 g BW ip). Under deep anesthesia, blood was withdrawn from inferior vena cava in plain (serum) and heparinized (plasma) tubes. Subsequently, livers were excised, weighed, and quickly dipped in physiological saline. Then, three portions of different liver lobes of each animal were fixed in 4:1% neutral-buffered formalin: glutaraldehyde for paraffin embedding. Alternatively, liver pieces were snap-frozen in liquid nitrogen and stored at -80 °C until use. Relative liver weights (RLW) were expressed as a percentage of the ratio of absolute liver weight (g), divided by the total BW (g) at the time of sacrifice multiplied by 100.
Liver tissues RNA were isolated by Qiagen RNeasy Mini Kit. Extracted RNA concentrations were spectrophotometrically measured at λ = 260 nm, and RNA’s purity was controlled by the ratio of optical density (OD) OD260/OD280 nm and its integrity by 1.2% agarose gel electrophoresis.
DNase-treated total cellular RNA (1 μg) was denatured at 65 °C for 10 min in a total volume of 10 μL with RNase inhibitor. Thereafter, a master mix consisting of 100 nmol/L of dNTPs, 50 pmol/L of primer oligo(dT)15, 200 units of M-MLV RT, 1× RT buffer, and 2.5 mL of 0.1 mol/L dithiothreitol was added to the denatured RNA samples and incubated for reverse transcription at 40 °C for 1 h, and 72 °C for 10 min. Complementary DNA (cDNA) was ready to use after addition of 120 μL deionized H2O.
Primers (Table 1) that had been checked for potential hairpin formation and potential self-annealing were synthesized by Invitrogen. A 1 μL cDNA of each sample was added to 9 μL mixture of targeted primer-pair and Fast Platinum SYBR® Green Universal master mix. Predesigned TaqMan assay was used for Inos and Tlr4 analysis, and the protocol was set according to the manufacturer. Ubiquitin C (Ubc) and β-actin (Actb) were designed as endogenous references (housekeeping genes). The amplification of a total 10 μL/well was performed in duplicate through two-step cycling (95 °C-60 °C) for 40 cycles in a stepone plus quantitative real time reverse transcription polymerase chain reaction (RT-PCR) detection system, following the instructions of the supplier. The comparative CT-method was used to determine the amount of target gene, normalized to the housekeeping genes and relative to a calibrator (2-ΔΔCT)[23]. The purity of the RT-PCR products was verified by melting curves. For conventional PCR, 10 ng cDNA was used for Lcn-2 and Actb study, and then the products were run in 1.1% agarose gel and photographed.
| Name | Forward 5’-3’ | Reverse 5’-3’ |
| Lcn-2 | GGAATATTCACAGCTACCCTC | TTGTTATCCTTGAGGCCCAG |
| Il-8 | GTGTCCCCAAGTAATGGAGAA | CGCCTACCATCTTTAAACTGC |
| α2-m | CTGTCACTCATCCTGTTGTC | ATCTCCTTCTTCGTGTCCTG |
| Glut5 | TGCAGAGCAACGATGGAGAAA | ACAGCAGCGTCAGGGTGAAG |
| Tnf-α | AAATGGGCTCCCTCTCATCAGTTC | TCTGCTTGGTGGTTTGCTACGAC |
| Mcp-1 | CTCACCTGCTGCTACTCATTCACT | TTCCTTATTGGGGTCAGCAC |
| Lep-r | GTTCTGGCCATCAATTCCAT | GCCCTCTGGTTGCTTTGTAT |
| Actb | ACCACCATGTACCCAGGCATT | CCACACAGAGTACTTGCGCTCA |
| Ubc | CACCAAGAAGGTCAAACAGGAA | AAGACACCTCCCCATCAAACC |
Liver samples were prepared from the studied rats, and they were homogenized individually in ice-cold lysis buffer [containing 150 mmol/L sodium chloride, 10% (v/v) glycerol, 1 mmol/L MgCl2, 1 mmol/L CaCl2, 1% (v/v) Nonidet P-40, and 20 mmol/L Tris/HCl buffer, pH 7.5], a fresh Complete Protease Inhibitor Cocktail Tablets, phosphatase inhibitors, and 100 μg/mL of phenylmethanesulfonyl fluoride were added. Hepatic and serum proteins were quantified by Bradford method[24].
As much as 50 μg of whole lysate was separated by (4%-12%) sodium dodecyl sulphate polyacrylamide gel electrophoresis (SDS-PAGE). Proteins were then electroblotted onto Hybond-ECL nitrocellulose membranes, and equal loading was monitored in Ponceau S stain. Subsequently, non-specific binding sites on the membranes were blocked at room temperature for 1.5 h in 5% (w/v) skim milk and 0.1% (v/v) Tween-20 in PBS (PBS-T), and incubated with the first antibodies overnight on agitated plates at 4 °C. Subsequently, the membranes were washed 3 times for 5 min with PBS-T and incubated with appropriate horseradish peroxidase-conjugated secondary antibodies. Immunodetection was performed according to the ECL chemiluminescent solutions A and B Western blotting protocol. Antibodies that were used in the present study are listed in Table 2. Immunoreaction signals were viewed with enhanced chemiluminescence using a film processor machine. All Western blot experiments were performed in triplicate. The uniformity of protein loading in each lane was assessed by determining the signal of β-actin as a loading control.
| Name | Clone | Species | Company | Dilution | Use |
| HNE | PC | Rabbit | Abcam | 1:100 | WB |
| LCN-2 | MC | Mouse | Novus biological | 1:250 | WB |
| PC | Goat | R&D | 1:100 | IF | |
| GRP-78 | PC | Rabbit | Novus Biocompare | 1:800 | WB |
| CD14 | PC | Rabbit | Antibodies-online | 1:700 | WB |
| Casp 9 | PC | Rabbit | Chemicon international | 1:1200 | WB |
| Cyt c | MC | Mouse | Millipore | 1:600 | WB |
| PGC-1α | Goat | Abcam | 1:200 | WB | |
| IκB1α | MC | Rabbit | Abcam | 1:10000 | WB |
| β-actin | MC | Mouse | Sigma Aldrich | 1:5000 | WB |
| MPO | PC | Rabbit | Dako, A0398 | 1:100 | IF |
| ED1 | MC | Mouse | AbD Serotec | 1:100 | IF |
| Anti-rabbit-HRP | PC | Swine | Dako | 1:1500 | WB |
| Anti-mouse-HRP | PC | Rabbit | Dako | 1:1500 | WB |
| AlexaFluor-555-conjugated anti-goat IgG | Donkey | Invitrogen | 1:500 | IF | |
| AlexaFluor-488-conjugated anti-mouse IgG | Donkey | Invitrogen | 1:500 | IF | |
| AlexaFluor-488-conjugated anti-rabbit IgG | Donkey | Invitrogen | 1:500 | IF |
After an overnight (10 h) fasting, the collected rat heparinized blood was centrifuged at 3500 g for 15 min at 4 °C. The concentrations of glucose, uric acid, total cholesterol, TG, high-density lipoprotein-containing cholesterol (HDL-C), LDL-C as well as the activity of ALT and AST were determined in harvested plasma by utilizing the automated systems of the central laboratory of the Institute of Clinical Chemistry in University Medical Center Goettingen. Serum leptin levels were evaluated by RIA.
Hemolysis-free sera were stored at -80 °C. ELISA was conducted to assess the levels of LCN-2 in the serum specimens according to the supplier’s instructions. LCN-2 concentrations were expressed in ng/mL. The amount of LCN-2 was further validated by Western immunoblotting. Rat sera (75 μg protein) samples were denatured at 95 °C for 5 min in reducing 3 × Laemmli's loading buffer and subjected to standard Western-blot with an affinity-purified mouse monoclonal antibody raised against rat LCN-2 protein.
Paraffin-embedded liver slices of 5 μm thickness were cut transversely into serial sections by using a microtome. Sections were then deparaffinized in xylene, rehydrated through an ascending ethanol series and stained automatically with haematoxylin-eosin (HE). After mounting with xylene-based media; a pathologist had carried out the histological examination by using a light microscope (Olympus BX43, Hamburg, Germany) with internal digital camera (Olympus DP21) having no information about the previous treatments of the rats.
Immunofluorescence was used to detect the localization of the target antigens within liver tissue. Liver cryostatic sections (5 μm) were air-dried and fixed in methanol/acetone for 9:1 min at -20 °C. After blocking of non-specific binding with serum (according to the species of the secondary antibody) for 1 h at room temperature; the sections were incubated with a solution of primary antibody anti-LCN-2 combined with either ED1 (CD68) or myeloperoxidase (MPO) overnight at 4 °C. In parallel, negative controls immunostainings were performed by replacing the primary antibodies with only PBS[25]. Alexa flour-conjugated secondary antibodies were used to detect the primary antibodies (Table 2). Cells’ Nuclei of the stained sections were marked by DAPI and the slides were covered with Fluoromount-G and observed using an epifluorescence microscope (Axiovert 200M, Zeiss, Jena, Germany).
Data were analyzed by using GraphPad Prism 5 software (San Diego, CA, United States) and described as mean ± SEM. Statistical significance was calculated by one-way analysis of variance (ANOVA) (Dunnett’s post-hoc test) to examine the statistical significance amongst experimental groups vs control. The null hypothesis was rejected when P < 0.05.
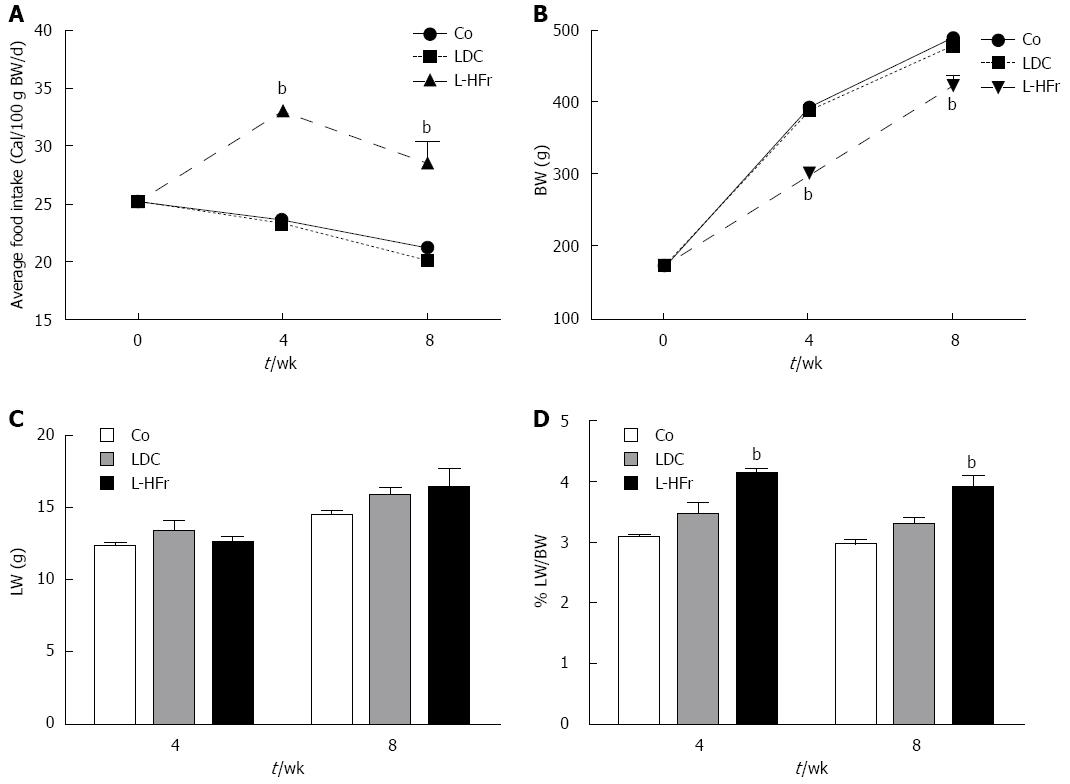
Fatty liver was induced either with LDC diet or fructose-enriched diet (L-HFr) for 4 or 8 wk. Chow diet served as control. The average of basal food intake (week 0) was 25.2 ± 0.5 cal/100 g BW/d for all animals. The food intake of controls was slightly declined at week 4 (23.5 ± 0.1) and week 8 (21.2 ± 0.1). There was no noticeable difference in food intake between Co and LDC groups. Instead, a significant increase of food intake was observed in the L-HFr group at week 4 (33.5 ± 0.7 cal/100 g BW/d) and week 8 (29.0 ± 0.2 cal/100 g BW/d) (Figure 1A).
The phenotypes of the animals were characterized to observe the effect of the diets on the BW gain and liver weight (LW). The BW of the controls was 160-180 g at week 0, and then it increased to 393 ± 5 g at week 4 and 489 ± 7 g at week 8. The BW of chow and LDC-nourished rats were comparable over the study.
Despite markedly higher total caloric intake in high fructose-challenged rats, the absolute BW was significantly diminished at week 4 (300 ± 7 g; P < 0.001) and week 8 (420 ± 16 g; P < 0.001). This implies that the BW of L-HFr treated rats was reduced 30% and 15% relative to the corresponding control rats (Figure 1B). However, these animals behaviorally remained active and did not show any sign of distress.
In general, the LW of both treated animal groups was moderately higher than littermate controls (Figure 1C). LW of Co group was 12.3 ± 3 g at week 4 and 14.5 ± 0.3 g at week 8, while in LDC group LW was 13.1 ± 0.7 at week 4 and 15.7 ± 0.5 g at week 8. In addition, the LW of L-HFr regimen was 12.6 ± 0.4 g and 16.4 ± 1.0 g at weeks 4 and 8, respectively.
Consequently, RLW was high in both experimental groups vs controls. Animals got LDC diet had slightly higher RLW (3.5% ± 0.2%, and 3.3 ± 0.1%) compared with that received the standard chow (3.1% ± 0.1%, 3.0% ± 0.1%) at week 4 and 8, respectively. On the other hand, the ratio of liver-to-body weight of L-HFr fed rats was the highest (4.5% ± 0.1% at week 4, and 4.0% ± 0.4% at week 8) during the observation period (P < 0.001) (Figure 1D).
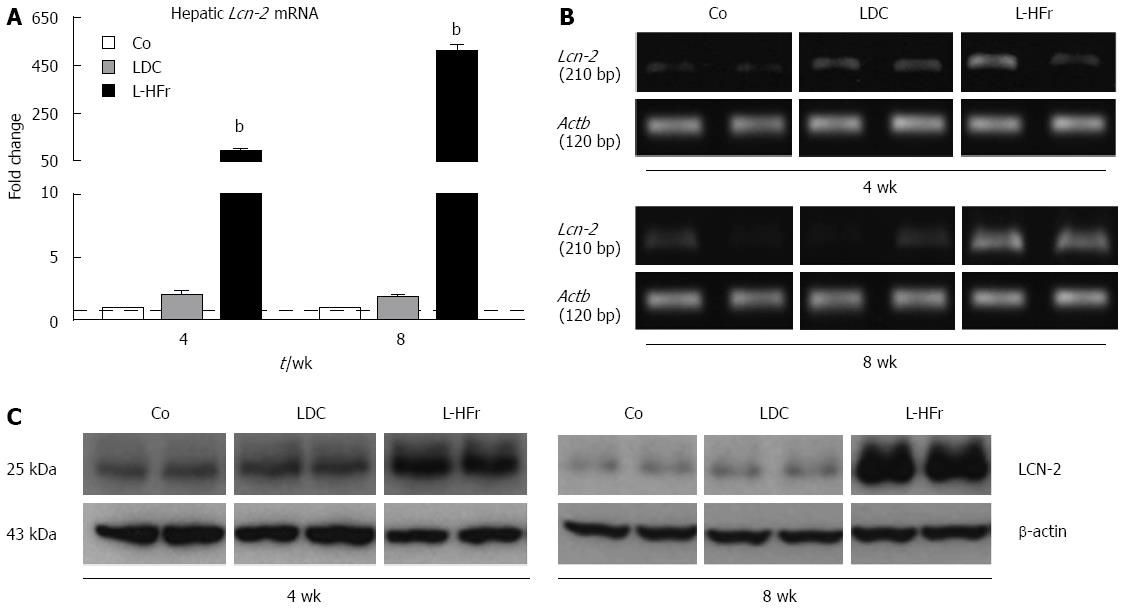
Expression of hepatic Lcn-2 mRNA: To elucidate whether both animal models of non-alcoholic induced fatty liver will similarly express LCN-2 in the liver, qRT-PCR and conventional PCR were used. Interestingly, the expression of Lcn-2 was not significantly changed in the livers of LDC group at weeks 4 and 8 compared with the corresponding Co group. Alternatively, a significant increase of hepatic Lcn-2 expression was detectable in the L-HFr category at week 4 (90 ± 11 fold; P < 0.001) and week 8 (507 ± 28 fold; P < 0.001) (Figure 2A). The extent of Lcn-2 mRNA in the L-HFr group was the highest among the other studied genes. Furthermore, a qualitative evaluation for Lcn-2 mRNA by conventional (end-point) PCR further showed similar changes in gene expression (Figure 2B).
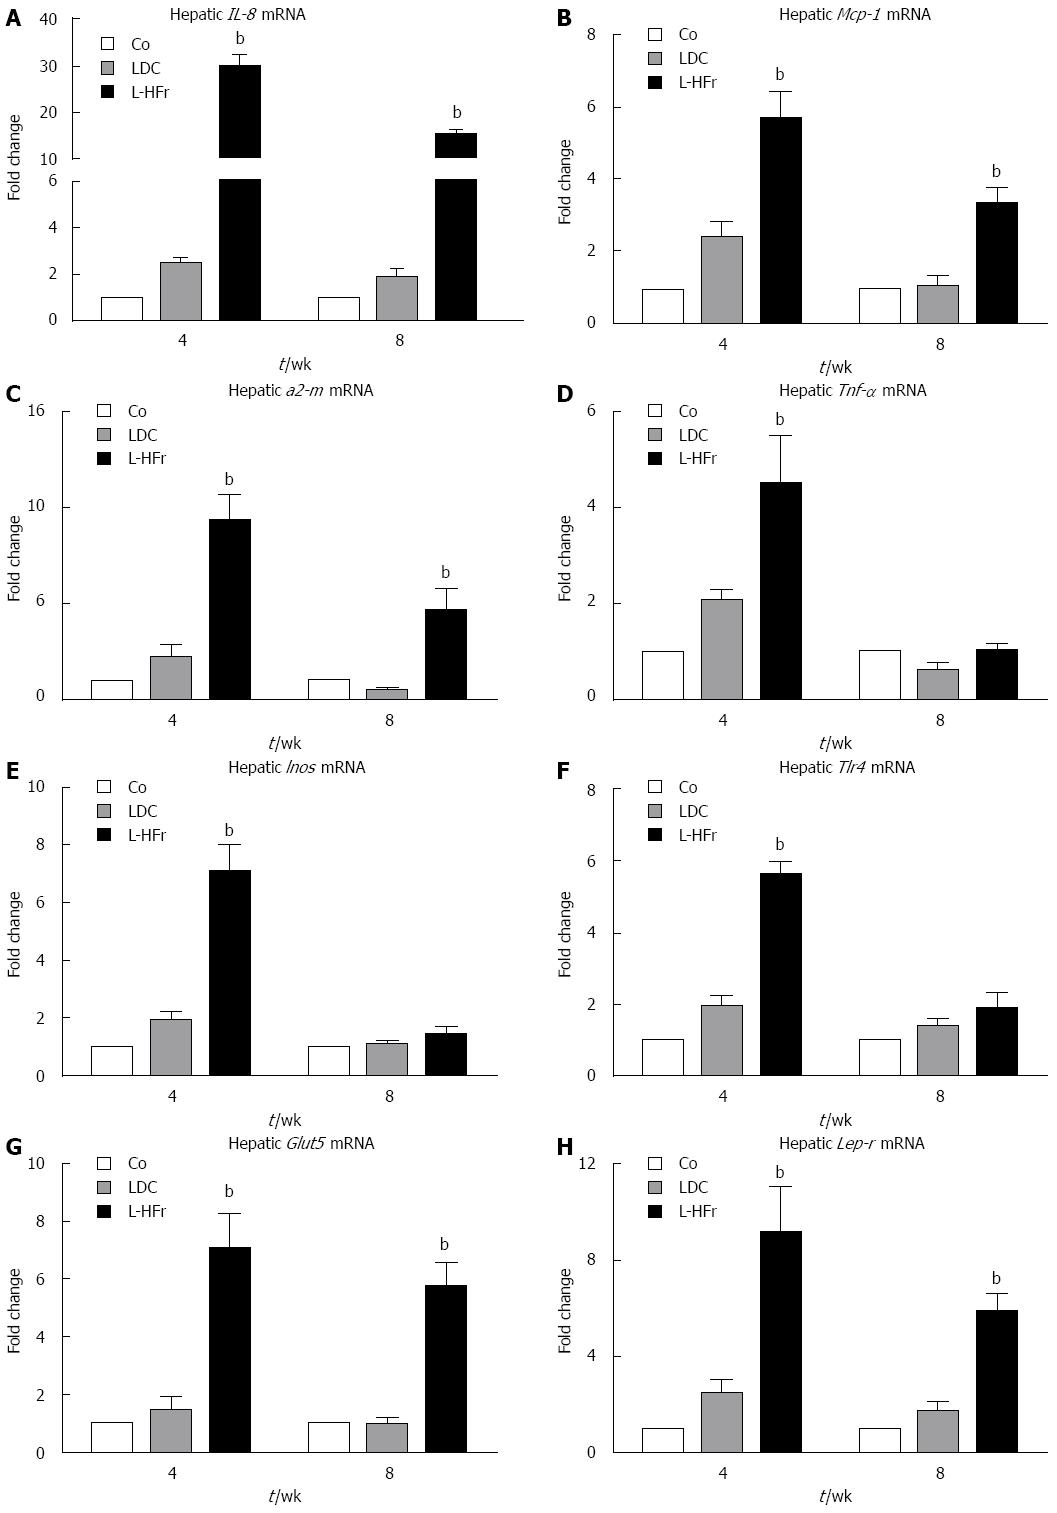
Changes of inflammation-related mRNA expression in liver samples: The following inflammation-related genes were studied at weeks 4 and 8: Il-8; a potent activator of neutrophils, Mcp-1; recruits monocytes and granulocytes, α2-m; a positive acute-phase protein in human and rat, Tnf-α; a pro-inflammatory cytokine, Inos; involved in innate immunity and oxidative conditions, and Tlr4; a pathogen-recognition receptor. The regulation of these genes did not significantly differ between LDC and control groups at both time points. Conversely, in the L-HFr group the mRNA levels of il-8 (30-fold), Mcp-1 (4.9-fold), α2-m (9.4-fold), Tnf-α (4.5-fold), Inos (5.6-fold), and Tlr4 (7.1-fold) were significantly amplified at week 4 (Figure 3A-F). Noticeably, we also found an up-regulation of Il-8 (13-fold), Mcp-1 (3.6-fold), α2-m (5.7-fold) in the L-HFr at week 8 (Figure 3A-C). At this time point, however, there was no significant change in Tnf-α, Inos, and Tlr4 in the same group (Figure 3D-F).
Modulations of Glut5 and Lep-r mRNA in liver samples: In LDC group, levels of Glut5 (the major fructose transporter) and Lep-r (leptin receptor) mRNA expression remained almost at the level of controls. In contrast, Glut5 mRNA was considerably enhanced at week 4 (7-fold) and week 8 (6-fold) in the L-HFr-challenged rats compared to standard Co diet (Figure 3G). Concomitantly, hepatic Lep-r specific mRNA transcripts were substantially raised 9.2-fold (week 4) and 6-fold (week 8) in L-HFr-fed animals (Figure 3H).
Expression of hepatic LCN-2 protein: Western blotting were used to detect the amount of specific LCN-2 protein in total liver homogenates. The expression of LCN-2 protein was almost similar in LDC and control animals. Along with increased Lcn-2 mRNA levels in the L-HFr group, the expression of LCN-2 was obviously up-regulated in the L-HFr group (Figure 2C). Prominently, the maximal increase of LCN-2 was at week 8.
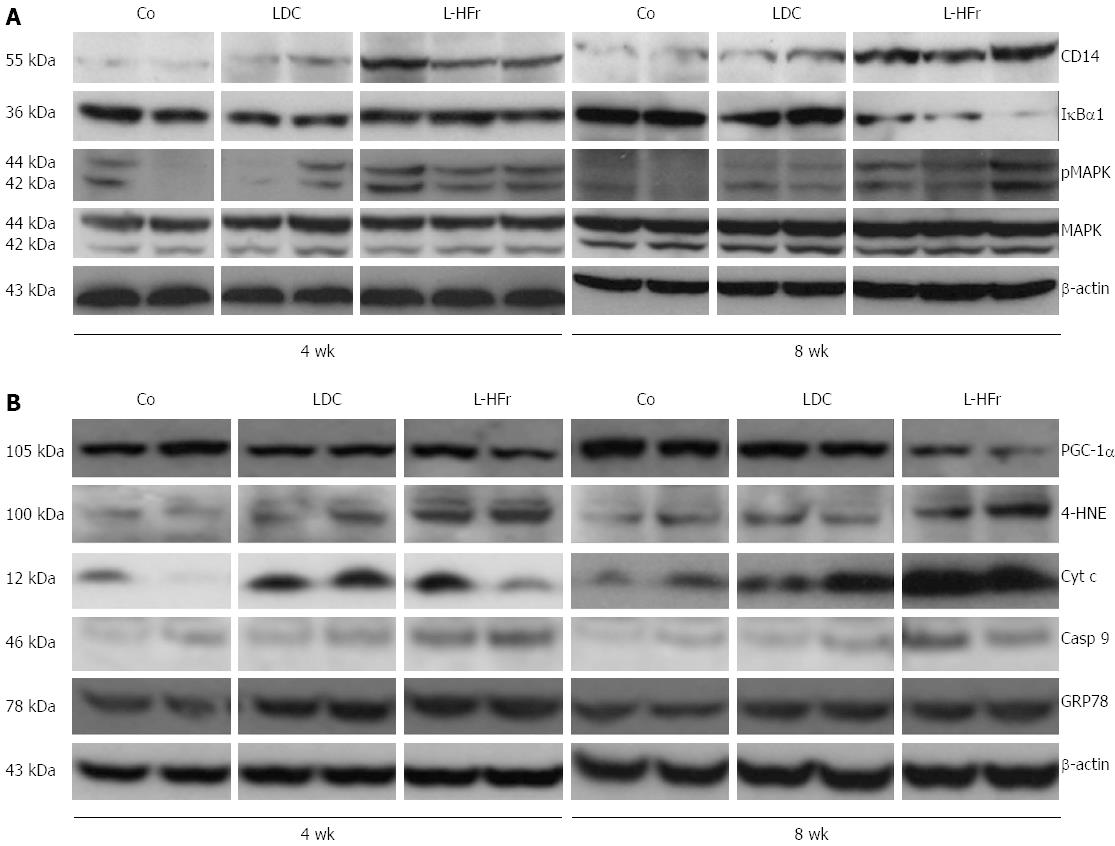
Variations of inflammation-related proteins in rats’ livers: Concurrently, fructose-enriched diets evidently stimulated the protein levels of CD14 (a multifunctional protein, involved in TLR4 signal transduction and apoptosis) and MAPK (is activated by phosphorylation in response to stress and coordinates pro-apoptotic functions). Markedly, hepatic IκBα1 protein expression was attenuated in the L-HFr group at week 8 (Figure 4A).
Metabolism and oxidative stress related indicators: To study whether chronic dietary fructose could impair mitochondrial and (or) endoplasmic reticulum functions, Western blotting studies were performed on hepatic casp 9; the initial caspase in the mitochondrial apoptotic cascade in response of ROS, GRP78; a molecular chaperone correlated with endoplasmic reticulum stress, it regulates the unfolded protein response, and 4-HNE; a specific end product of lipid peroxidation. In contrast to the Co or LDC diet, the L-HFr induced casp 9, GRP78, and 4-HNE at both time points (Figure 4B). However, Cyt c protein, which required for mitochondrial function and apoptosis, was maximally increased at week 8. Additionally, it’s known that PGC-1α plays a crucial role in mitochondrial biogenesis[26]. In the current study, our data showed that the L-HFr diet diminished the hepatic PGC-1α protein expression obviously at week 8 (Figure 4B). The latest result was inversely correlated to the patterns of liver LCN-2 protein.
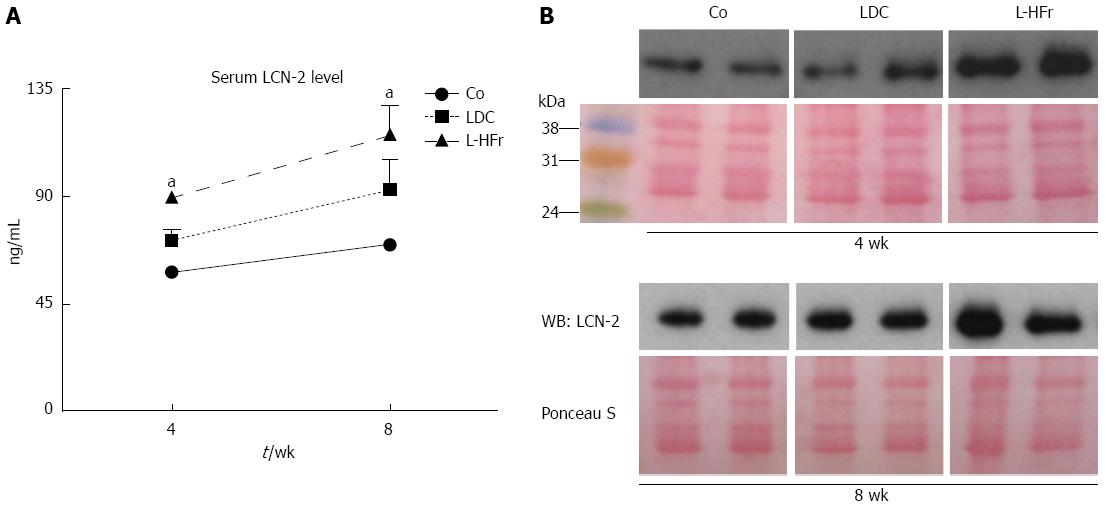
At week 8, the concentration of serum LCN-2 tended to be higher than the concentration at week 4 in all groups (Figure 5). The LDC group showed a mild increase in serum LCN-2 when compared with the Co group. Oppositely, the concentration of LCN-2 in bloodstream revealed by ELISA was obviously augmented in fructose-targeted animals (Figure 5A). At week 4, L-HFr-given rats evidenced a (2-fold, P < 0.05) enhancement in the level of serum LCN-2, and more than 2.2-fold (P < 0.05) increase at week 8 in the LCN-2 magnitudes. The increase of circulatory LCN-2 protein was further confirmed by Western blotting (Figure 5B).
LDC diet had significantly increased fasting TGs in the plasma compared with littermate controls at week 4. Animal’s administration with L-HFr had increased levels of fasting blood glucose and TGs compared to chow (Table 3). Consistently, the concentration of total plasma cholesterol was moderately higher in the L-HFr group compared with age-matched control. Furthermore, the plasma level of HDL-C was diminished in L-HFr fed rats after 8 wk (P < 0.001) (good cholesterol) (Table 3). LDL cholesterol levels weren’t changed among the groups (data not shown). In addition, the intake of L-HFr regimen was associated with a 2-fold increase in plasma uric acid concentration at week 8 (P < 0.01). Moreover, we found that the concentration of fasting serum leptin was elevated 2.8-fold and 3.3-fold in the L-HFr vs chow fed rats at weeks 4 and 8, respectively (P < 0.01). The difference in liver transaminases activities between the control and LDC groups was mild. Oppositely, the serum ALT and AST activities were significantly increased in L-HFr group (P < 0.05) at both studied time points (Table 3).
| Parameter | Time point/ Group (wk) | Co | LDC | L-HFr |
| Glucose (mg/dL) | 4 | 152 ± 12 | 182 ± 5 | 243 ± 8b |
| 8 | 210 ± 7 | 244 ± 5 | 292 ± 7b | |
| TG (mg/dL) | 4 | 26 ± 5 | 74 ± 8a | 78 ± 13a |
| 8 | 44 ± 13 | 62 ± 15 | 127 ± 21a | |
| Cholesterol (mg/dL) | 4 | 55 ± 2 | 58 ± 4 | 58 ± 3 |
| 8 | 47 ± 4 | 52 ± 4 | 53 ± 5 | |
| HDL-C (mg/dL) | 4 | 49 ± 1 | 43 ± 2 | 46 ± 1 |
| 8 | 44 ± 1 | 45 ± 3 | 32 ± 2d | |
| Uric acid (mg/dL) | 4 | 0.6 ± 0.0 | 0.9 ± 0.2 | 0.5 ± 0.0 |
| 8 | 1.1 ± 0.0 | 0.5 ± 0.1 | 2.2 ± 0.3b | |
| ALT (U/L) | 4 | 41 ± 8 | 43 ± 3 | 69 ± 7a |
| 8 | 55 ± 8 | 48 ± 4 | 80 ± 8a | |
| AST (U/L) | 4 | 67 ± 5 | 74 ± 2 | 136 ± 8b |
| 8 | 90 ± 7 | 117 ± 13 | 166 ± 10b | |
| Leptin (ng/mL) | 4 | 1.8 ± 0.2 | 3.0 ± 0.3 | 5.0 ± 0.9b |
| 8 | 3.7 ± 0.9 | 5.7 ± 2.1 | 12.1 ± 1.4b |
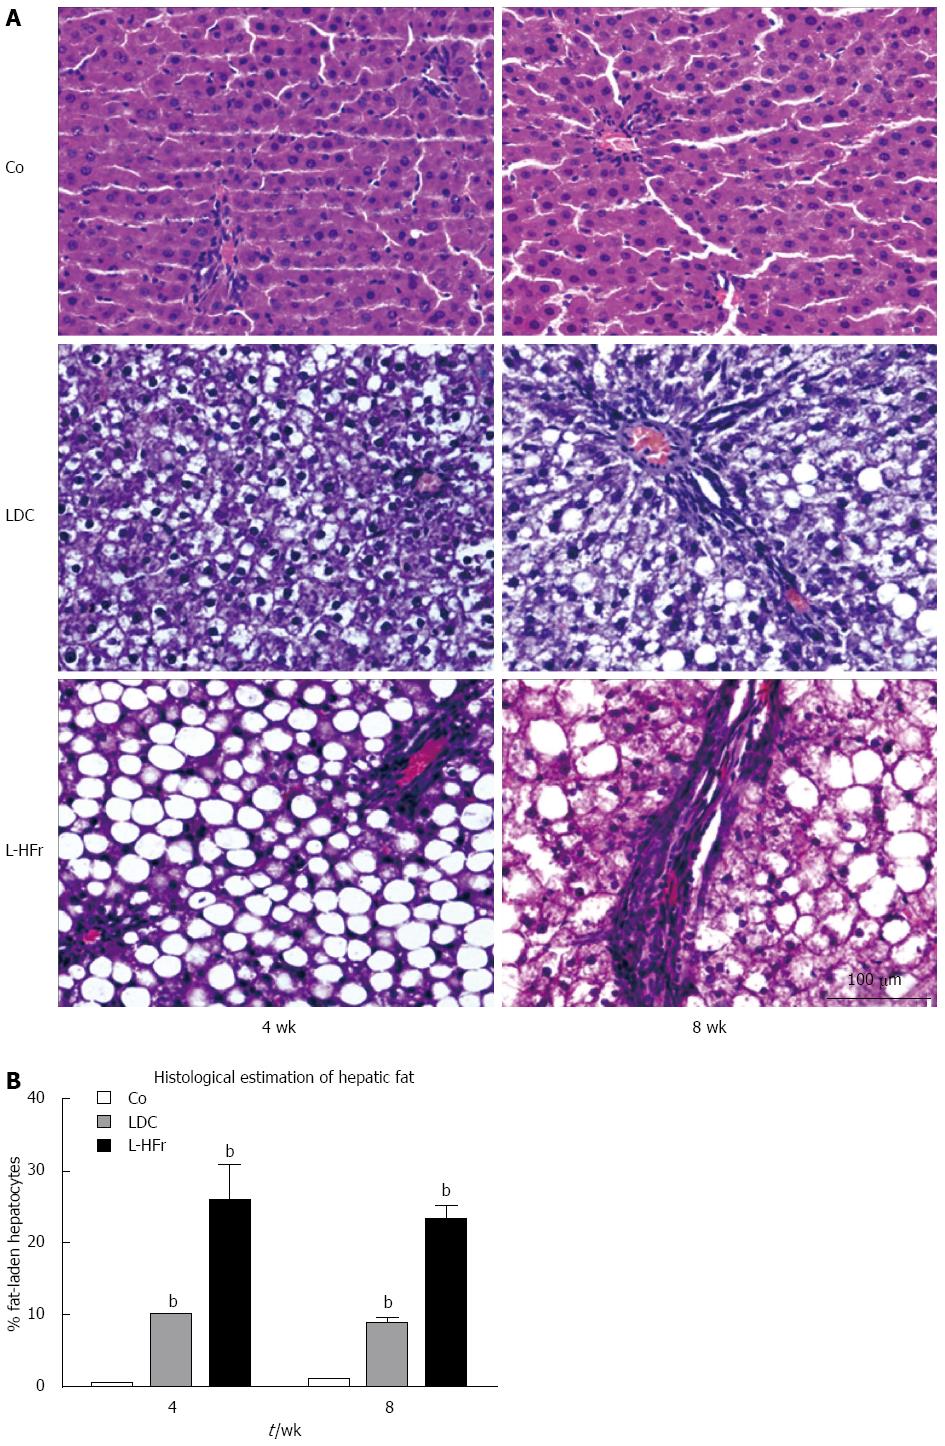
Control (chow-fed) rats showed normal hepatic architecture, and there was no sign of steatosis. The livers of rats fed liquid LDC diet showed micro- or mediovesicular steatosis commonly observed in periportal areas at weeks 4 and 8, respectively. Instead, livers of the rats which were treated with L-HFr diet were distinguishable from those rats fed with chow or LDC (Figure 6A). The rats of L-HFr group had extremely macro-steatotic livers and moderate inflammation (grade 2) noticed in zone I, and II towards the central vein which was surrounded with few hepatocytes displaying micro-steatosis, along with a loss of structural integrity and the vascular architecture at both time points. The percentage of fat-loaded hepatocytes was histologically evaluated by a pathologist (Figure 6B).
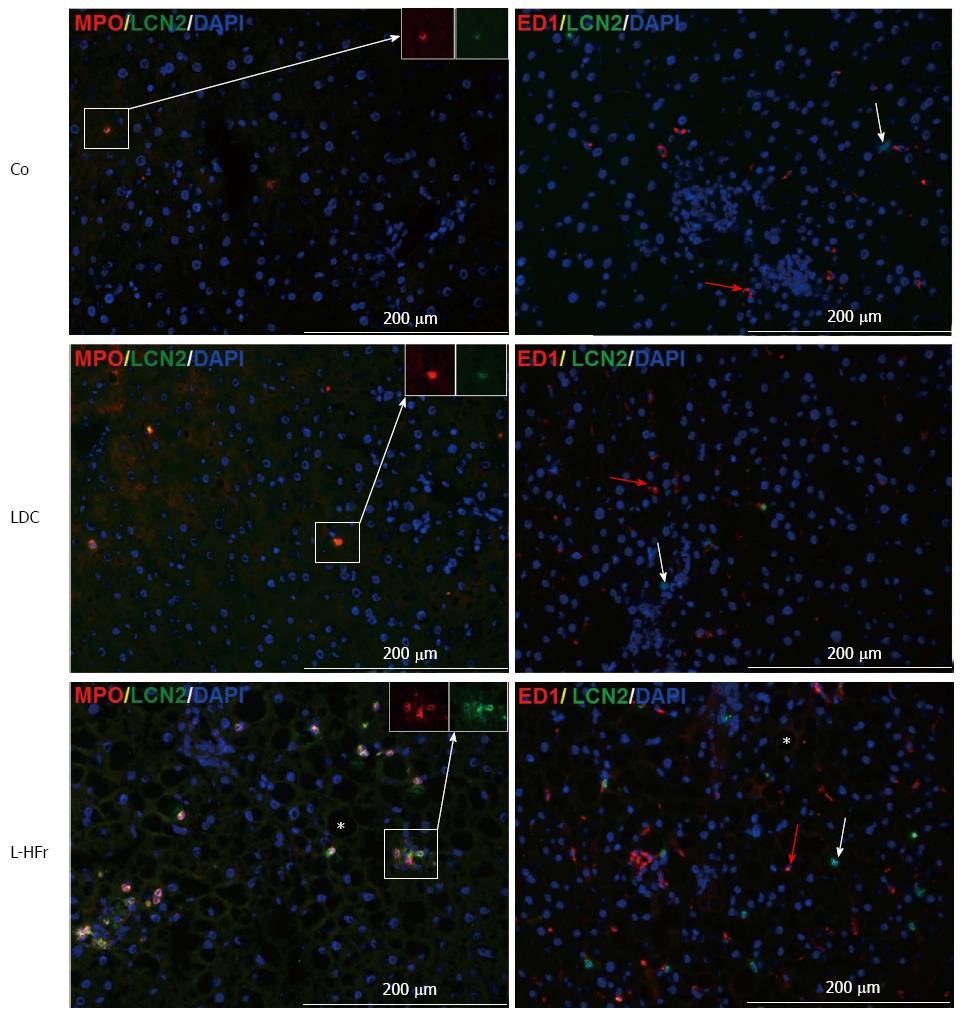
Immunofluorescence staining proved the tissue specific LCN-2 localization. The positivity of LCN-2 in the liver was restricted to MPO+ cells (Figure 7, left-panel). Only a few LCN-2+ cells were observed in the normal (healthy) liver tissues. LDC-treated animals presented similar view as seen in control, but some LCN-2 signals were observed in MPO+ cells in periportal area mainly at week 8 of the study. Interestingly, the highest LCN-2 positivity was detected evidently in the MPO+ granulocytes in the livers of L-HFr groups. We also examined whether there is an overlapping between anti-MPO and anti-ED1 by double-immunostainings. The positivity of each marker was entirely separated (data not shown), indicating that MPO is a neutrophil-restricted marker.
A micro- or mediovesicular steatosis was histologically revealed in the livers of LDC group and a macrovesicular steatosis in L-HFr treated rats. We demonstrated that LCN-2 protein was strikingly increased in the liver and serum of L-HFr group. In this group, the increase of LCN-2 synthesis was associated with inflammation at week 4, whereas the peak value of LCN-2 at week 8 was mainly accompanied by a decrease in the mitochondrial function. The indicators of stress conditions and apoptosis were elevated at both time points. Evidently, an interaction existed between the inflammatory and metabolic processes in this study.
By feeding with L-HFr regimen, it was able to induce metabolic syndrome in the corresponding rats. Indeed, we found an elevation of fasting plasma glucose, high TGs, and low HDL-C levels in this group. These findings are recognized as the core components of diabetic dyslipidemia[27]. Furthermore, it is known that fructose phosphorylation in the liver consumes ATP, consequently the accumulated ADP serves as substrate for uric acid formation[28]. In fact, the levels of fasting blood uric acid and leptin were significantly elevated in L-HFr-treated rats. The increased fasting leptin level was due to dietary fructose promoted leptin resistance[29,30], in which the leptin’s action was suppressed and it did not induce satiation (fullness) compared to chow or LDC diet. This could be the explanation of high food intake that was seen in the L-HFr group.
After intestinal uptake, fructose is typically extracted from the blood stream by hepatocytes, which is independent of insulin exertion and phosphofructokinase regulation step. Consequently, the up taken fructose is metabolized to glucose, fatty acids or lactate[31]. We observed a significant up-regulation of hepatic Glut5 (fructose transporter) gene expression in L-HFr nourished rats, which was correlated with the accumulated fat in the liver. It was stated that high fructose intake was associated with increased plasma TGs, most probably caused by an up-regulation of hepatic de novo lipogenesis and TGs secretion, and a decreased clearance of VLDL-TG[32]. At that point, we found that L-HFr nourished rats promoted the onset of massive hepatic steatosis mainly in zone I and II.
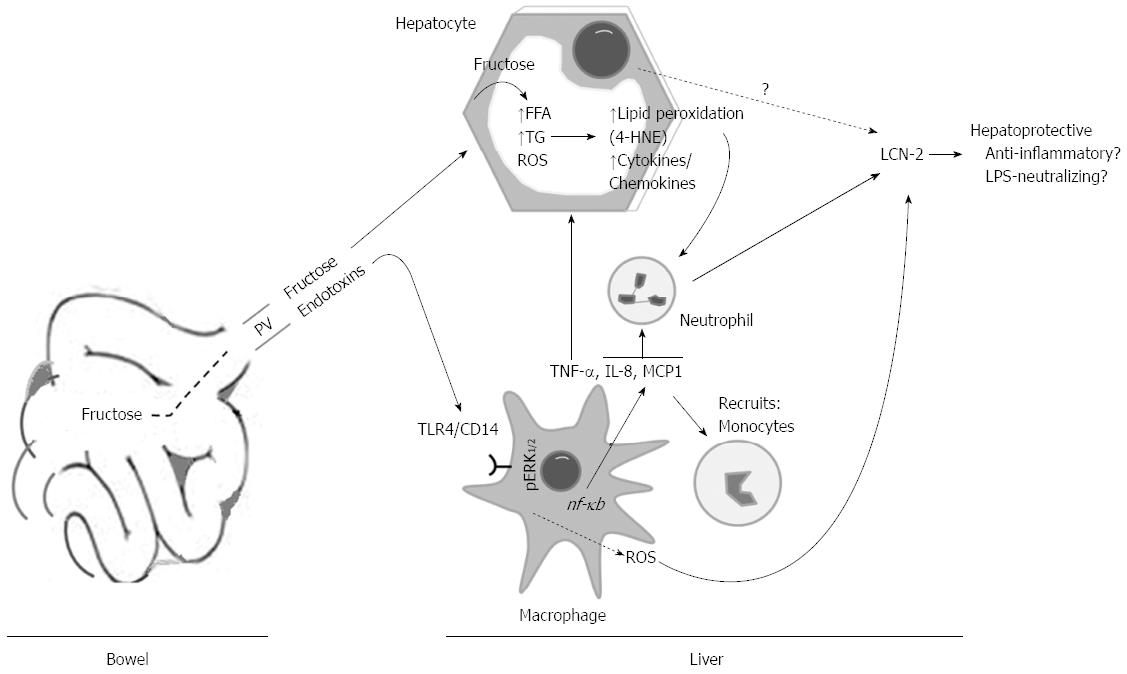
The likelihood that changes in the concentration of hepatic fructose and its metabolites after intake could potentiate lipid peroxidation, alterations of endoplasmic reticulum and mitochondrial functions, and apoptosis was assessed by 4-HNE adducts, GRP78, casp 9, and Cyt c. We found augmentations of those proteins expressions in L-HFr fed rats, suggesting that these rats compared with the LDC or chow-fed rats, were facing higher oxidative stress conditions. Additionally, 4-HNE chemotactically recruits neutrophil granulocytes into the stressed liver. It was regarded that PGC-1α expression in liver is normally increased during fasting in response to glucagon[33], and it plays a central role in the regulation of cellular energy metabolism[34] and mitochondrial function[35]. Interestingly, the protein expression of PGC-1α was declined predominantly at week 8 in livers from L-HFr group, providing further evidence for a decreased mitochondrial function. Collectively, these results indicated that chronic fructose-enriched diet altered, at least partially, mitochondrial and endoplasmic reticulum functions and induced cellular apoptosis and stress conditions. These changes were related to a noticeable increase of hepatic LCN-2+ neutrophil granulocytes in the L-HFr group (Figure 8).
LCN-2 has emerged as a potential link among obesity, inflammation, and obesity-associated metabolic dysfunction such as IR[19,36]. It was emphasized that fructose consumption is also correlated with elevated LPS level in liver, which can trigger the release of proinflammatory cytokines when bound to CD14/toll-like receptors (TLR4) which are presented on immune cells[37]. Recognition of LPS by the CD14/TLR4/MD-2 complex activates intracellular signaling pathways involving mitogen-activated protein kinase (MAPK), resulting in the production of proinflammatory cytokines and chemokines[38]. Even though we hadn’t measured the endotoxin levels in portal blood, we found up-regulated levels of hepatic TLR4, ED1+ cells and p/ERK1/2 in L-HFr regimen obviously at week 4. However, the multifunctional CD14 was also elevated in livers of the L-HFr group at week 8. It was shown that CD14, in addition to its important role in inflammation and innate immunity, promotes cell survival and antagonizes programmed cell death ‘‘apoptosis’’[39]. Overall, these findings, indirectly, suggested that endotoxins influx from bowel via portal vein might also be involved in the modulation of liver inflammation in L-HFr-treated rats in a TLR4-dependent manner[7].
Actually, there are controversial data coexisting regarding the role of LCN-2 in recruiting the inflammatory cells to the site of injury and exacerbating inflammation, and in its role as an anti-inflammatory and protective protein. It was shown that LCN-2 elicits its adverse effects at least partly by stimulating TNF-α, which may in turn magnify the local inflammation and cause impaired energy homeostasis[40]. Furthermore, Fujino et al[41] reported the pro-inflammatory NF-κB has been shown to transactivate LCN-2 expression through binding with a consensus motif in its promoter region. On the other hand, the addition of LCN-2 protein to the culture media of adipocytes and macrophages leads to the suppression of TNFα- and LPS-induced cytokines/chemokines production, indicating an anti-inflammatory function[42]. Most strikingly, LCN-2 appears to protect against TNFα-induced IR in adipocytes.
Increased production of LCN-2 in obesity may be a protective mechanism against inflammation and IR[17]. Guo et al[17] found that in the absence of LCN-2, the expression of proinflammatory cytokines such as MCP-1 and TNF-α were up-regulated in adipose tissue, while expression levels of anti-inflammatory markers declined, suggesting an increased inflammatory status in Lcn-2-/- mice. These results further suggest that Lcn-2-/- mice are more susceptible to high fat diet-induced pro-inflammatory response than wild-type mice. Currently, we observed a reduction in Tlr4, Inos, and Tnf-α in the livers of L-HFr fed rats at 8th week accompanied by the most dramatic increase in LCN-2 level, supporting the point that LCN-2 acts more likely as an anti-inflammatory protein. However, further studies are required to elucidate whether LCN-2 could act as a hepatoprotective protein (LPS-neutralizing and anti-inflammatory protein) especially in fructose-induced fatty liver.
In this comparative study, we verified that the increase of LCN-2 in liver and blood circulation was considerably provoked by fructose-enriched diet. The increase of hepatic LCN-2 was correlated with elevated indicators of apoptosis, mitochondrial dysfunction, and lipid peroxidation in the L-HFr group. LPS influx into the liver may contribute to LCN-2 induction. This study suggests that LCN-2 could serve as an indicator to distinguish between simple steatosis and non-alcoholic steatohepatitis. Moreover, it may have contra-regulatory hepatoprotective effects.
The authors appreciate Prof. Dr. med. Tilman Sauerbruch, Dept. of Gastroenterology and Endocrinology, UMG, and Prof. Dr. Uwe Groß, Institute for Medical Microbiology, Faculty of Medicine, Georg-August-University, Goettingen, Germany for the critical advising and reviewing the study. This research did not receive any specific grant from any funding agency in the public, commercial, or not-for-profit sector. We also acknowledge support by the German Research Foundation and the Open Access Publication Funds of the Göttingen University.
Non-alcoholic fatty liver disease (NAFLD) is a disease of increasing prevalence worldwide, which may develop into endstage liver disease. It was reported that fructose intake is related to NAFLD. Fructose can result in numerous metabolic changes including oxidative stress. The expression of hepatic lipocalin-2 (LCN-2, a secretory glycoprotein) is influenced by metabolic and inflammatory processes.
The pathogenesis of NAFLD is still obscure. A few studies examined the expression of LCN-2 in rat fatty liver model especially that provoked by fructose. In contrast, most of them focused on (genetically-altered) mice e.g., Lcn-2-/- and db/db models treated with high-fat diet. The authors explored LCN-2 expression in a novel rat fatty liver model induced by high (70% cal) fructose (L-HFr) vs high-fat and chow diets. In addition, the authors addressed the possible role of LCN-2 and its mechanism of production.
The role of fructose in the pathogenesis of NAFLD is not new. The health concerns raised pertain to the amounts of sugar in the current diet, primarily as beverages. Most meta-analyses have shown that the risk of obesity, diabetes, cardiovascular disease, and metabolic syndrome is directly related to consumption of beverages sweetened with sugar and/or high-fructose corn syrup. In support of these findings the authors found L-HFr diet induced more severe liver damage compared to LDC high fat and control diets. High fructose supplementation in a model of NAFLD worsens the liver pathology and that was associated with an increase in LCN-2, among several other mediators. The expression of LCN-2 correlated with the increased indicators of oxidative stress and mitochondrial dysfunction. Actually, there are controversial data coexisting regarding the role of LCN-2 in inflammation. The authors conclude that LCN-2 may be involved in liver protection.
The study speculates LCN-2 could function as a hepatoprotective protein and can be used as a biomarker to differentiate between simple steatosis (fatty liver) and NASH.
NAFLD encompasses a wide spectrum of liver damage, ranging from simple steatosis into liver cancer. The pathogenesis of NAFLD is multifactorial. Fructose is a monosaccharide which is commonly used as a sweetener in food industry; it is used as a food additive and supplementary diet. LCN-2 is a 25-kDa secretory glycoprotein; it is also a positive acute phase protein. LCN-2 has been characterized as a critical regulator of energy and lipid homeostasis.
This work is well-planned, executed and presented. The study is also quite interesting, since it refers to what the authors often find in common patients due to the increased sugar intake in industrialized countries. The current data show clear differences between the two rat models of diet-inducible fatty liver and the possible mechanisms were discussed. It has novel findings and may help understanding the mechanism of the fatty liver disease based on fructose-enriched diet. This study could provide a future strategy for therapeutic intervention in the treatment of patients.
P- Reviewers: Gong ZJ, Sazci A S- Editor: Qi Y L- Editor: A E- Editor: Ma S
| 1. | Wieckowska A, McCullough AJ, Feldstein AE. Noninvasive diagnosis and monitoring of nonalcoholic steatohepatitis: present and future. Hepatology. 2007;46:582-589. [PubMed] [DOI] [Cited in This Article: ] |
| 2. | Vanni E, Bugianesi E, Kotronen A, De Minicis S, Yki-Järvinen H, Svegliati-Baroni G. From the metabolic syndrome to NAFLD or vice versa? Dig Liver Dis. 2010;42:320-330. [PubMed] [DOI] [Cited in This Article: ] |
| 3. | Younossi ZM. Review article: current management of non-alcoholic fatty liver disease and non-alcoholic steatohepatitis. Aliment Pharmacol Ther. 2008;28:2-12. [PubMed] [DOI] [Cited in This Article: ] |
| 4. | Lê KA, Bortolotti M. Role of dietary carbohydrates and macronutrients in the pathogenesis of nonalcoholic fatty liver disease. Curr Opin Clin Nutr Metab Care. 2008;11:477-482. [PubMed] [DOI] [Cited in This Article: ] |
| 5. | Akar F, Uludağ O, Aydın A, Aytekin YA, Elbeg S, Tuzcu M, Sahin K. High-fructose corn syrup causes vascular dysfunction associated with metabolic disturbance in rats: protective effect of resveratrol. Food Chem Toxicol. 2012;50:2135-2141. [PubMed] [DOI] [Cited in This Article: ] |
| 6. | Bantle JP. Dietary fructose and metabolic syndrome and diabetes. J Nutr. 2009;139:1263S-1268S. [PubMed] [DOI] [Cited in This Article: ] |
| 7. | Anurag P, Anuradha CV. Metformin improves lipid metabolism and attenuates lipid peroxidation in high fructose-fed rats. Diabetes Obes Metab. 2002;4:36-42. [PubMed] [Cited in This Article: ] |
| 8. | Quinn MT, Linner JG, Siemsen D, Dratz EA, Buescher ES, Jesaitis AJ. Immunocytochemical detection of lipid peroxidation in phagosomes of human neutrophils: correlation with expression of flavocytochrome b. J Leukoc Biol. 1995;57:415-421. [PubMed] [Cited in This Article: ] |
| 9. | Spruss A, Kanuri G, Wagnerberger S, Haub S, Bischoff SC, Bergheim I. Toll-like receptor 4 is involved in the development of fructose-induced hepatic steatosis in mice. Hepatology. 2009;50:1094-1104. [PubMed] [DOI] [Cited in This Article: ] |
| 10. | Yang J, Goetz D, Li JY, Wang W, Mori K, Setlik D, Du T, Erdjument-Bromage H, Tempst P, Strong R. An iron delivery pathway mediated by a lipocalin. Mol Cell. 2002;10:1045-1056. [PubMed] [Cited in This Article: ] |
| 11. | Flower DR. The lipocalin protein family: structure and function. Biochem J. 1996;318:1-14. [PubMed] [Cited in This Article: ] |
| 12. | Chen X, Cushman SW, Pannell LK, Hess S. Quantitative proteomic analysis of the secretory proteins from rat adipose cells using a 2D liquid chromatography-MS/MS approach. J Proteome Res. 2005;4:570-577. [PubMed] [DOI] [Cited in This Article: ] |
| 13. | Cowland JB, Borregaard N. Molecular characterization and pattern of tissue expression of the gene for neutrophil gelatinase-associated lipocalin from humans. Genomics. 1997;45:17-23. [PubMed] [DOI] [Cited in This Article: ] |
| 14. | Sultan S, Pascucci M, Ahmad S, Malik IA, Bianchi A, Ramadori P, Ahmad G, Ramadori G. LIPOCALIN-2 is a major acute-phase protein in a rat and mouse model of sterile abscess. Shock. 2012;37:191-196. [PubMed] [DOI] [Cited in This Article: ] |
| 15. | Liu Q, Nilsen-Hamilton M. Identification of a new acute phase protein. J Biol Chem. 1995;270:22565-22570. [PubMed] [DOI] [Cited in This Article: ] |
| 16. | Devireddy LR, Teodoro JG, Richard FA, Green MR. Induction of apoptosis by a secreted lipocalin that is transcriptionally regulated by IL-3 deprivation. Science. 2001;293:829-834. [PubMed] [DOI] [Cited in This Article: ] |
| 17. | Guo H, Jin D, Zhang Y, Wright W, Bazuine M, Brockman DA, Bernlohr DA, Chen X. Lipocalin-2 deficiency impairs thermogenesis and potentiates diet-induced insulin resistance in mice. Diabetes. 2010;59:1376-1385. [PubMed] [Cited in This Article: ] |
| 18. | Law IK, Xu A, Lam KS, Berger T, Mak TW, Vanhoutte PM, Liu JT, Sweeney G, Zhou M, Yang B. Lipocalin-2 deficiency attenuates insulin resistance associated with aging and obesity. Diabetes. 2010;59:872-882. [PubMed] [Cited in This Article: ] |
| 19. | Wang Y, Lam KS, Kraegen EW, Sweeney G, Zhang J, Tso AW, Chow WS, Wat NM, Xu JY, Hoo RL. Lipocalin-2 is an inflammatory marker closely associated with obesity, insulin resistance, and hyperglycemia in humans. Clin Chem. 2007;53:34-41. [PubMed] [DOI] [Cited in This Article: ] |
| 20. | Jun LS, Siddall CP, Rosen ED. A minor role for lipocalin 2 in high-fat diet-induced glucose intolerance. Am J Physiol Endocrinol Metab. 2011;301:E825-E835. [PubMed] [DOI] [Cited in This Article: ] |
| 21. | Jin D, Guo H, Bu SY, Zhang Y, Hannaford J, Mashek DG, Chen X. Lipocalin 2 is a selective modulator of peroxisome proliferator-activated receptor-gamma activation and function in lipid homeostasis and energy expenditure. FASEB J. 2011;25:754-764. [PubMed] [DOI] [Cited in This Article: ] |
| 22. | Lieber CS, Leo MA, Mak KM, Xu Y, Cao Q, Ren C, Ponomarenko A, DeCarli LM. Model of nonalcoholic steatohepatitis. Am J Clin Nutr. 2004;79:502-509. [PubMed] [Cited in This Article: ] |
| 23. | Malik IA, Moriconi F, Sheikh N, Naz N, Khan S, Dudas J, Mansuroglu T, Hess CF, Rave-Fränk M, Christiansen H. Single-dose gamma-irradiation induces up-regulation of chemokine gene expression and recruitment of granulocytes into the portal area but not into other regions of rat hepatic tissue. Am J Pathol. 2010;176:1801-1815. [PubMed] [DOI] [Cited in This Article: ] |
| 24. | Bradford MM. A rapid and sensitive method for the quantitation of microgram quantities of protein utilizing the principle of protein-dye binding. Anal Biochem. 1976;72:248-254. [PubMed] [DOI] [Cited in This Article: ] |
| 25. | Wójcik M, Ramadori P, Blaschke M, Sultan S, Khan S, Malik IA, Naz N, Martius G, Ramadori G, Schultze FC. Immunodetection of cyclooxygenase-2 (COX-2) is restricted to tissue macrophages in normal rat liver and to recruited mononuclear phagocytes in liver injury and cholangiocarcinoma. Histochem Cell Biol. 2012;137:217-233. [PubMed] [DOI] [Cited in This Article: ] |
| 26. | Zhou L, Yu X, Meng Q, Li H, Niu C, Jiang Y, Cai Y, Li M, Li Q, An C. Resistin reduces mitochondria and induces hepatic steatosis in mice by the protein kinase C/protein kinase G/p65/PPAR gamma coactivator 1 alpha pathway. Hepatology. 2013;57:1384-1393. [PubMed] [DOI] [Cited in This Article: ] |
| 27. | Adiels M, Olofsson SO, Taskinen MR, Borén J. Diabetic dyslipidemia. Curr Opin Lipidol. 2006;17:238-246. [PubMed] [DOI] [Cited in This Article: ] |
| 28. | Choi HK, Curhan G. Soft drinks, fructose consumption, and the risk of gout in men: prospective cohort study. BMJ. 2008;336:309-312. [PubMed] [DOI] [Cited in This Article: ] |
| 29. | Shapiro A, Mu W, Roncal C, Cheng KY, Johnson RJ, Scarpace PJ. Fructose-induced leptin resistance exacerbates weight gain in response to subsequent high-fat feeding. Am J Physiol Regul Integr Comp Physiol. 2008;295:R1370-R1375. [PubMed] [DOI] [Cited in This Article: ] |
| 30. | Alwahsh S, Xu M, Ramadori G, Schultze F. Lipocalin-2 is a biomarker in rat fatty liver induced by fructose-enriched diet. Z Gastroenterol. 2013;51:P301. [DOI] [Cited in This Article: ] |
| 31. | Tappy L, Lê KA. Metabolic effects of fructose and the worldwide increase in obesity. Physiol Rev. 2010;90:23-46. [PubMed] [DOI] [Cited in This Article: ] |
| 32. | Johnson RJ, Segal MS, Sautin Y, Nakagawa T, Feig DI, Kang DH, Gersch MS, Benner S, Sánchez-Lozada LG. Potential role of sugar (fructose) in the epidemic of hypertension, obesity and the metabolic syndrome, diabetes, kidney disease, and cardiovascular disease. Am J Clin Nutr. 2007;86:899-906. [PubMed] [Cited in This Article: ] |
| 33. | Herzig S, Long F, Jhala US, Hedrick S, Quinn R, Bauer A, Rudolph D, Schutz G, Yoon C, Puigserver P, Spiegelman B, Montminy M. CREB regulates hepatic gluconeogenesis through the coactivator PGC-1. Nature. 2001;413:179-183. [PubMed] [DOI] [Cited in This Article: ] |
| 34. | Liang H, Ward WF. PGC-1alpha: a key regulator of energy metabolism. Adv Physiol Educ. 2006;30:145-151. [PubMed] [DOI] [Cited in This Article: ] |
| 35. | Holmström MH, Iglesias-Gutierrez E, Zierath JR, Garcia-Roves PM. Tissue-specific control of mitochondrial respiration in obesity-related insulin resistance and diabetes. Am J Physiol Endocrinol Metab. 2012;302:E731-E739. [PubMed] [DOI] [Cited in This Article: ] |
| 36. | Alwahsh SM, Xu M, Ramadori G, Mihm S, Schultze FC. Fructose-enriched diet induced overexpression of lipocalin-2 in rat fatty liver. J Clin Exp Hepat. 2013;3:S31-S32. [DOI] [Cited in This Article: ] |
| 37. | Baker RG, Hayden MS, Ghosh S. NF-κB, inflammation, and metabolic disease. Cell Metab. 2011;13:11-22. [PubMed] [DOI] [Cited in This Article: ] |
| 38. | Lin SM, Frevert CW, Kajikawa O, Wurfel MM, Ballman K, Mongovin S, Wong VA, Selk A, Martin TR. Differential regulation of membrane CD14 expression and endotoxin-tolerance in alveolar macrophages. Am J Respir Cell Mol Biol. 2004;31:162-170. [PubMed] [DOI] [Cited in This Article: ] |
| 39. | Heidenreich S. Monocyte CD14: a multifunctional receptor engaged in apoptosis from both sides. J Leukoc Biol. 1999;65:737-743. [PubMed] [Cited in This Article: ] |
| 40. | Pedersen BK, Steensberg A, Fischer C, Keller C, Ostrowski K, Schjerling P. Exercise and cytokines with particular focus on muscle-derived IL-6. Exerc Immunol Rev. 2001;7:18-31. [PubMed] [Cited in This Article: ] |
| 41. | Fujino RS, Tanaka K, Morimatsu M, Tamura K, Kogo H, Hara T. Spermatogonial cell-mediated activation of an IkappaBzeta-independent nuclear factor-kappaB pathway in Sertoli cells induces transcription of the lipocalin-2 gene. Mol Endocrinol. 2006;20:904-915. [PubMed] [DOI] [Cited in This Article: ] |
| 42. | Zhang J, Wu Y, Zhang Y, Leroith D, Bernlohr DA, Chen X. The role of lipocalin 2 in the regulation of inflammation in adipocytes and macrophages. Mol Endocrinol. 2008;22:1416-1426. [PubMed] [DOI] [Cited in This Article: ] |


