Published online Apr 21, 2016. doi: 10.3748/wjg.v22.i15.3952
Peer-review started: September 10, 2015
First decision: September 29, 2015
Revised: October 26, 2015
Accepted: December 8, 2015
Article in press: December 8, 2015
Published online: April 21, 2016
AIM: To investigate the inhibitory action of diet-derived phenolic compound gallic acid (GA) against HCT-15 colon cancer cells.
METHODS: The antiproliferative effect of GA against colon cancer cells was determined by performing thiazolyl blue tetrazolium bromide (MTT) assay. The colony forming ability of GA treated colon cancer cells was evaluated using the colony forming assay. The cell cycle changes induced by GA in HCT-15 cells were analyzed by propidium iodide staining. Levels of reactive oxygen species (ROS) and mitochondrial membrane potential of HCT-15 exposed to GA was assessed using 2’,7’-dichlorfluorescein-diacetate and rhodamine-123 respectively, with the help of flow cytometry. Morphological changes caused by GA treatment in the colon cancer cells were identified by scanning electron microscope and photomicrograph examination. Apoptosis was confirmed using flow cytometric analysis of GA treated HCT-15 cells after staining with Yo-Pro-1.
RESULTS: MTT assay results illustrated that GA has an inhibitory effect on HCT-15 cells with IC50 value of 740 μmol/L. A time-dependent inhibition of colony formation was evident with GA treatment. Cell cycle arrest was evident from the accumulation of GA treated HCT-15 cells at sub-G1 phase (0.98 ± 1.03 vs 58.01 ± 2.05) with increasing exposure time. Flow cytometric analysis of GA treated HCT-15 cells depicted early events associated with apoptosis like lipid layer breakage and fall in mitochondrial membrane potential apart from an increase in the generation of ROS which were in a time dependent manner. SEM and photomicrograph images of the GA-treated cells displayed membrane blebbing and cell shrinking characteristics of apoptosis. Further apoptosis confirmation by Yo-Pro-1 staining also showed the time-dependent increase of apoptotic cells after treatment.
CONCLUSION: These results show that GA induced ROS dependent apoptosis and inhibited the growth of colon cancer cells.
Core tip: This article describes the inhibitory effect of gallic acid (GA), against colon cancer cells. GA treatment suppressed the proliferation and colony formation of HCT-15 cells and the anti-cancerous effect of GA was found to follow reactive oxygen species dependent apoptosis. Early events associated with apoptosis like lipid layer breakage and fall in mitochondrial membrane potential were induced by GA treatment in HCT-15 cells along with cell cycle arrest. Further, morphological changes like membrane blebbing and cell shrinkage were seen in the colon cancer cells after GA. Therefore, our results propel the role of GA as a possible anticancer agent.
- Citation: Subramanian AP, Jaganathan SK, Mandal M, Supriyanto E, Muhamad II. Gallic acid induced apoptotic events in HCT-15 colon cancer cells. World J Gastroenterol 2016; 22(15): 3952-3961
- URL: https://www.wjgnet.com/1007-9327/full/v22/i15/3952.htm
- DOI: https://dx.doi.org/10.3748/wjg.v22.i15.3952
Gastrointestinal (GI) diseases account for substantial morbidity, mortality and cost in both developed and developing countries. Gastrointestinal diseases refer to diseases involving the gastrointestinal tract[1]. The GI tract is essentially a long tube extending from the mouth to the anus with a number of specialized regions. Gastrointestinal cancers usually develop in the large intestine or the small intestine[2]. Colorectal cancer is a malignant tumor arising from the inner wall of large intestine, which is the third most common type of cancer[3]. The American Cancer Society’s estimates 93090 new cases and 49700 deaths due to colorectal cancer in the United States for 2015[4]. Colon cancer arises out of the conversion of the normal functioning colonic epithelium to adenomatous polyps. Its etiology is known to be a combination of hereditary, environmental, dietary factors and lack of physical activity[5]. Several anticancer agents were found to exert their effect by inducing apoptosis. Various lines of evidence suggest that apoptosis provides a protective mechanism against neoplasia by removing genetically damaged stem cells from the epithelium before they can undergo clonal expansion. Some of these anticancer agents were also found to occur in our diets. These diets include majorly flavonoids and phenolic compounds[6]. In this scenario, research communities explore more diet-derived compounds to treat colon cancer as the lining-epithelial cells are chronically exposed to these dietary agents[7].
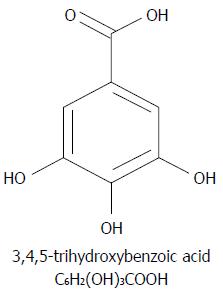
Gallic acid is one such diet-derived phenolic substance being surveyed. GA is a 3,4,5-trihydroxybenzoic acid (C6H2(OH)3COOH), a type of phenolic organic compound found in many plants and food substances. The chemical structure is shown in the Figure 1. GA is found in free as well as part of hydrolyzable tannins and easily freed from gallotannins by oxidation. GA is a phytochemical in oak, Drosera, golden root, stinging nettle, Chinese mahogany and dietary substances like bearberry, blackberry, hot chocolate, common walnut, Indian gooseberry, raspberry, clove, vinegar, wine, witch hazel and green tea[8].
Previous studies have demonstrated a range of biological activities of GA, including anticancer, antioxidant and anti-inflammatory properties[9]. The various in vitro assays examining the anticancer property showed that the GA is active against several types of cancer cell lines[10]. Particularly, the studies showed that GA induced cell death in colon cancer lines COLO 205, HCT-15, HCT 116[11]. However, the mechanism induced by GA against colon cancer is not yet elucidated. Thus, this research proposes a study of the antiproliferative activity of GA as well as, intends to find the events associated with apoptotic effect of GA in HCT-15 colon cancer cells.
The Roswell Park Memorial Institute medium (RPMI-1640) cell culture medium, fetal bovine serum (FBS), additional sources like sodium pyruvate, nonessential amino acids, L-glutamine, vitamin solution, penicillin and streptomycin were purchased from Life Technologies, Inc., Grand Island, United States. Reagents like as 3-(4,5-dimethylthiazol-2-yl)-2,5-diphenyl-tetrazolium-bromide (MTT), propidium iodide, mercury orange, RNase and GA were obtained from Sigma-Aldrich (United States). Supplementary stains such as merocyanine - 540 and YO-PRO-1 were acquired from Invitrogen Inc, United States.
Human colorectal adenocarcinoma cell line HCT-15 (Organ: Colon, Disease: Colorectal adenocarcinoma; Organism: Human; procured from National Centre for Cell Science, Pune, India) was grown in RPMI medium, while 10% FBS, sodium pyruvate, penicillin, L-glutamine, nonessential amino acids and vitamin solution was given as supplements. Adherent monolayer cultures of HCT-15 were preserved in T-25 flasks and incubated at 37 °C in 5% carbon dioxide (CO2). The cultures were free of mycoplasma and maintained no longer than 12 wk after recovery from frozen stocks.
Cell numbers or cell proliferation inhibition by GA was determined by thiazolyl blue tetrazolium bromide (MTT) assay. In brief, colon cancer cells were trypsinized, counted and 1000 cells were seeded per well in 96-well plate. The subsequent day, 100 μL of the medium containing the preferred concentration of GA was added to the appropriate wells. The cells were then maintained at 37 °C in 5% CO2 for the desired length of time. The untreated cells kept for 72 h was used as control for this experiment. At this moment, 100 μL of (5 mg/mL) MTT reagent was added to each well, and the plate was sustained at 37 °C in the incubator for 2 h. After aspirating the supernatant, 200 μL of dimethyl sulfoxide was added to each well to solubilize the formazan crystals formed in viable cells. The optical density was spectrophotometrically measured at 570 nm using enzyme-linked immunosorbent assay plate reader[12].
In order to assess the colony forming ability of GA treated colon cancer cells, the colony formation assay was executed. The cultured HCT-15 cells were treated with GA at a concentration of 740 μmol/L for definite time periods of 12 h, 24 h, 48 h and collected by trypsinization. The cells were counted and seeded again in triplicate on a 6-well tissue culture plate with 3000 cells/well. Following 15-d incubation at 37 °C, colonies were stained with 0.5% crystal violet in methanol and the number of colonies was counted[13]. Control used in this experiment was untreated cells kept for 72 h. For all the experiments performed below, control cells remained untreated and kept for the same duration as the longest time point of the respective experiment.
Cell cycle analysis is an exceptional type of test that involves the flow cytometry and the fluorescent propidium dye and distinguishes the different phases of the cell cycle. The sub-G1 fraction of the cell cycle was used as a measure of the apoptotic cells. After the appropriate treatment with GA, HCT-15 cells were washed with phosphate-buffered saline (PBS), then re-suspended in 50 μg/mL of propidium iodide stain containing 0.1% sodium citrate with 0.1% Triton X-100 for 20 min at 4 °C. Analysis was performed in linear amplification mode in case of cell cycle analysis using FACScan; Becton Dickinson Immunocytometry Systems. Remaining experiments of flow cytometry were performed in the logarithmic amplification mode unless otherwise stated[14].
MMP (ΔΨm) levels of GA treated HCT-15 cells were measured by the rhodamine-123 fluorescent dye. The HCT-15 colon cancer cells were treated with GA (740 μmol/L) for different time points. Then cells were harvested and re-suspended in 1 mL of rhodamine-123 (5 μg/mL) for 1 h and maintained at 37 °C. The intensity of fluorescence from rhodamine-123 was measured by flow cytometry[12]. Obtained fluorescence values were normalized with respect to control as 100%.
The lipid bilayer breaks when the drugs induce an antiproliferative effect on the cancerous cells. To estimate the lipid layer breakage the fluorescent dye merocyanine-540 is used. The cultured HCT-15 cells were treated with GA at concentration of 740 μmol/L for different time points. Cells were harvested and re-suspended in 1 mL of merocyanine-540 (10 μg/mL) for 15 min at 37 °C. The intensity of fluorescence was measured by flow cytometry[13].
GA treated HCT-15 cells (740 μmol/L) were harvested using trypsin/EDTA and re-suspended in PBS. Working solution (20 μmol/L) of Dichlorofluorescein-diacetate (DCFH-DA) was directly added to the cells and then it was incubated at 37 °C for 15 min. DCFH-DA was cleaved by the intracellular nonspecific esterase to form DCFH. DCFH are oxidized by ROS to form the fluorescent compound DCF. Cells were washed before re-suspending in PBS and kept on ice immediately before analyzing by flow cytometry[12]. The fluorescence intensity of DCF was measured and correlated with the ROS generated in the GA treated colon cancer cells.
Yo-Pro-1 staining helps in the analysis of apoptotic cells without interfering cell viability. The stain targets the nucleic acids of the cells and emits a green fluorescence that is detected. The HCT-15 cells after treatment with GA (740 μmol/L), were seeded in the cell pellets and mixed with 1 μmol/L Yo-Pro-1 for 20 min at room temperature. After incubation, the fluorescent intensity was measured using flow cytometry[14].
Fixed amount of HCT-15 cells were seeded in a sterilized glass slide and incubated for 24 h. GA at a concentration of 740 μmol/L was added for 72 h time interval. After incubation, cells were harvested by using trypsin/EDTA and centrifuged for 5 min at room temperature. Then the supernatant was decanted and pellet was dried. Pellet was treated with 2.5% glutaraldehyde in distilled water for 45 min in hybrid oven shaker at 37 °C. Cells were washed thrice with PBS for 5 min and then dehydrated by ethyl alcohol of different concentration (30%, 50%, 70%, 95% and 100%) for 5-10 min. Cell fixation was done with hexamethyl disilazane and the sample was taken for scanning electron microscope analysis. As well as the photomicrograph images of HCT-15 cells were also acquired using light microscope.
The results are expressed as the mean ± SD and repeated at least three independently (biological triplicates). The data were analyzed using Instat software (GraphPad Prism, San Diego, CA). The statistical significance was found using one-way analysis of variance.
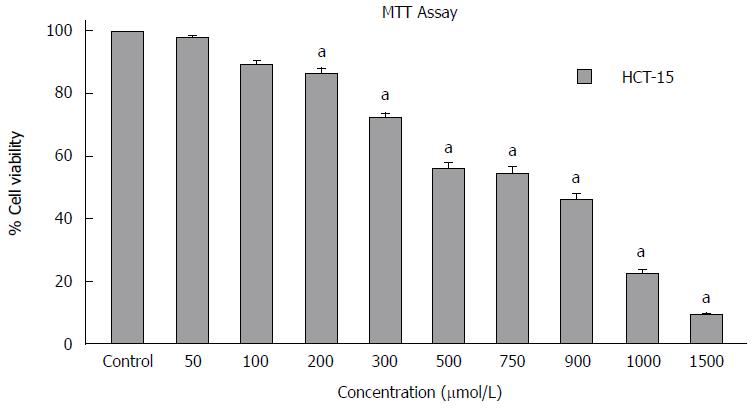
The antiproliferative effect of GA on the cancer cells was assessed by MTT assay. The cell viability assay was performed on the GA treated cells after 72 h of treatment. GA inhibited the growth of HCT-15 colon cancer cells in a dose-dependent manner. The HCT-15 cell growth were inhibited significantly with an IC50 of around 740 μmol/L (Figure 2). However, the growth of GA treated HCT-15 cells were fairly affected even at higher concentrations. Statistical analysis showed that GA treatment results in significant inhibition (P < 0.05) compared with untreated control cells at 200 μmol/L for HCT-15 cells (Figure 2).
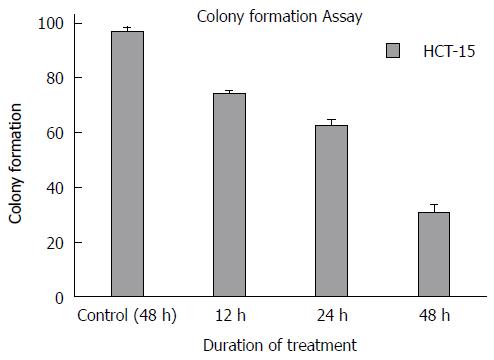
The HCT-15 cells found to form 192 colonies after 12 h treatment with GA (740 μmol/L). The colony numbers reduced with increase in the period of exposure to GA. The GA treated HCT-15 cells showed a maximum of 155 and 110 colonies after 24 h and 48 h of treatment respectively. In contrast, the untreated HCT-15 cells were found to produce a maximum of 210 colonies after 48 h. This is graphically represented in Figure 3. The figure depicts the time-dependent inhibition of colony formation by GA on the colon cancer cells. There was a significant reduction (P < 0.05) in the number of colonies formed under the various time intervals examined when compared with corresponding untreated cells (Figure 3).
The effect of GA on the different phases of cell cycle of HCT-15 cells was estimated for time intervals of 24 h, 48 h and 72 h. The mean percentage of cells at various phases like sub-G1, G0/G1, S and G2/M phases are tabulated in Table 1. The Table showed an increase in the sub-G1 phase arrest from 0.98% (control) to 58.01% after 72 h. Statistical analysis of the sub-G1 column indicated a significant increase (P < 0.05) of cells in the sub-G1 phase. Besides this, the time dependency on the cell cycle arrest induced by GA treatment on HCT-15 cells was also inferred.
| Time (h) | Sub G11 | G0/G1 | S | G2/M |
| Control | 0.98 ± 1.03 | 42.82 ± 3.70 | 8.03 ± 2.37 | 40.07 ± 2.81 |
| 24 | 6.80 ± 2.73 | 32.50 ± 2.04 | 3.89 ± 1.78 | 42.25 ± 4.52 |
| 48 | 27.67 ± 1.56 | 25.51 ± 1.68 | 2.50 ± 3.54 | 29.12 ± 1.75 |
| 72 | 58.01 ± 2.05 | 12.89 ± 2.56 | 3.52 ± 1.09 | 15.26 ± 3.08 |
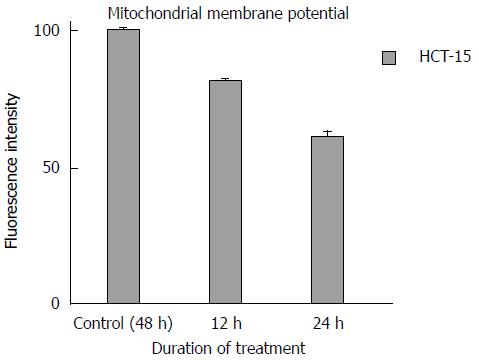
The HCT-15 cells were treated with GA of concentration at 740 μmol/L at various time intervals (12 h and 24 h) and then stained with rhodamine-123 dye. The Figure 4 shows the mean fluorescent intensity of the control and GA treated HCT-15 cells. The untreated HCT-15 cells are considered to have maximum fluorescent intensity. In contrast, the normalized percentage of mean fluorescent intensity decreased to 81 ± 0.577 and 61 ± 1.528 compared to the untreated cells (100% after 24 h) after 12 h and 24 h of GA treatment respectively. There was also a statistically significant reduction (P < 0.05) of potential at the estimated intervals compared to untreated cells (Figure 4).
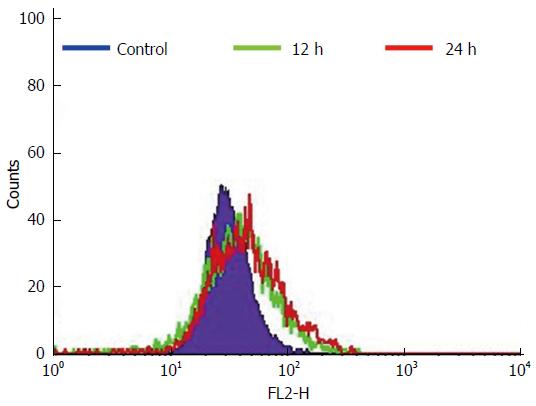
The HCT-15 cells were treated with GA (740 μmol/L) at intervals of 12 h and 24 h. The fluorescent intensities detected from the merocyanine-540 stained cells were measured using flow cytometry. The untreated HCT-15 cells displayed a maximum mean fluorescence intensity at 40 after 24 h. The GA treated HCT-15 cells showed maximum intensity at 62 and 68 after 12 h and 24 h respectively. The maximum mean fluorescence intensities of the GA treated cells are given in Figure 5. It is evident from the above results that the GA treated HCT-15 cells displayed an increase in the lipid layer breaks with an increase in exposure time.
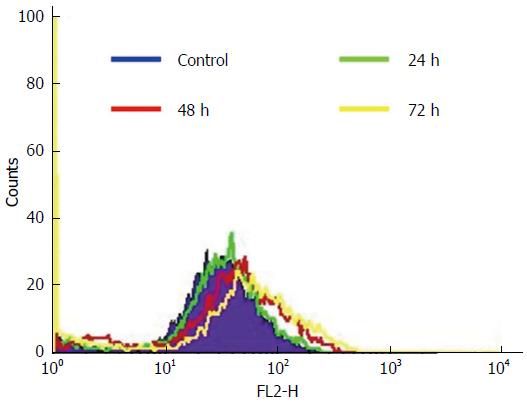
The ROS generated by the HCT-15 cells after GA (740 μmol/L) treatment was estimated at various time intervals such as 24 h, 48 h and 72 h. The ROS generated by the cells oxidized the DCFH-DA to dichlorofluoresin and the fluorescence emitted was measured. The fluorescent intensity obtained by flow cytometry is shown in the Figure 6. The maximum mean fluorescent intensity was found to be 112, 140, and 182 during 24 h, 48 h and 72 h respectively. Whilst, the maximum intensity of control HCT-15 cells was about 98 after 72 h. Moreover, the differences in the ROS levels at various hours examined were significant (Figure 6). The ROS generation from the HCT-15 cells was increased by GA treatment with respect to the increase in time of exposure.
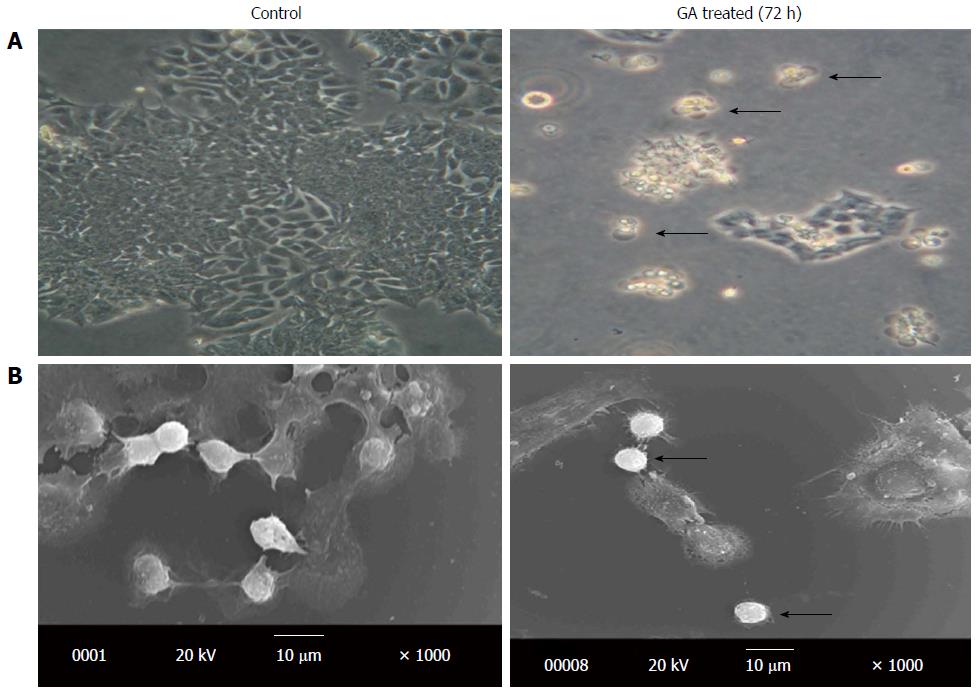
Photomicrograph images of untreated and GA treated colon cancer cells (72 h) were acquired. The obtained images are shown in Figure 7A. In comparison to the untreated cells, the characteristic changes such as membrane blebbing and cell shrinkage are visible in the GA treated cells. These changes embrace the induction of apoptosis after GA treatment. Along with the digital microscopic image obtained, the HCT-15 cells were also examined with a scanning electron microscope to provide topographical or morphological images with high resolution. The images of untreated HCT-15 cells and GA treated HCT-15 cells (72 h) are given in the Figure 7B. It is evident from the images that the GA treated cells showed typical signs of apoptosis like membrane blebbing and shrinkage. In contrast, normal cells did not show any marked shrinkage. Hence, the microscopic images further corroborated the signs of apoptosis induced by GA. The images given the Figure 7 is representative of three independent experiments.
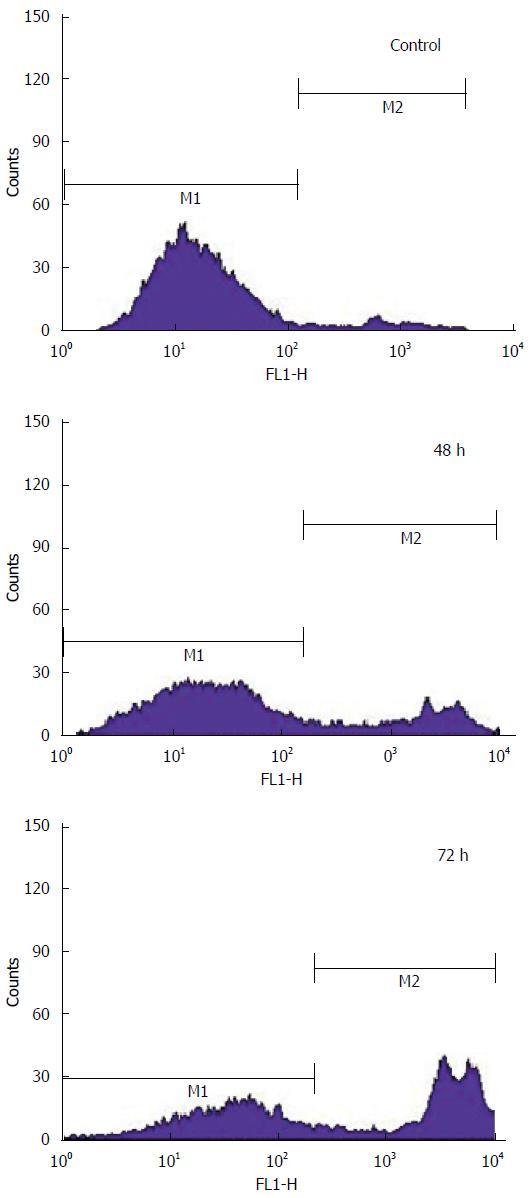
The HCT-15 cells were treated with GA (740 μmol/L) at various intervals of time such as 48 h and 72 h. The green fluorescence emitted by the Yo-Pro-1 stain from the GA treated HCT-15 cells is measured using flow cytometry. The result of fluorescence detected from the colon cancer cell line is given in the Figure 8. The maximum mean fluorescence intensity of GA treated HCT-15 cells at M2 phase was found to be 25.32 and 54.61 after 48 h and 72 h. In contrast, the maximum mean fluorescence intensity of control cells at M2 phase was found to be 7.75 after 72 h.
Diet is thought to have a major role in the etiology of colorectal cancer. Similar studies also proved that a phytochemical-rich diet, which is absorbed by the body from fruit and vegetable sources, could decrease the risk of developing colon cancer[15]. Previous work revealed various biological properties of phenolic content in the diet that we consume regularly. These phenolic compounds are commonly known for their anticancer property. The phenolic compound GA exhibited an antiproliferative effect on the HCT-15 colon cancer cell lines in a dose dependent manner which was similar to the effect of GA on the human hepatoma SMMC-7721 cell proliferation in in vitro condition[16]. Hence it can be inferred that GA treatment led to lysis of HCT-15 cells with increasing concentrations either by apoptosis or necrosis. Cell growth was inhibited significantly with an IC50 of around 740 μmol/L and this was parallel to the results obtained in the recently conducted study of the antiproliferative effect of GA on HCT-15 by Yumnam et al[17]. In a particular study, the oral consumption of six cups of black tea resulted in 344 mg GA[18]. However, about 25 mg of GA is enough to yield about 750 μmol/L in the colonic volume of 200 mL. This shows that the IC50 obtained in our study lies within the range of biological availability. Moreover, the effect of GA on intestinal epithelial cells (IEC) was investigated. It was seen that about 85% of cells were viable when treated with 3.5 mmol/L showing that the GA treatment was non-toxic to normal cells (results not shown). These results depict that the phenolic compound GA has insignificant inhibitory activity against colon cancer cells at even a very high concentration.
Colony formation is one of the characteristic features of cancer cells, which was inhibited by GA treatment in a time dependent manner which is alike to the results obtained by the clonogenic assay on the GA treated A549 human lung adenocarcinoma cells[19]. The cancer cells grow rapidly and multiply uncontrollably therefore, one of the fundamental features expected to be present in the anticancer drug, is the ability of the drug to affect the cell proliferation. Nevertheless, GA is found to evidently affect the colony formation of HCT-15 cells. The morphological changes such as cell shrinkage and membrane blebbing was visible in the colon cancer cells exposed to GA, which agrees to the earlier experimentation of Yumnam et al[17] on the GA treated HCT-15 cells[17]. These cellular changes witnessed in GA treated cells are similar to characteristic changes in the cellular organelles during apoptosis[20]. Thus, the microscopic examinations show GA induces apoptosis in HCT-15 cells.
In normal biological systems, ROS is continuously generated and eliminated as well as plays an important role in driving various regulatory pathways. The cell balances the generation of ROS thereby controlling it. However, abundant generation of ROS during oxidative stress may affect the lipids, cellular proteins. In our study, GA promoted the generation of ROS in the colon cancer cell lines depending on the duration of exposure, which is analogous to the antiproliferative effect of GA against MiaPaCa-2 human pancreatic cancer cells[21]. As the raise in ROS generation is said to cause apoptosis through extrinsic or intrinsic pathways in the cancer cells, the promotion of ROS generation in GA treated HCT-15 cells supports the antiproliferative effect of GA[22]. Other significant pro-apoptotic event is lipid layer breakage, which is said to favor the interaction between the drug tested and the other cell organelles Lipid layer breakage was enhanced by GA treatment in the colon cancer cell lines. This finding is supported by GA-induced lipid layer breaks in the HSC-2 human oral cancer cells[23]. The lipid layer breakage is an optimistic event that favor the interaction between the drug tested and the other cell organelles[24]. Hence, the effect of GA on the lipid layer of HCT-15 cells may be related to the apoptosis-inducing ability of GA. A great increase in ROS has been associated with reduced cancer cell proliferation by induction of cell cycle arrest. The GA treatment caused a time-dependent cell cycle arrest at the sub-G1 phase in HCT-15 cells, which was similar to activity of GA on HL-60 human leukemia cells[25]. However, the Sub-G1 phase is related to measurement of apoptosis or programmed cell death[13]. During apoptosis, the DNA is degraded and the content becomes less than that the DNA content in healthy cells undergoing cell cycle[26]. The increase in the amount of cells at Sub-G1 phase infers that GA treatment of HCT-15 cells may be ascribed to programmed cell death in a time dependent manner.
Mitochondrial malfunction is another key event that occurs during apoptosis. Mitochondrial membrane potential (MPP) of GA treated cells showed decreasing intensity, with an increase in the exposure time that is similar to the result acquired during the investigation of effect of GA on A375S2 human melanoma cells by Lo et al[27]. Various anticancer drugs cause MPP fluctuations and induce death of cancer cells[24]. Furthermore, the changes identified in the level of MPP in may be related to its inhibitory effect of GA against HCT-15 cells. Some recently concluded researches utilized Yo-Pro-1 as an effective agent in confirming apoptosis. The Yo-Pro-1 staining used to detect apoptosis induced by anticancer agents as it analyses the apoptotic cells without interfering cell viability[14]. Apart from the early and later events indicating the occurrence of apoptosis, Yo-pro-1 staining confirmed the apoptosis after GA treatment.
Although apoptosis is confirmed by Yo-Pro-1 staining it would be more interesting to study the various pro-apoptotic and anti-apoptotic protein level in GA treated HCT-15 cells. The analysis of cyclin/CDK, p53, Bax, Bad, Bcl-2 and Bcl-xL protein levels at different time intervals would give more information regarding the apoptosis induced by GA. Hence in future research, this interesting points will be addressed. However, further development of this research work would be in vivo experimentation with GA. This would need a proper understanding of the degree to which GA is absorbed or becomes available at the site of physiological activity after administration. As the half-maximal inhibitory concentration of GA obtained in our studies lies within the range of biological availability, the in vivo experimentation can be preceded. Nevertheless, proper experimentation using humans with risk of colon cancer in a larger group may validate the anticancer activity of GA more precisely.
In conclusion, the phenolic compound GA inhibited the growth of HCT-15 colon cancer cells. GA exhibited antiproliferative effect on both colon cancer cell lines along with notable morphological and biochemical changes. The anti-cancerous effect of GA followed ROS dependent apoptosis in HCT-15 colon cancer cell lines. Early events associated with apoptosis like lipid layer breakage and fall in MPP were induced by GA treatment. The cell cycle progression was arrested at the sub-G1 phase by GA treatment. Morphological changes like membrane blebbing and shrinkage in the GA treated cells was depicted by SEM and photomicrograph images. In conclusion, GA induced apoptosis in HCT-15 cells through the ROS - mitochondrial pathway in a time dependent manner. These results propel the role of GA as a possible anticancer agent. However, further experiments in preclinical and clinical settings are needed to promote GA as a likely candidate for chemotherapy of colon cancer.
Many surveys have shown that all types of cancers have a link with the diets the authors consume. Especially, in the case of colon cancer, diet plays a crucial role as the colonic epithelial cells are exposed to diets directly. Because of this reason, scientists explore various natural compounds present in food substances to treat colon cancer. Some studies have already shown that these natural compounds are absorbed by the body and have the potential to reduce the risk of colon cancer. The current study deals with examining the growth inhibitory effect of the dietary phenolic phytochemical gallic acid (GA) against HCT-15 colon cancer cells.
Despite the several anticancer drugs that are available for colon cancer, scientists continuously search for a novel anticancer drug with enhanced efficacy. Previous experiments have investigated the anticancer effect of GA against colon cancer, while the various reactions induced by GA on colon cancer cells have never been examined.
The study emphasizes the mechanism related to the anticancer effect of GA against colon cancer cell. GA was found to inhibit the growth of colon cancer cells through reactive oxygen species (ROS)-mediated apoptosis with notable morphological changes.
A series of events associated with the anticancer activity of GA are clearly depicted. Moreover, in-depth experimentation in preclinical and clinical settings is needed to promote GA as a plausible candidate for chemotherapy of colon cancer. Further, an in-depth proteomics study in relation to the GA induced apoptosis would be of great interest.
Apoptosis or programmed cell death, the death of cells that occurs as a normal and controlled part of an organism’s growth or development which can be Apoptosis can be induced either by a stimulus, such as irradiation or toxic drugs, or by removal of a repressor agent.
Phytochemicals modulate key cellular signaling pathways and have proven anticancer effects. In the past, a large number of substances derived from plants have been studied in antitumor research fields and many have proven to exhibit chemopreventive properties which could be used as adjuvant chemotherapy. In this manuscript, the authors found that diet-derived phenolic compound GA inhibited the proliferation and induced the apoptosis of HCT-15 cancer cells through increased generation of ROS. The study is important and may advance the field of chemoprevention.
P- Reviewer: Luo HS, Umar S S- Editor: Yu J L- Editor: A E- Editor: Ma S
| 1. | Peery AF, Dellon ES, Lund J, Crockett SD, McGowan CE, Bulsiewicz WJ, Gangarosa LM, Thiny MT, Stizenberg K, Morgan DR. Burden of gastrointestinal disease in the United States: 2012 update. Gastroenterology. 2012;143:1179-1187.e1-e3. [PubMed] [DOI] [Cited in This Article: ] |
| 2. | Nessar A, Maureen D, Chris S, Ed W. Chapter 11 Disorders Of The gastrointestinal Tract, Pancreas, Liver and Gall Bladder. UK: Taylor & Francis group 2006; . [Cited in This Article: ] |
| 3. | Chapter 5. 5. In: World Cancer Report 2014. World Health Organization 2014; . [Cited in This Article: ] |
| 4. | American cancer society. Cancer Facts & Fig.s. 2015; Available from: http://www.cancer.org/research/cancerfactsstatistics/cancerfactsFig.s2015/. [Cited in This Article: ] |
| 5. | Gutman M, Fidler IJ. Biology of human colon cancer metastasis. World J Surg. 1995;19:226-234. [PubMed] [DOI] [Cited in This Article: ] |
| 6. | Johnson IT. Anticarcinogenic effects of diet-related apoptosis in the colorectal mucosa. Food Chem Toxicol. 2002;40:1171-1178. [PubMed] [DOI] [Cited in This Article: ] |
| 7. | Reynolds LD, Wilson NG. Scribes and Scholars. 3rd ed. Oxford: Oxford University Press 1991; 193-194. [Cited in This Article: ] |
| 8. | Stein A, Atanackovic D, Bokemeyer C. Current standards and new trends in the primary treatment of colorectal cancer. Eur J Cancer. 2011;47 Suppl 3:S312-S314. [PubMed] [DOI] [Cited in This Article: ] |
| 9. | Locatelli C, Filippin-Monteiro FB, Ariana C. Chapter: Antioxidant, Antitumoral and Anti-Inflammatory Activities of GA. Handbook on Gallic acid: Natural Occurrences, Antioxidant Properties and Health Implications, 4th ed. Hauppauge: Nova science publishers 2013; 1-23. [Cited in This Article: ] |
| 10. | Subramanian AP, John AA, Vellayyapan MV, Balaji A, Jaganathan SK, Supriyanto E, Yusof M. Gallic Acid: Prospects and the molecular mechanisms of its anticancer activity. RSC Advances. 2015;5:35608-35621. [DOI] [Cited in This Article: ] |
| 11. | Inoue M, Suzuki R, Sakaguchi N, Li Z, Takeda T, Ogihara Y, Jiang BY, Chen Y. Selective induction of cell death in cancer cells by gallic acid. Biol Pharm Bull. 1995;18:1526-1530. [PubMed] [DOI] [Cited in This Article: ] |
| 12. | Jaganathan SK. Growth inhibition by caffeic acid, one of the phenolic constituents of honey, in HCT 15 colon cancer cells. ScientificWorldJournal. 2012;2012:372345. [PubMed] [DOI] [Cited in This Article: ] |
| 13. | Jaganathan SK, Mazumdar A, Mondhe D, Mandal M. Apoptotic effect of eugenol in human colon cancer cell lines. Cell Biol Int. 2011;35:607-615. [PubMed] [DOI] [Cited in This Article: ] |
| 14. | Jaganathan SK, Supriyanto E, Mandal M. Events associated with apoptotic effect of p-Coumaric acid in HCT-15 colon cancer cells. World J Gastroenterol. 2013;19:7726-7734. [PubMed] [DOI] [Cited in This Article: ] |
| 15. | Key TJ. Fruit and vegetables and cancer risk. Br J Cancer. 2011;104:6-11. [PubMed] [DOI] [Cited in This Article: ] |
| 16. | Li MH, Wang MY, Zhao FM, Chen HB, Zhou HG, Zhao QC, Li WT, Wu MH. Study on gallic acid induced human hepatoma SMMC-7721 cells apoptosis and its mechanism. Chinese Pharmacological Bulletin. 2014;657-661. [DOI] [Cited in This Article: ] |
| 17. | Yumnam PD, Addepally U, Mangamoori LN, Chepuri K. Anticancer activity of gallic acid on cancer cell lines HCT15 and MDA MB 231. IJRANSS. 2014;2:269-272. [Cited in This Article: ] |
| 18. | Henning SM, Wang P, Abgaryan N, Vicinanza R, de Oliveira DM, Zhang Y, Lee RP, Carpenter CL, Aronson WJ, Heber D. Phenolic acid concentrations in plasma and urine from men consuming green or black tea and potential chemopreventive properties for colon cancer. Mol Nutr Food Res. 2013;57:483-493. [PubMed] [DOI] [Cited in This Article: ] |
| 19. | Maurya DK, Nandakumar N, Devasagayam TP. Anticancer property of gallic acid in A549, a human lung adenocarcinoma cell line, and possible mechanisms. J Clin Biochem Nutr. 2011;48:85-90. [PubMed] [DOI] [Cited in This Article: ] |
| 20. | Bottone MG, Santin G, Aredia F, Bernocchi G, Pellicciari C, Scovassi AI. Morphological Features of Organelles during Apoptosis: An Overview. Cells. 2013;2:294-305. [PubMed] [DOI] [Cited in This Article: ] |
| 21. | Liu Z, Li D, Yu L, Niu F. Gallic acid as a cancer-selective agent induces apoptosis in pancreatic cancer cells. Chemotherapy. 2012;58:185-194. [PubMed] [DOI] [Cited in This Article: ] |
| 22. | Dickinson BC, Chang CJ. Chemistry and biology of reactive oxygen species in signaling or stress responses. Nat Chem Biol. 2011;7:504-511. [PubMed] [DOI] [Cited in This Article: ] |
| 23. | Alyssa GS, Jeffrey HW, Hannah E, Esther FR, Ayelet RB, Jordana RW, Tova L, Harriet LZ, Harvey B. Cytotoxic and proapoptotic activities of gallic acid to human oral cancer HSC-2 cells. Oxid Antioxid Med Sci. 2013;2:265-274. [DOI] [Cited in This Article: ] |
| 24. | Fadok VA, Bratton DL, Frasch SC, Warner ML, Henson PM. The role of phosphatidylserine in recognition of apoptotic cells by phagocytes. Cell Death Differ. 1998;5:551-562. [PubMed] [DOI] [Cited in This Article: ] |
| 25. | Yeh RD, Chen JC, Lai TY, Yang JS, Yu CS, Chiang JH, Lu CC, Yang ST, Yu CC, Chang SJ. Gallic acid induces G0/G1 phase arrest and apoptosis in human leukemia HL-60 cells through inhibiting cyclin D and E, and activating mitochondria-dependent pathway. Anticancer Res. 2011;31:2821-2832. [PubMed] [Cited in This Article: ] |
| 26. | Gong J, Traganos F, Darzynkiewicz Z. A selective procedure for DNA extraction from apoptotic cells applicable for gel electrophoresis and flow cytometry. Anal Biochem. 1994;218:314-319. [PubMed] [DOI] [Cited in This Article: ] |
| 27. | Lo C, Lai TY, Yang JH, Yang JS, Ma YS, Weng SW, Chen YY, Lin JG, Chung JG. Gallic acid induces apoptosis in A375.S2 human melanoma cells through caspase-dependent and -independent pathways. Int J Oncol. 2010;37:377-385. [PubMed] [Cited in This Article: ] |


