
Effects of gelsemine on oxidative stress and DNA damage responses of Tetrahymena thermophila
- Published
- Accepted
- Received
- Academic Editor
- Monika Mortimer
- Subject Areas
- Microbiology, Toxicology, Zoology
- Keywords
- T. thermophila, Gelsemine, Gene expression, Oxidative stress, DNA damage
- Copyright
- © 2018 Ye et al.
- Licence
- This is an open access article distributed under the terms of the Creative Commons Attribution License, which permits unrestricted use, distribution, reproduction and adaptation in any medium and for any purpose provided that it is properly attributed. For attribution, the original author(s), title, publication source (PeerJ) and either DOI or URL of the article must be cited.
- Cite this article
- 2018. Effects of gelsemine on oxidative stress and DNA damage responses of Tetrahymena thermophila. PeerJ 6:e6093 https://doi.org/10.7717/peerj.6093
Abstract
Gelsemine is an important toxic substance extracted from Gelsemium elegans, which has a lot of biological functions in cells and organisms, but its toxicity has been rarely reported in Tetrahymena thermophila. In this study, we used the protozoan T. thermophila as an experimental model to investigate the potential toxicity-induced mechanism of gelsemine in the unicellular eukaryote. Our results clearly showed gelsemine inhibited T. thermophila growth in a dose-dependent manner. This exposure also resulted in oxidative stress on T. thermophila cells and antioxidant enzyme levels were significantly altered at high gelsemine levels (p < 0.05). Gelsemine produced a slight apoptotic effect at the highest (0.8 mg/mL) gelsemine level used here (p < 0.05). Furthermore, the toxin-induced DNA damage in a dose-dependent manner. The ultrastructural analysis also revealed mitophagic vacuoles at 0.4 and 0.8 mg/mL levels of gelsemine exposure. Moreover, expressions of oxidative stress-related and MAP kinase genes were significantly changed after exposure to 0.8 mg/mL level of gelsemine (p < 0.05). Altogether, our results clearly show that gelsemine from G. elegans can inhibit the growth via inducing oxidative stress and DNA damage in T. thermophila cells.
Introduction
Gelsemium elegans Benth is a famous medicinal plants native to Southeast Asia, particularly in China, which has been long used for centuries as a traditional Chinese folk medicine, in the treatment of inflammation, anxiety and neuralgia in spite of their toxicity (Liu et al., 2011a, 2013). Although more than 190 chemicals have been identified in G. elegans, the primary bioactive components in it are alkaloids, which extracted from the plant have been found possessing various biological effects (Jin et al., 2014). Various alkaloids have similar structures, but they are diverse in pharmacological actions and toxicities. Gelsemine is the only common alkaloid between G. elegans and G. sempervirens while koumine and gelsenicine are unique to G. elegans (Wu et al., 2015). Gelsemine is highly toxic and although its chemical structure and stereochemistry have been defined (Lai & Chan, 2009), its biological effects are poorly described. There is only one report that gelsemine directly modulated recombinant and native glycine receptors in vertebrate (Lara et al., 2016). There is increased interest in gelsemine since it can alter many biological activities in vertebrates, especially in mammals. However, the effects of gelsemine on microorganisms have not been investigated.
Some diseases caused by the unicellular organisms including Echinococcus multilocularis, Ichthyophthirius multifiliis and Vorticella, have brought a serious impact on aquaculture, livestock and humans risks (Moyses et al., 2015; Bansal et al., 2018). We here chose the widely distributed ciliated protozoa Tetrahymena thermophila, a representative for the study on unicellular organisms (Lynn & Doerder, 2012), as a model system to study the effects of gelsemine on unicellular microorganisms. Recently, the genome of T. thermophila has been assembled and annotated, laying a good foundation on downstream studies of functional genomics (Eisen et al., 2006; Stover et al., 2006). As an important unicellular model organism, T. thermophila can be easily cultured and it has a short generation time in a small volume of culture medium. Due to its convenience for cultivation under laboratory conditions and sensitivity to chemical exposure, T. thermophila has been commonly selected as a standard living model to evaluate the effects of chemicals and thereby explore molecular mechanisms. A large number of previous studies have indicated T. thermophila as an effective model organism, being a pharmacological tool in different bioassay techniques to detect toxicants (Sauvant, Pepin & Piccinni, 1999; Eisen et al., 2006).
The effects of gelsemine on T. thermophila have not been studied so far. To be specific, we evaluated the effects of gelsemine on oxidative damage, apoptosis and DNA damage in T. thermophila cells, and the expression pattern of oxidative stress-related genes in T. thermophila with the administration of gelsemine. Therefore, the effects of gelsemine on T. thermophila cells and the molecular mechanisms underlying that were comprehensively explored and discussed.
Materials and Methods
Species and processing of gelsemine
The strain B2086 of T. thermophila was obtained from Professor Miao (Institute of Hydrobiology, Chinese Academy of Sciences, Wuhan, China). Prior to the experiments, the T. thermophila were cultured at 30 °C with shaking at 135 rpm in super proteose peptone (SPP) medium, which consists of 2% proteose peptone, 0.1% yeast extract, 0.2% glucose and 0.003% ferric citrate (Chang, Feng & Miao, 2011). Culture medium was sterilized in high-pressure steam at 120 °C for 30 min before use. Gelsemine (purity: 99.28%) was purchased from Chengdu Mansite Bio-Technology Co., Ltd (Chengdu, China). The stock solutions of gelsemine decompose into dimethyl sulfoxide (DMSO) under 60 °C. Gelsemine was exposed to ultraviolet germicidal irradiation (103 μW/cm2, used UIT-250 UV intensity detector, USHIO, Japan) for 1 h prior to the experiment to eliminate potential microbial contamination.
Growth curves and cells viabilities
In order to obtain the cell densities of T. thermophila treated with different concentrations of gelsemine, growth curves were produced. After 24 h culture, the logarithmic period cells were inoculated into 10 mL SPP media in 50 mL centrifuge tube with 6,250 cells/mL seeding density, and the medium was mixed with different gelsemine contents, thereby obtaining final gelsemine concentrations with 0, 0.05, 0.1, 0.2, 0.4 and 0.8 mg/mL, respectively. Each concentration was conducted in triplicate. zero mg/mL concentration of gelsemine was set as a blank control, and 0.1% DMSO, the vehicle for gelsemine addition, served as a negative control (NC). T. thermophila cells were cultured for 72 h at 30 °C with shaking at 135 rpm. Cell densities were determined using Countstar Automated Cell Counter (Countstar, Shanghai, China) during the culture period. Cell viability was determined by counting the relative cell number in the presence of gelsemine for 24 h (Cell counting kit-8 used, Nanjing, Jiancheng, China) according to the manufacturer’s instructions. Briefly, the cell suspension (1 × 10⁴ cells/L) was added into the 96 hole plate, and add 10 μL Cell counting kit-8 (CCK-8) solution per hole, then the plates were incubated for 3 h in incubators, and the absorbance at 450 nm was measured by enzyme labelling apparatus. CCK-8 allows sensitive colorimetric assays for the determination of cell viability in cell proliferation and cytotoxicity assays. The highly water-soluble tetrazolium salt, WST-8, is reduced by dehydrogenase activities in cells to give a yellow-color formazan dye, which is soluble in the tissue culture media. The amount of the formazan dye, generated by the activities of dehydrogenases in cells, is directly proportional to the number of living cells. The half-maximal effective concentration (EC50) of gelsemine was calculated.
Cellular enzymic activity analysis
Tetrahymena thermophila culture was exposed to various levels of gelsemine, and cells were harvested by centrifugation of 3,500 rpm for 15 min and washed twice with cold phosphate buffer solution (PBS, pH 7.4) at room temperature, and then suspended in PBS. The supernatant was collected to assay the content of malondialdehyde (MDA). A malonaldehyde detection kit (Nanjing Jiancheng Bioengineering Institute, Nanjing, China) was used for MDA determination. Simply, thiobarbituric acid reacted with MDA to form red products, and the absorbance was measured at 532 nm. The MDA concentration was expressed as nanomoles of MDA per milligram of protein (Rongzhu et al., 2009). The activities of superoxide dismutase (SOD), catalase (CAT), peroxidase (POD) and glutathione peroxidase (GSH-PX) were measured using a commercial reagent kit (Nanjing Jiancheng Bioengineering Institute, Nanjing, China) spectrophotometrically. The activities of SOD, CAT and POD were expressed as units per milligram protein. The activity of SOD was assayed at 550 nm using the xanthine and xanthine oxidase system. One unit (U) of SOD activity was defined as the amount of enzyme causing 50% inhibition of xanthine and xanthine oxidase reaction system. The samples were treated with the excess of H2O2 at 37 °C, and the absorbance of remaining H2O2 was measured at 405 nm to determine the activity of CAT. The samples were treated with H2O2 at 37 °C for 30 min. POD activity was determined by detection of changes in the absorbance at 420 nm. The samples were treated with glutathione (GSH, 20 μmol/L) at 37 °C for 5 min, GSH-PX activity was determined by detection of changes in the absorbance at 412 nm. The content of total protein was measured by coomassie blue staining, using bovine serum albumin (Solarbio, China) as a standard (Ma et al., 2015). Among the 14 known caspases, Caspases 3, 8 and 9 are most closely related to apoptosis and play an important role in apoptosis. The Caspases 3, 8 and 9 were measured using the assay kits provided by Nanjing Jiancheng Biotechnique Institute (Nanjing, China) in line with the manufacturer’s protocol. Caspase sequence-specific polypeptides were coupled to chromophore groups. When the substrate was cleaved by a specific caspase, the chromophore groups were free, and the absorbance value could be determined by spectrophotometer (λ = 405 nm).
Apoptosis analysis using flow cytometric
The T. thermophila cells were separately exposed to various levels of gelsemine for 24 h at 30 °C with constant shaking (135 rpm) at 6,250 cells/mL inoculation concentration. Afterward, cells were collected by centrifugation at 3,500 rpm for 15 min and washed twice with cold PBS (pH 7.4) at room temperature. The fluorescein isothiocyanate-Annexin V was added to T. thermophila cells, mixed thoroughly and incubated for 10 min in an ice bath in the dark. The T. thermophila cells were then washed twice with PBS and analyzed on a flow cytometer. A total of 10,000 cells were obtained and examined per sample using a Beckman–Coulter EPICS XL flow cytometer (Brea, CA, USA). Data produced above was further analyzed using the Cell Quest software.
Comet assay
The comet assay was used to evaluate the DNA damage of cells in different concentrations of gelsemine exposure. T. thermophila cells were collected by centrifugation at 3,500 rpm for 15 min and washed twice in PBS. The assay was conducted using a commercial kit (Comet Assay Kit, Nanjing, Jiancheng, China). In brief, cell suspensions were mixed with low melting point agarose (0.8%) and poured on glass slides. The slides were then immersed in a cold lysis solution at 4 °C for 2 h followed by electrophoresis at 4 °C for 30 min. The slides were stained with EB (ethidium bromide) and photographed using a fluorescence microscope. The images were analyzed using Comet Assay Software (CASP 1.2.3 beta 1) (Konca et al., 2003). Olive tail moment (OTM) was used for assessing DNA damage. The experiments were performed in three biological repetitions for each.
Transmission electron microscopy imaging
Transmission electron microscopy (TEM) was performed by a commercial company (Wuhan Servicebio Technology, Guangzhou, China) using a previously described procedure (Li et al., 2015a). Briefly, T. thermophila cells were fixed in sodium cacodylate buffer containing 2.5% glutaraldehyde at room temperature for 1 h and then incubated in 2% aqueous osmium tetroxide for 45 min at 4 °C. Then the fixed cells were immersed in 1% uranyl acetate for 1 h, dehydrated in an acetone series and embedded in epoxy resins, thereby obtaining the stained ultrathin sections. Hitachi HT7700 TEM (Hitachi, Chiyoda, Tokyo, Japan) was used for imaging of T. thermophila ultrastructure.
Gene expression analysis
Total RNA was isolated from T. thermophila using an RNAiso Plus kit (Takara, Dalian, China) according to the manufacturer’s protocol. RNA integrity was evaluated by 2% agarose gel electrophoresis and then reverse transcribed (RT) using a commercial kit (Takara, Dalian, China) according to the manufacturer’s instructions. The cDNA was used for quantitative real-time PCR analysis (qRT-PCR). Gene sequences for MTT2/4 (metallothionein 2, NW_002476246), CYP1 (cytochrome P450, family 1, NW_002476416), HSP70 (heat shock protein 70, NW_002476481), MPK1 (mitogen-activated protein kinase 1, NW_002476155), MPK3 (mitogen-activated protein kinase 3, NW_002476348), ATG7 (autophagy 7, NW_002476353) genes and 18S rRNA (HE820726.1) were all retrieved from GenBank (https://www.ncbi.nlm.nih.gov/genbank/). Owing to the high homology of MTT2 and MTT4 nucleotides (De Francisco et al., 2017), we only can to analyze the expression of both genes as a set (MTT2/4) by RT-qPCR. PCR primers were designed using Primer Premier 5.0 software (Table S1). Relative gene expression was calculated and normalized with the quantity of 18S rRNA present in each sample. The qRT-PCR was performed using SYBR Premix Ex Taq II (Takara, Dalian, China) using a BioRad CFX96 Real-Time PCR Detection System (Bio-Rad, Hercules, CA, USA). The cycling conditions were 95 °C for 2 min, followed by 39 cycles of 95 °C for 15 s, 60 °C for 30 s, 72 °C for 30 s and a final step of 72 °C for 7 min. Real-time PCR data were analyzed using the 2–ΔΔCt method.
Statistical analysis
Data for cell viability assays, DNA damage and cellular enzymic activities were analyzed using the SPSS statistical package version 19.0 and analysis of variance (ANOVA). Real-time PCR data were analyzed using the 2–ΔΔCt method. Differences between groups were analyzed using the SPSS (ANOVA, least significant difference (LSD)), with p < 0.05 considered to be statistically significant. The residuals of the models were analyzed, and the residuals coincide with the normal distribution. The homogeneity of variances was analyzed using Bartlett test. All values were expressed as the mean ± standard deviation and all experiments were performed with three biological repetitions for each.
EC50 values were calculated with their 95% confidence interval from the data obtained using the software package GraphPad Prism 5.0. EC50 calculations were fitted to a sigmoidal four-parameter dose-response model using the equation: where y is the response, b is the response minimum, a is the response maximum, h is the shape parameter and x is the logarithm of the inhibitor concentration.
Results
Effect of growth inhibition in T. thermophila
We investigated potential growth effects of gelsemine on T. thermophila by measuring cell densities in the presence and absence of the gelsemine. Growth was inhibited by gelsemine in a dose-dependent manner, and its extent of inhibition increased with increasing gelsemine concentration (Fig. 1; Table S2). Moreover, all the treatment group reached the growth plateau stage after a 42-h culture, earlier than the controls (Fig. 1A). Cell viability was also adversely affected by gelsemine, and this was especially apparent in the concentrations of 0.2, 0.4 and 0.8 mg/mL treatment groups (p < 0.05), which were also dose-dependent. The EC50 at 24 h was calculated at 0.48 mg/mL using this data (Fig. 1B).
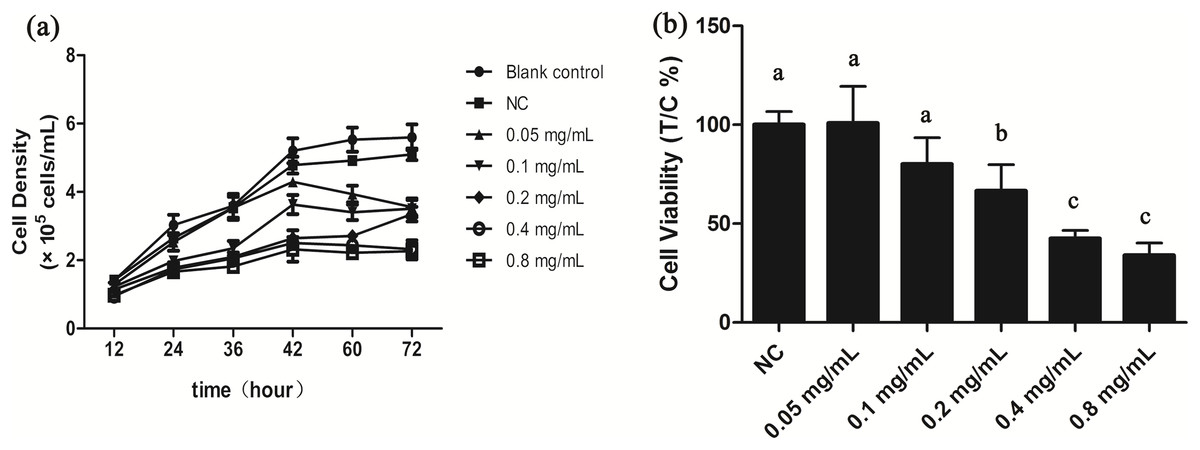
Figure 1: Gelsemine affects T. thermophila proliferation.
(A) Growth curves of T. thermophila based on numbers of cells exposed to various concentrations of gelsemine for 72 h. (B) Cell viabilities of T. thermophila exposed to gelsemine for 24 h. Data are expressed as mean ± SD for n = 3. Values with no common superscript differ significantly (p < 0.05) or are highly significant (p < 0.01). Blank control, no added drug; Negative control (NC), vehicle only (0.1% DMSO).
Effect of oxidative stress in T. thermophila
The oxidative stress effects of gelsemine were evaluated by measuring the levels of antioxidant enzymes and MDA content. SOD, CAT, POD and GSH-PX enzyme activities were all elevated significantly in cells with the administration of both 0.4 and 0.8 mg/mL gelsemine (p < 0.05). There were no significant changes in other treatment groups (Fig. 2). Additionally, MDA content was significantly decreased at 0.8 mg/mL gelsemine (p < 0.01) and significantly increased at 0.1, 02 and 0.4 mg/mL (p < 0.01) (Fig. 3C). This data indicates that gelsemine produces significant alterations in cellular redox status at high concentrations and that the compound causes oxidative stress in T. thermophila.
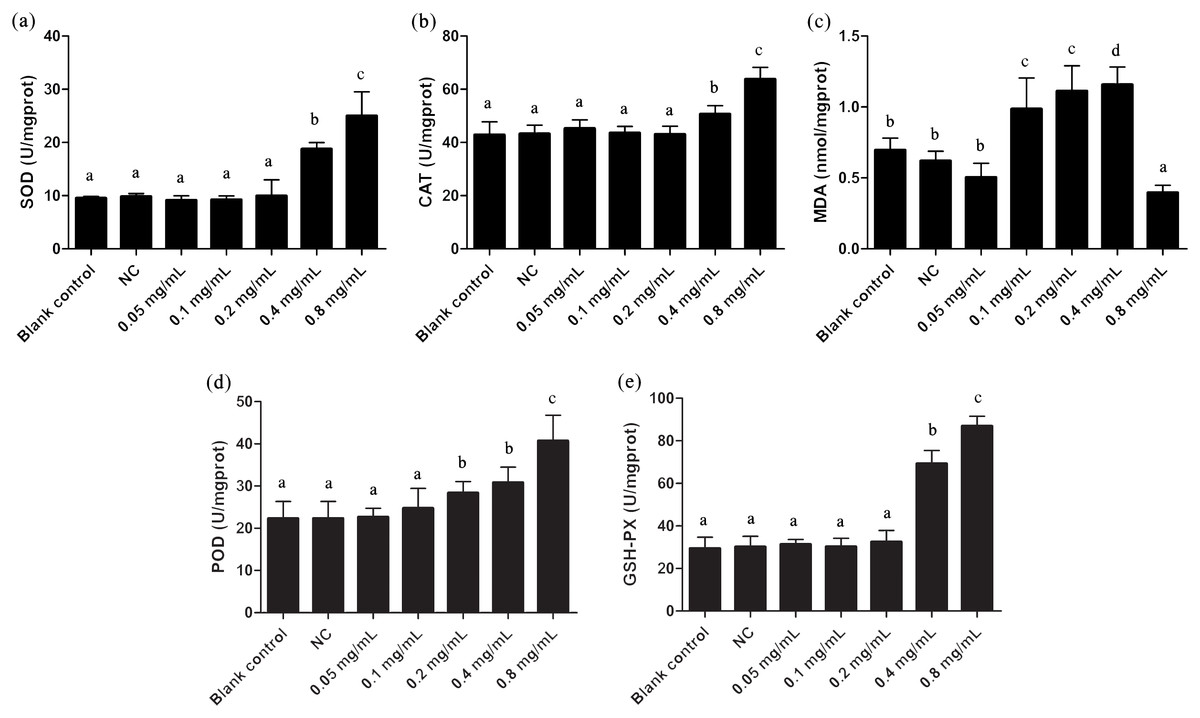
Figure 2: Antioxidant enzyme activities of T. thermophila after gelsemine exposure.
(A) SOD, (B) CAT, (C) MDA, (D) POD, (E) the sum of GSH-PX. Data are expressed as mean ± SD for n = 3. Values with no common superscript differ significantly (p < 0.05) or are highly significant (p < 0.01). Blank control, no added drug; Negative control (NC), vehicle only (0.1% DMSO).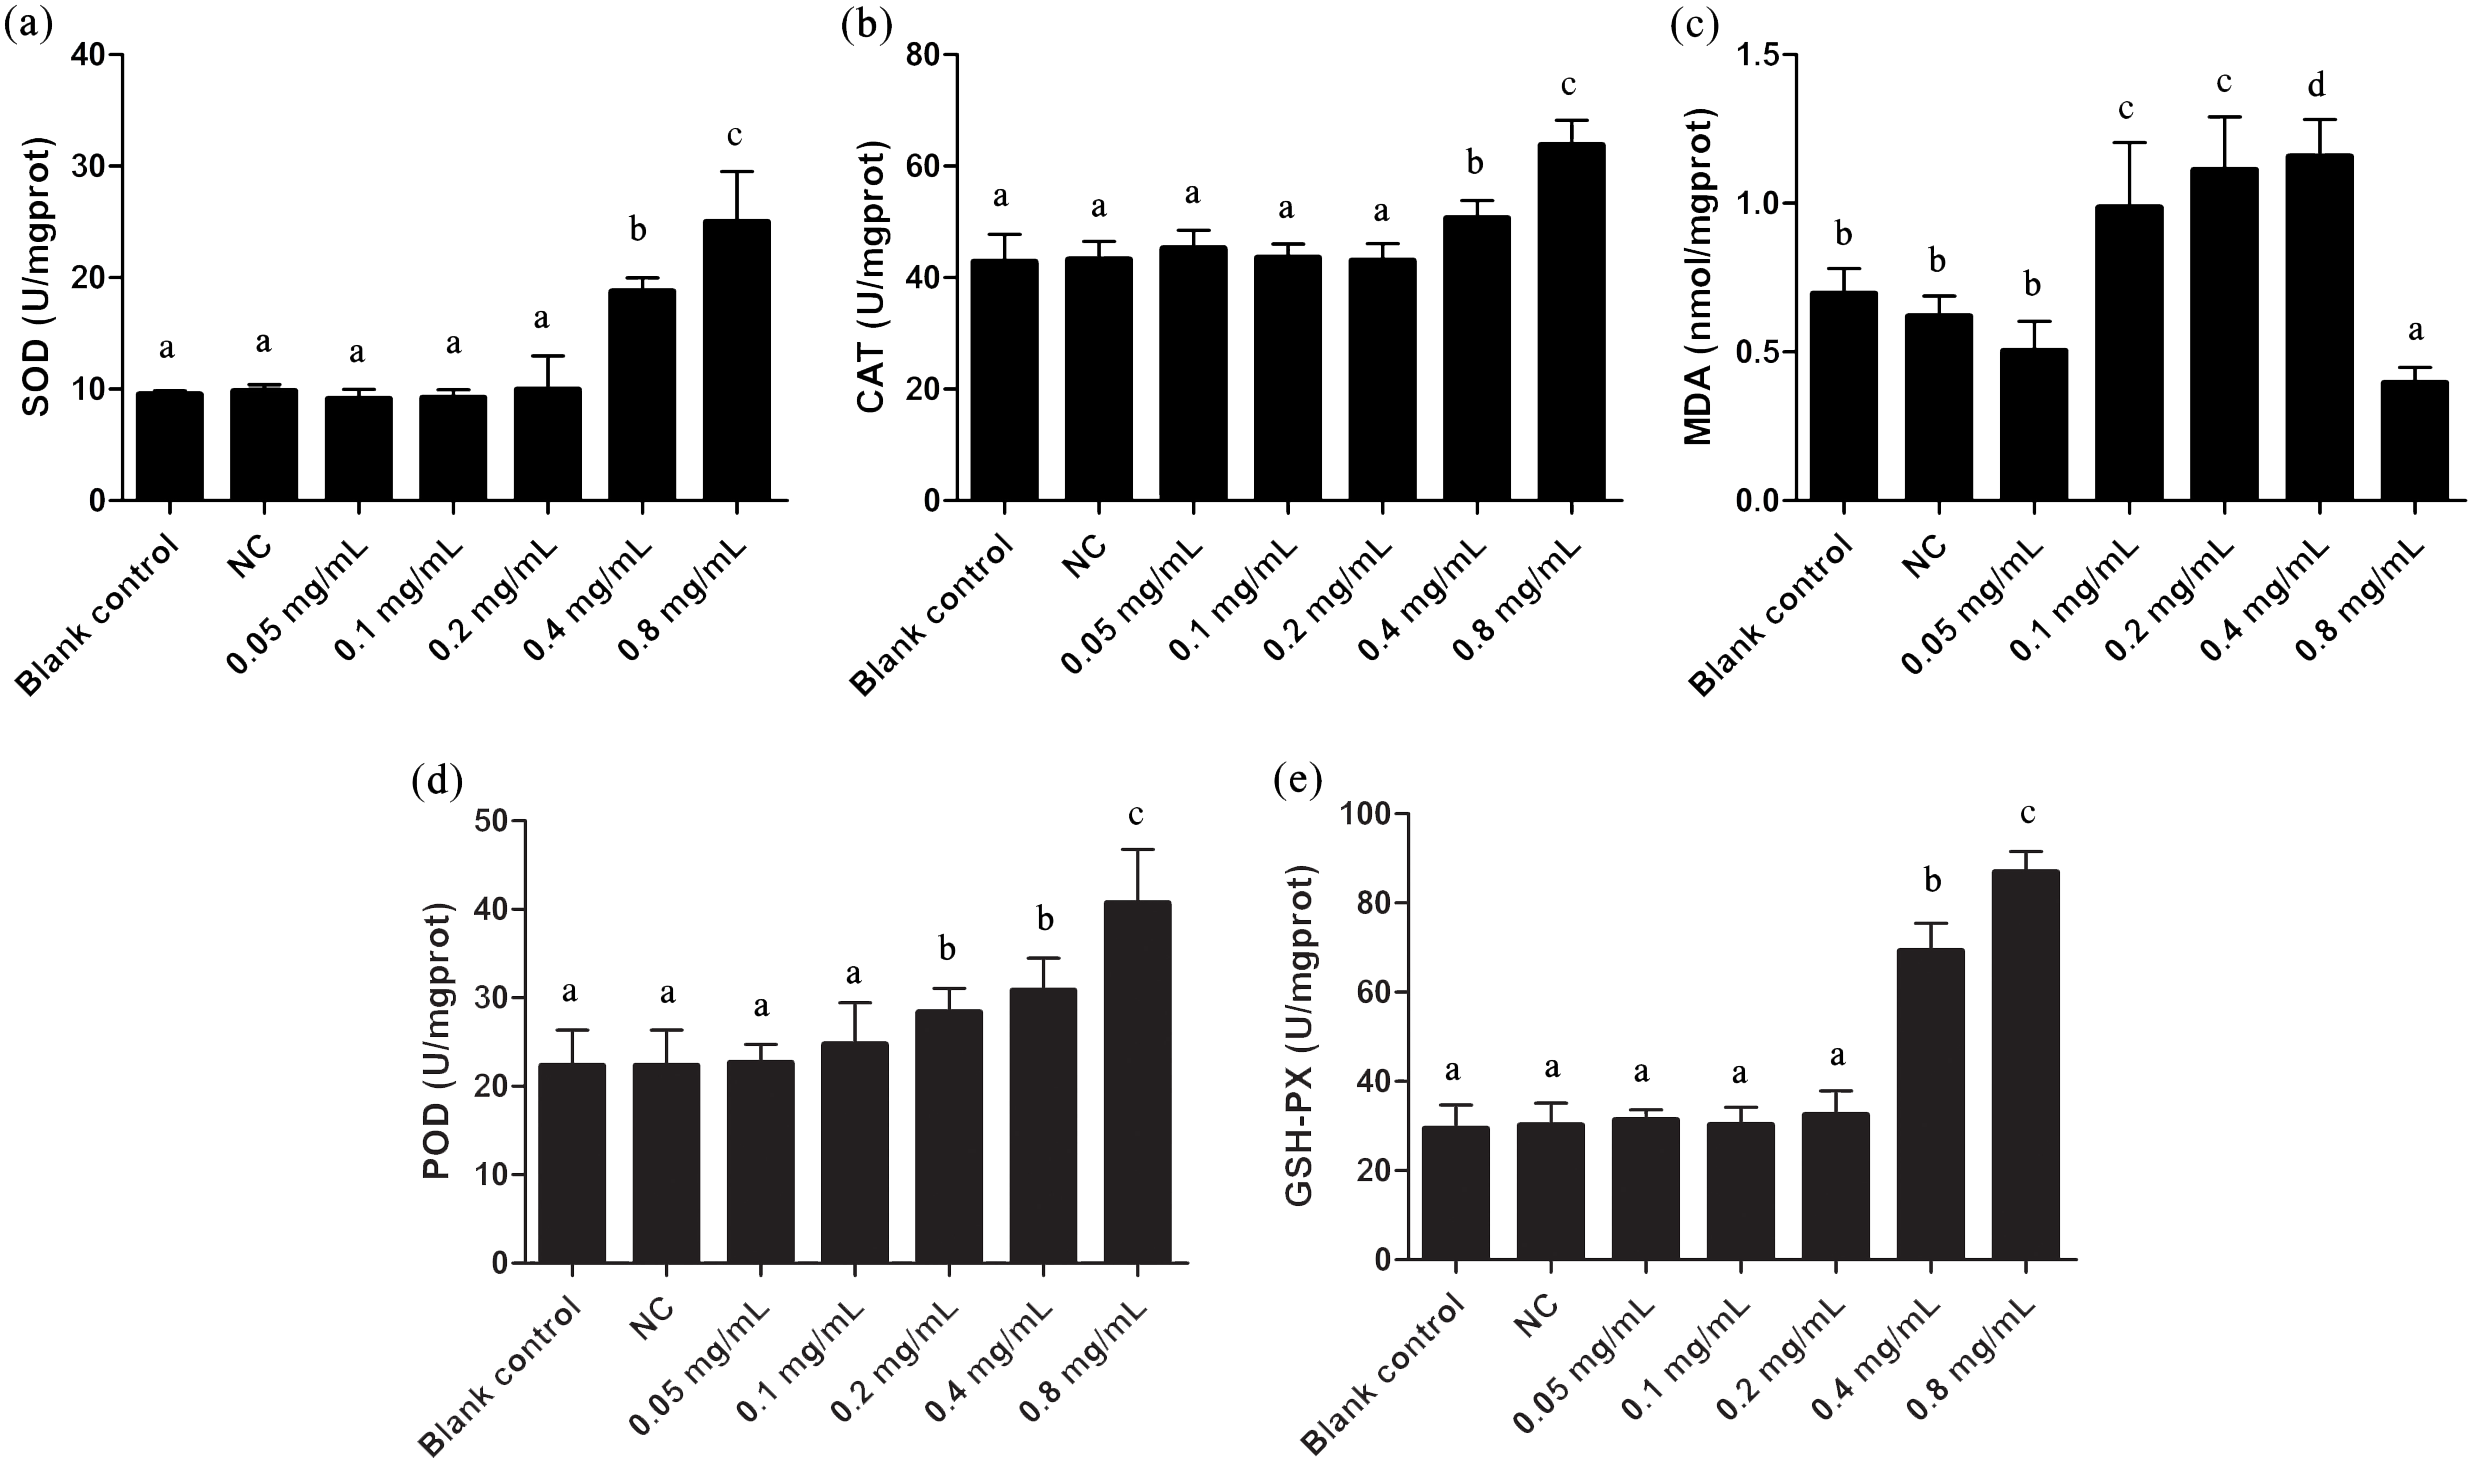
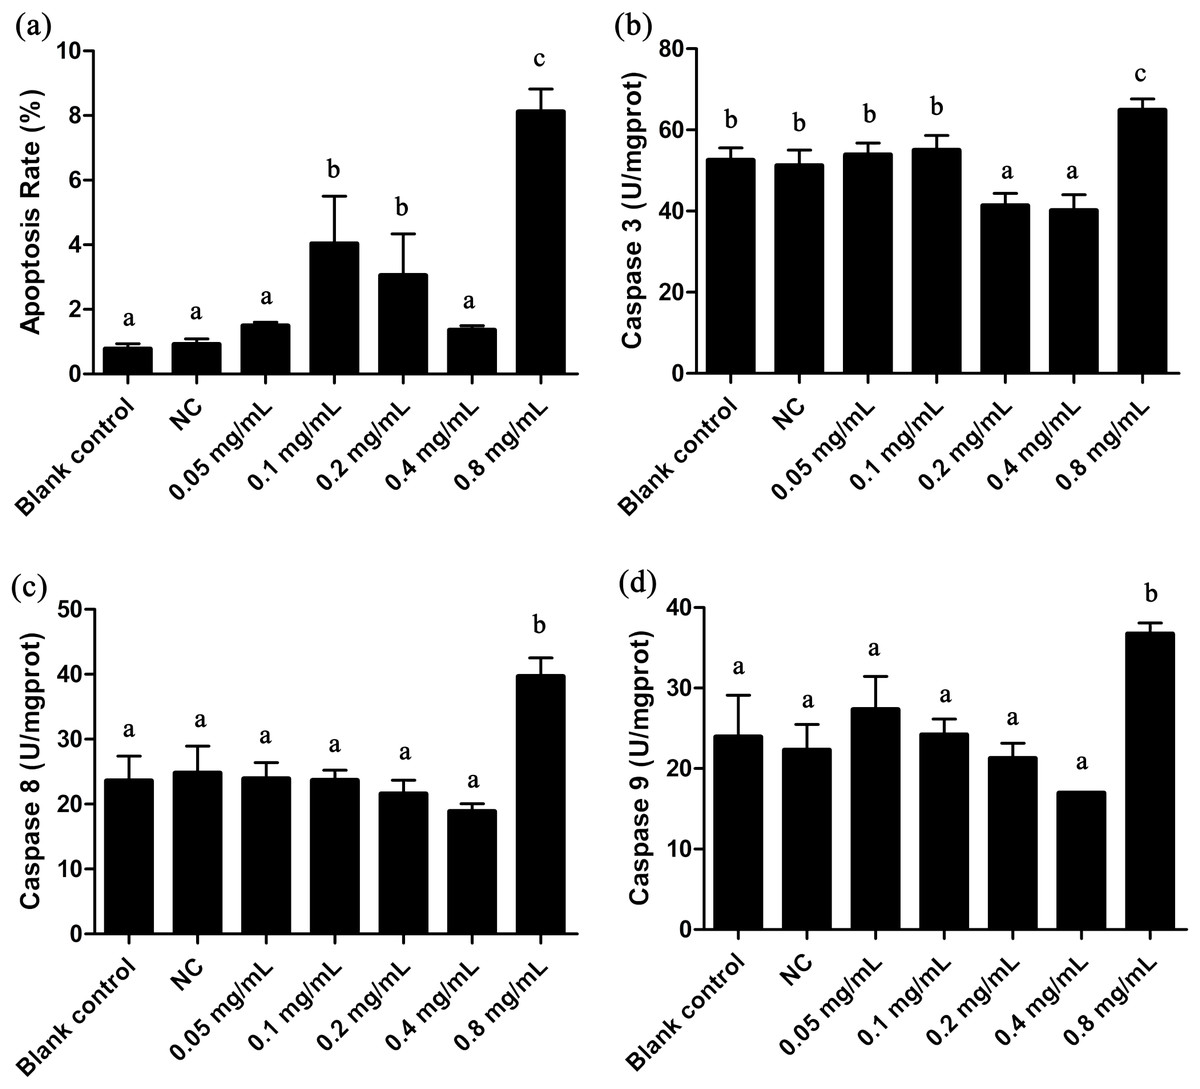
Figure 3: Apoptosis rate and Caspases 3, 8, 9 activities of T. thermophila after exposure to gelsemine at various concentrations.
(A) Apoptosis rate, (B) Caspase 3 activity, (C) Caspase 8 activity, (D) Caspase 9 activity. Data are expressed as mean ± SD for n = 3. Values with no common superscript differ significantly (p < 0.05) or are highly significant (p < 0.01). Blank control, no added drug; Negative control (NC), vehicle only (0.1% DMSO).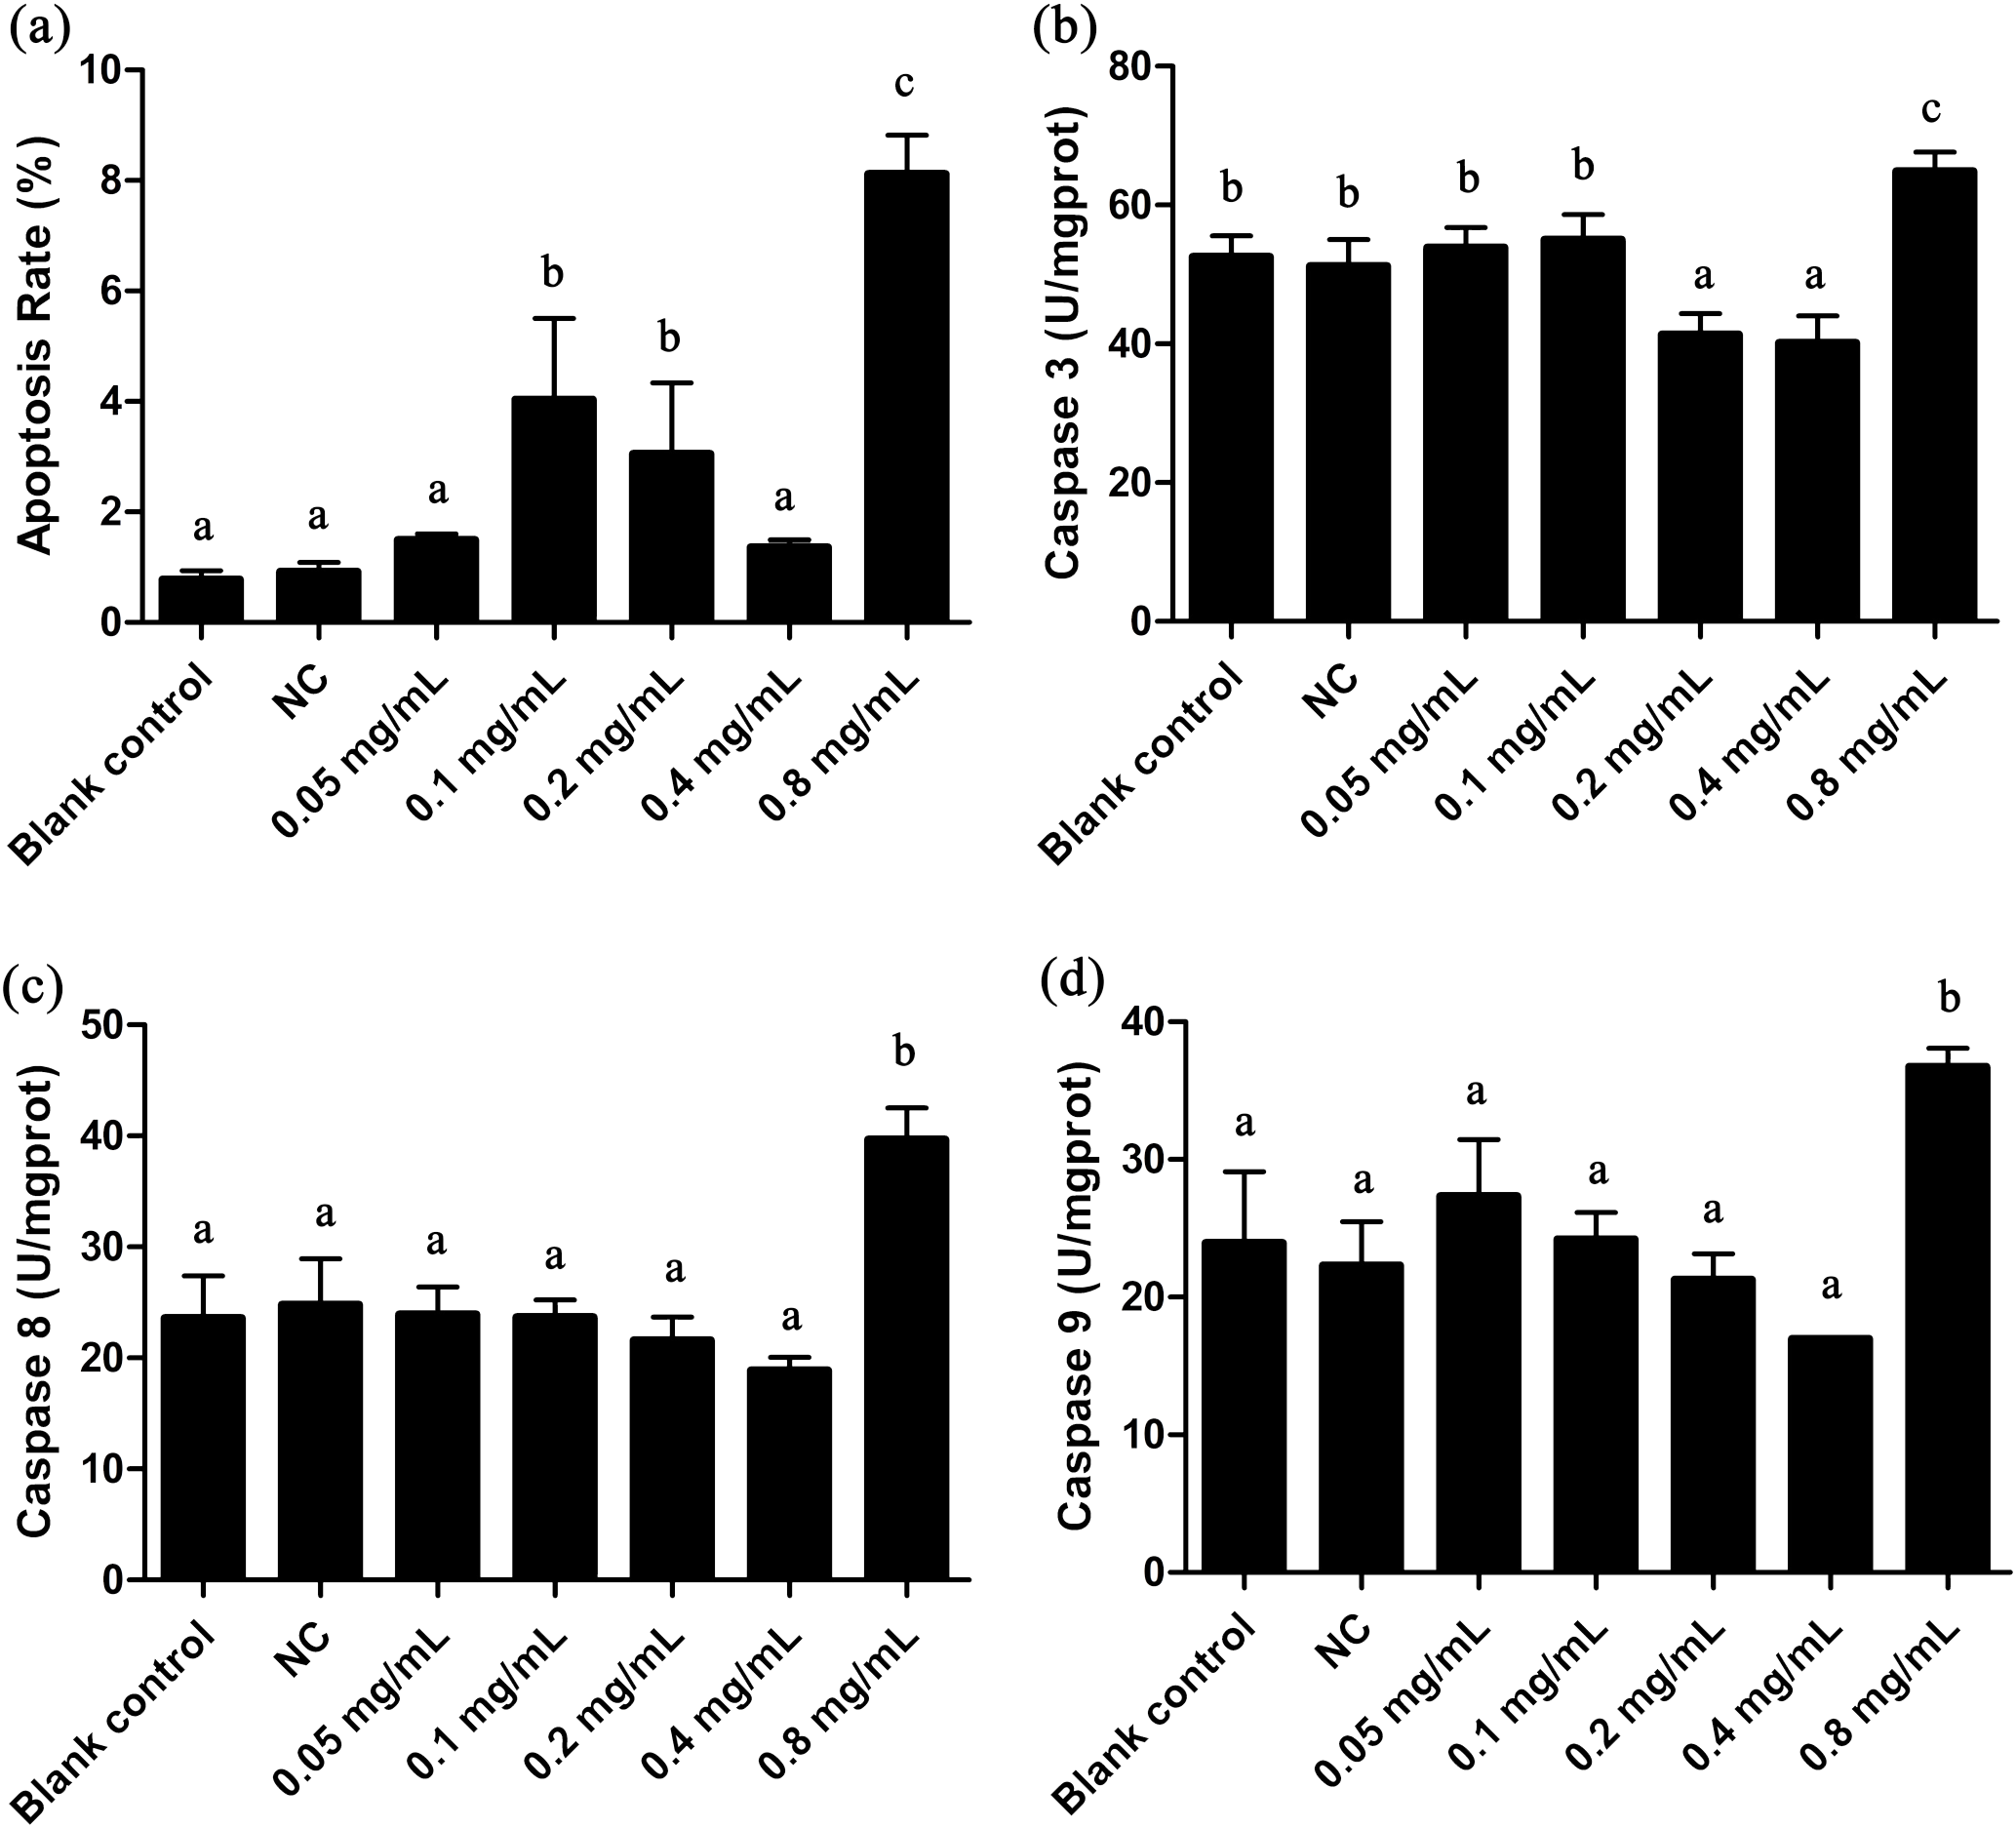
Effect of apoptosis in T. thermophila
The apoptotic state is an important indicator to evaluate the cell states, and it can be well identified by flow cytometric. As shown in Fig. 3A and Fig. S1G, the apoptosis rate in 0.8 mg/mL treatment group was under approximately 8.8%, indicating a certain extent of apoptosis. Caspases 3, 8 and 9 are three important enzymes closely correlative with apoptosis. In T. thermophila, we here observed that the activities of Caspases 3, 8 and 9 exposed to 0.8 mg/mL of gelsemine were all significantly increased (p < 0.01) compared to that in the NC group (Fig. 3). The above results collectively indicate that a relatively high concentration of gelsemine may induce the apoptosis in T. thermophila.
Effects of DNA damage in T. thermophila
We here employed comet assay to reveal the effects of DNA damage in T. thermophila. We found that all the concentrations of gelsemine caused DNA damage in a dose-dependent manner (Fig. 4). The OTM values were significantly increased at all gelsemine treatment groups compared to the NC control group (p < 0.05). Even at low concentrations (0.05 or 0.1 mg/mL), we could find evidence of DNA damage (Fig. 4H). In addition, the extent of damage was greater (40–60%) at 0.4 and 0.8 mg/mL levels (Table S3). The results presented above clearly indicate that gelsemine can cause DNA damage in T. thermophila.
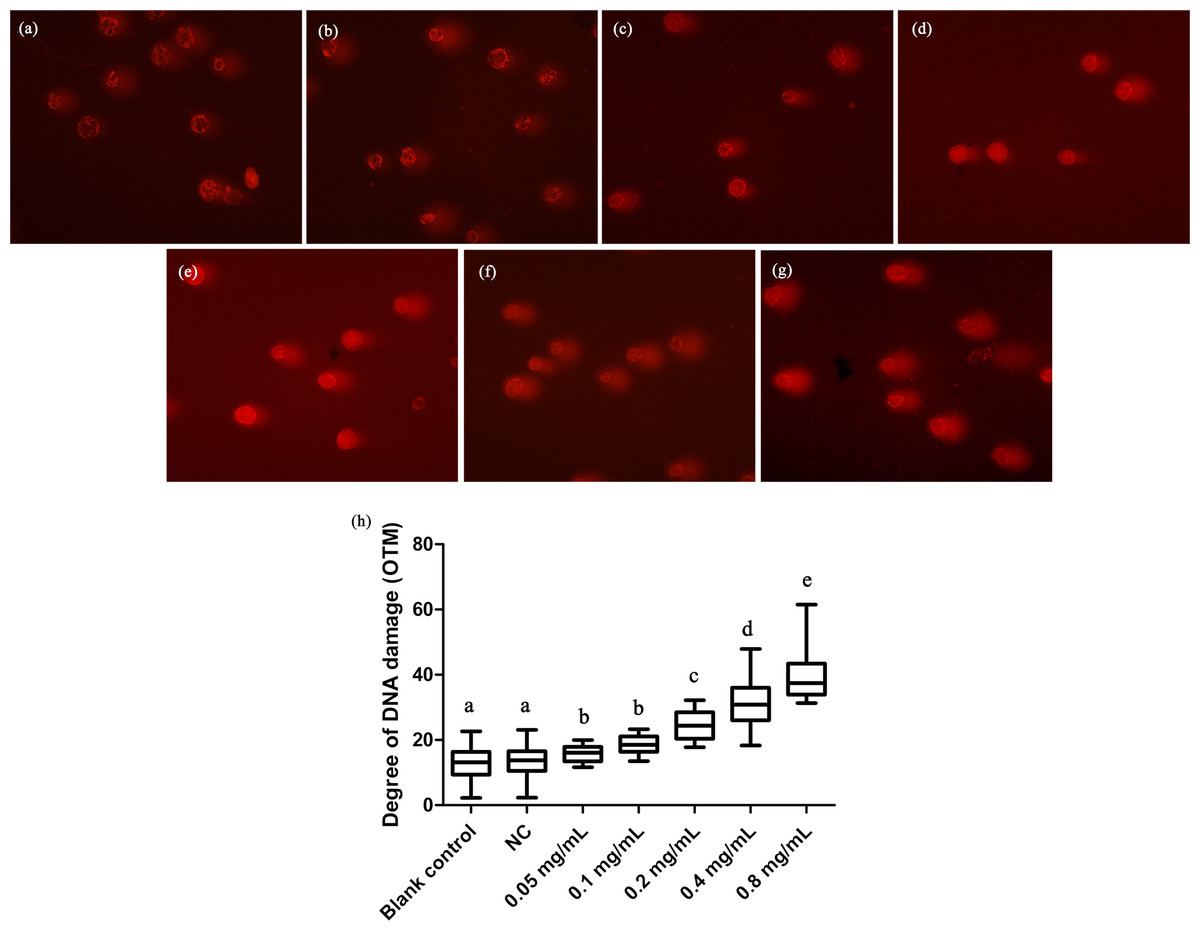
Figure 4: Comet assay to detect DNA damage in T. thermophila cells exposed to gelsemine.
(A) Blank control, (B) Negative control (NC), vehicle only (0.1% DMSO) (C) 0.05 mg/mL, (D) 0.1 mg/mL, (E) 0.2 mg/mL, (F) 0.4 mg/mL, (G) 0.8 mg/mL, (H) DNA damage in T. thermophila exposed to increasing concentrations of gelsemine for 24 h. Data are expressed as mean ± SD for n = 3. Values with no common superscript differ significantly (p < 0.05) or are highly significant (p < 0.01). Blank control, no added drug; Negative control (NC), vehicle only (0.1% DMSO).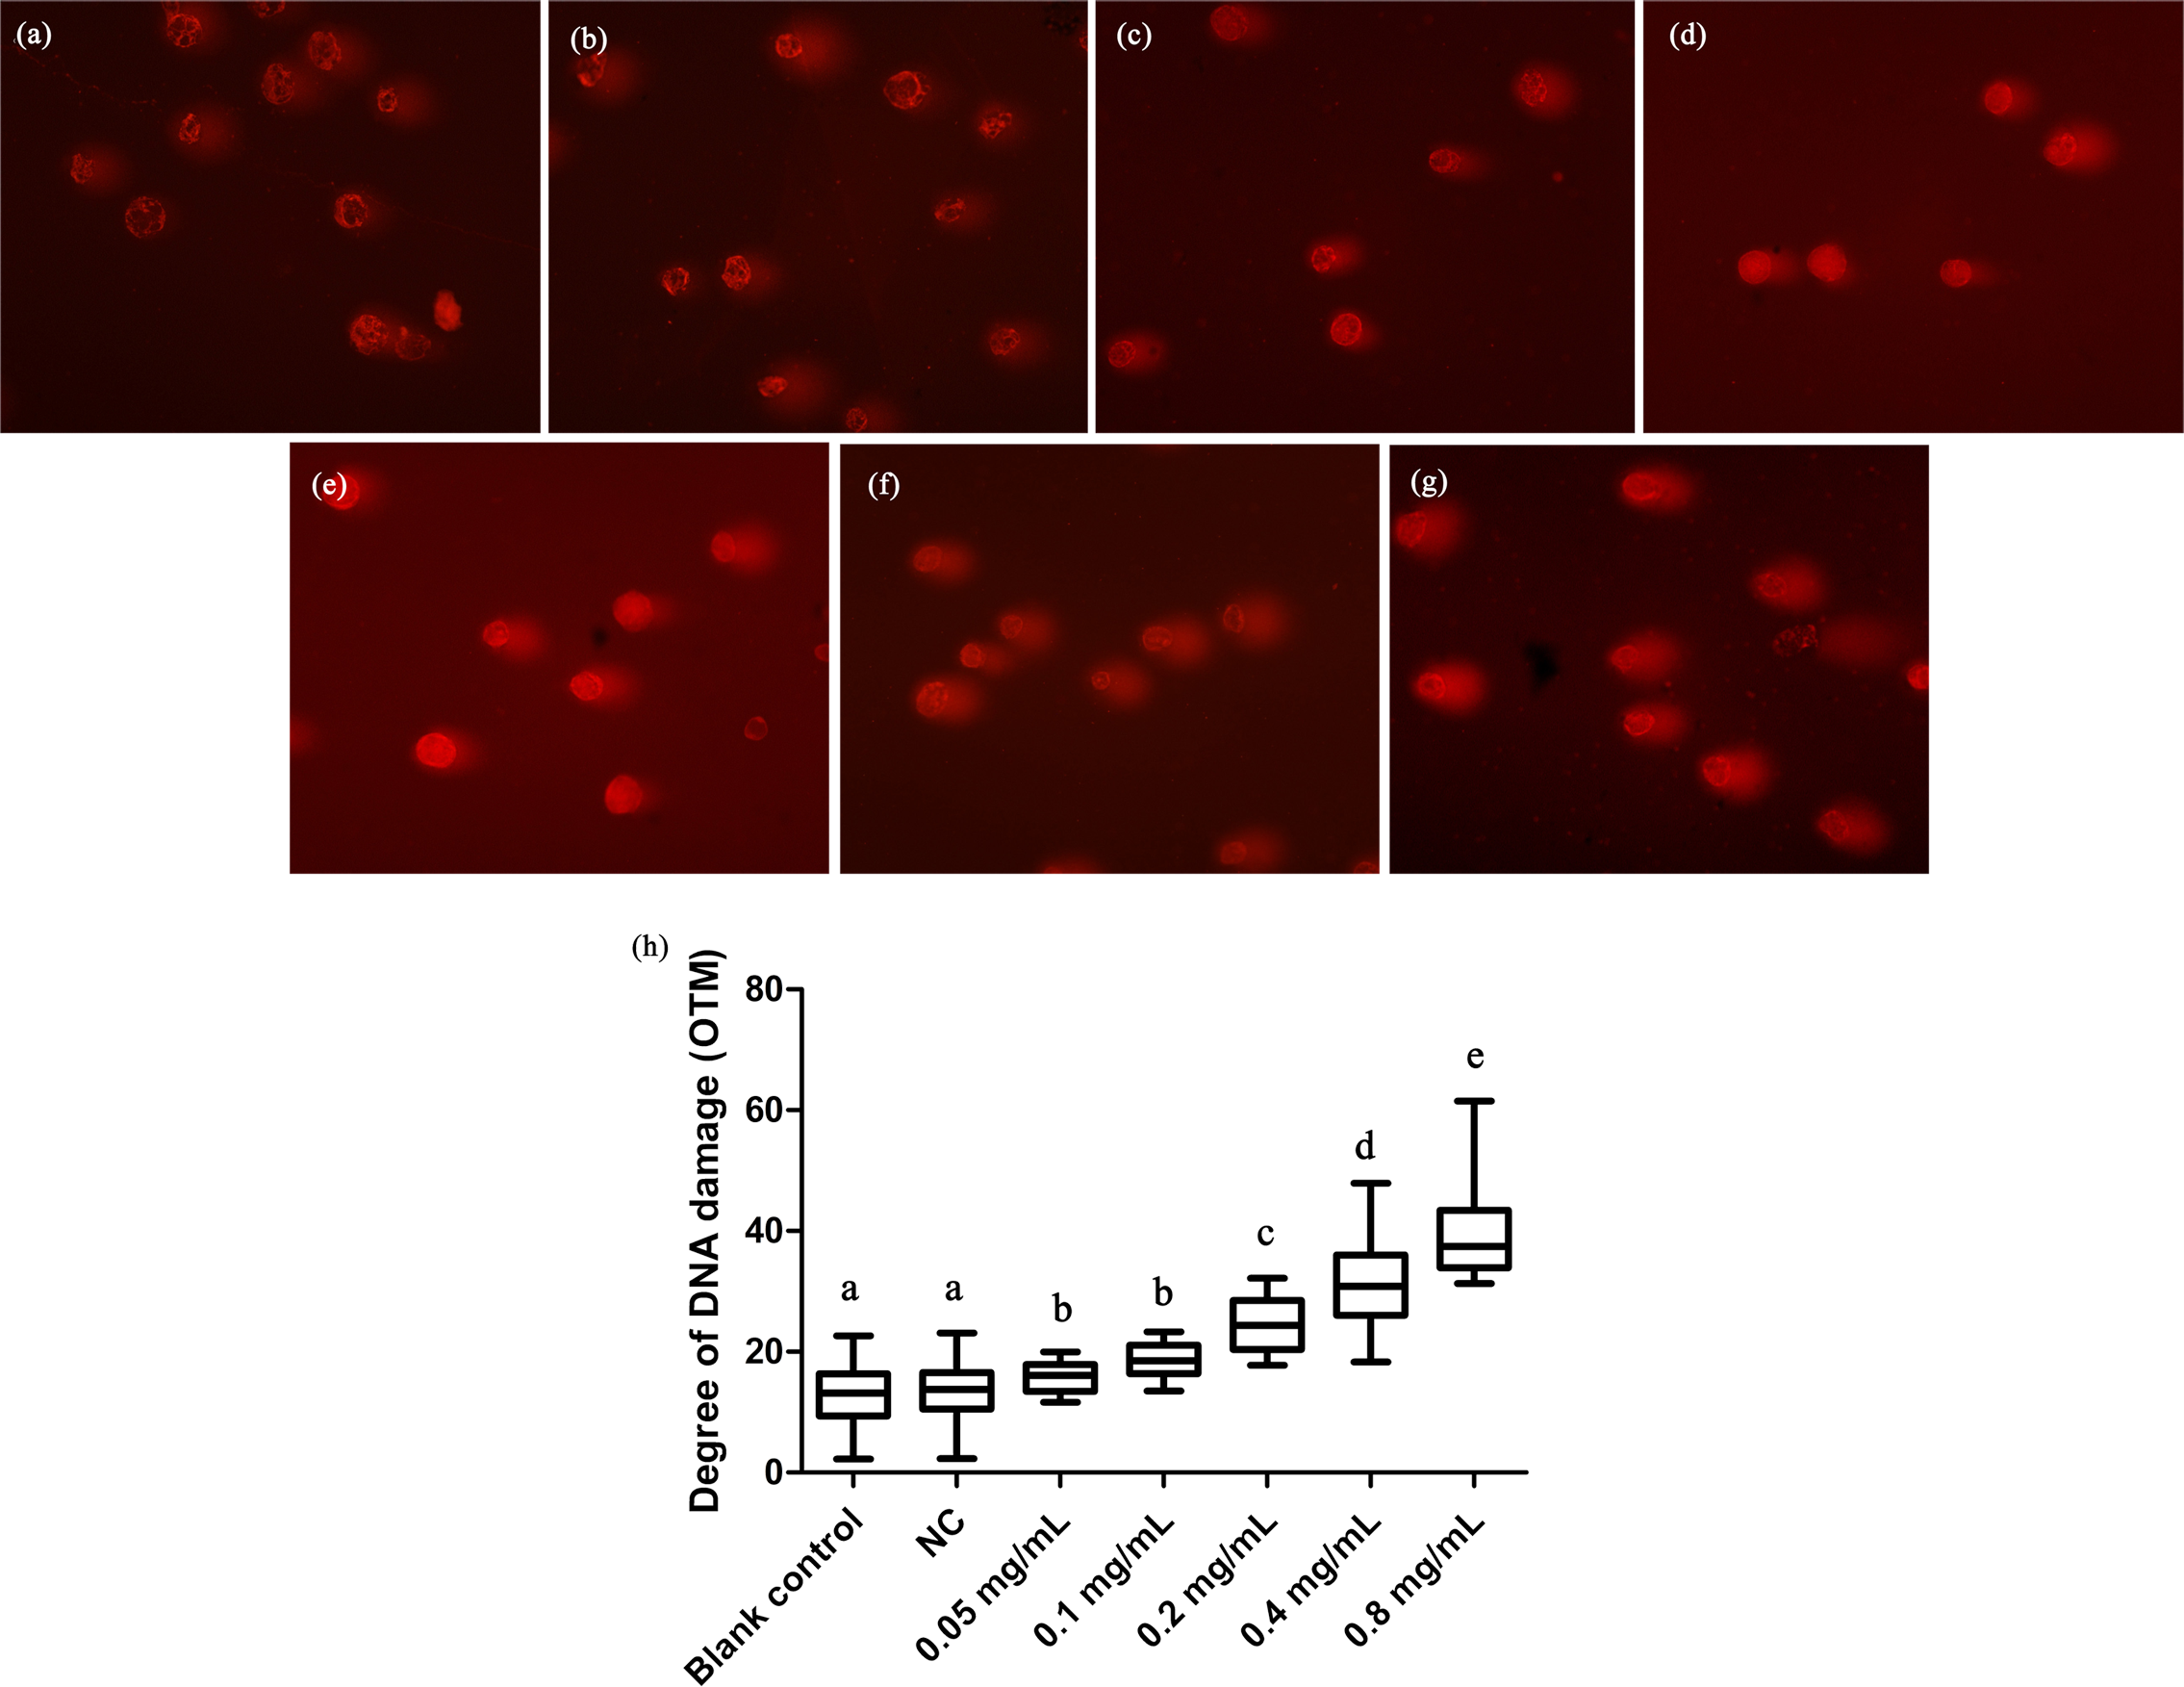
Ultrastructural analysis
Transmission electron microscopy is an effective way to observe ultrastructural changes in the cells. We here carried out the TEM experiments to investigate the potential ultrastructural changes of cells brought by the gelsemine treatment. Consequently, a series of obvious changes in the cellular ultrastructure of T. thermophila exposed to various concentration of gelsemine could be observed, along with signs of mitophagic vacuoles at the higher treatment levels (0.4 and 0.8 mg/mL) identified (Figs. 5B and 5C, white arrows). These results indicate that the mitophagic vacuoles presented here much more likely correlates with the cell death induced by gelsemine treatment.
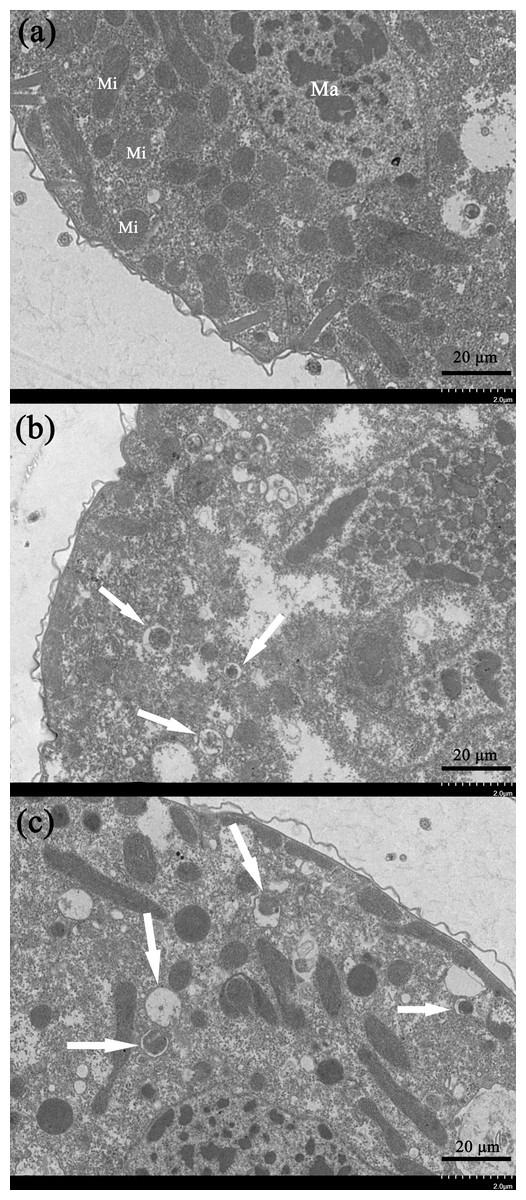
Figure 5: Ultrastructural analysis by TEM of T. thermophila cells exposed to increasing concentrations of gelsemine for 24 h.
(A) NC control group showing a normal mitochondrion. Macronucleus (Ma), Mitochondrion (Mi). (B) A total of 0.4 mg/mL treatment group showing preliminary evidence of mitophagic vacuoles (arrows). (C) A total of 0.8 mg/mL treatment group showing overt mitophagic vacuoles (arrows).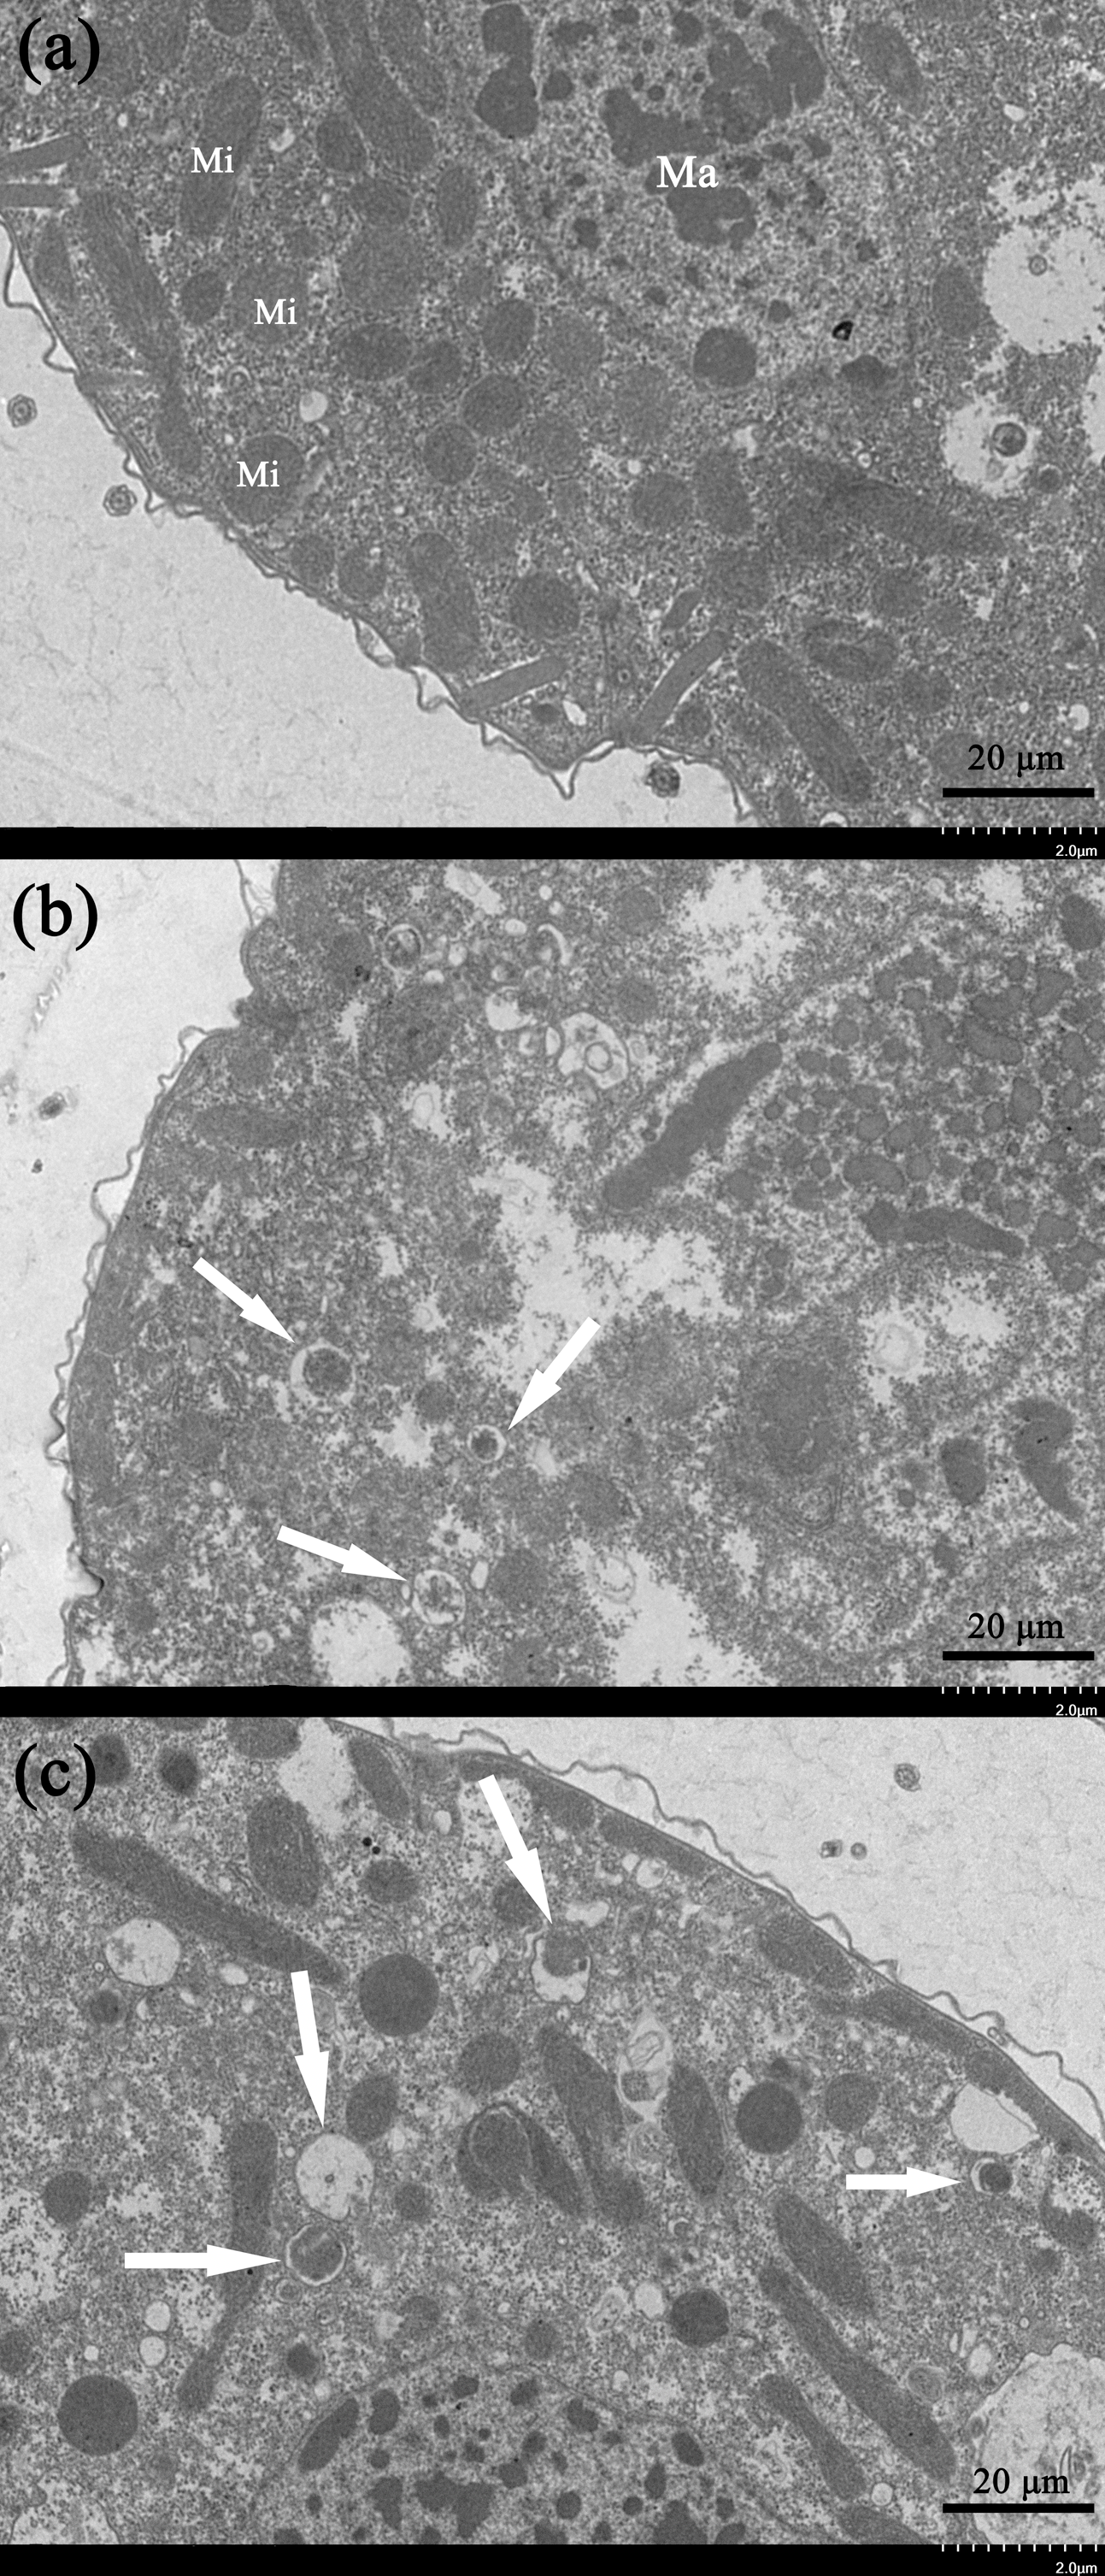
Expression of stress-related genes in T. thermophila
Since gelsemine could cause cellular stress on T. thermophila cells, we then measured the expression patterns of several stress-related genes to draw a more complete picture of the biological actions of this chemical. Results showed that the expression of MTT2/4, CYP1 and HSP70 were all significantly reduced at low gelsemine levels and significantly increased (p < 0.01) at 0.8 mg/mL (Figs. 6A–6C). These results were consistent with our antioxidant enzymes results since these three genes are induced during the process of oxidative stress. In addition, the expression levels of MPK1 and MPK3 were both significantly increased at 0.4 and 0.8 mg/mL gelsemine (p < 0.05) (Figs. 6D and 6E), indicated a potential activation of MAP kinase pathway triggered by gelsemine treatment in T. thermophila. We also found a significant increase in ATG7 expression at 0.8 mg/mL, which correlated with autophagy-related processes (Fig. 6F).
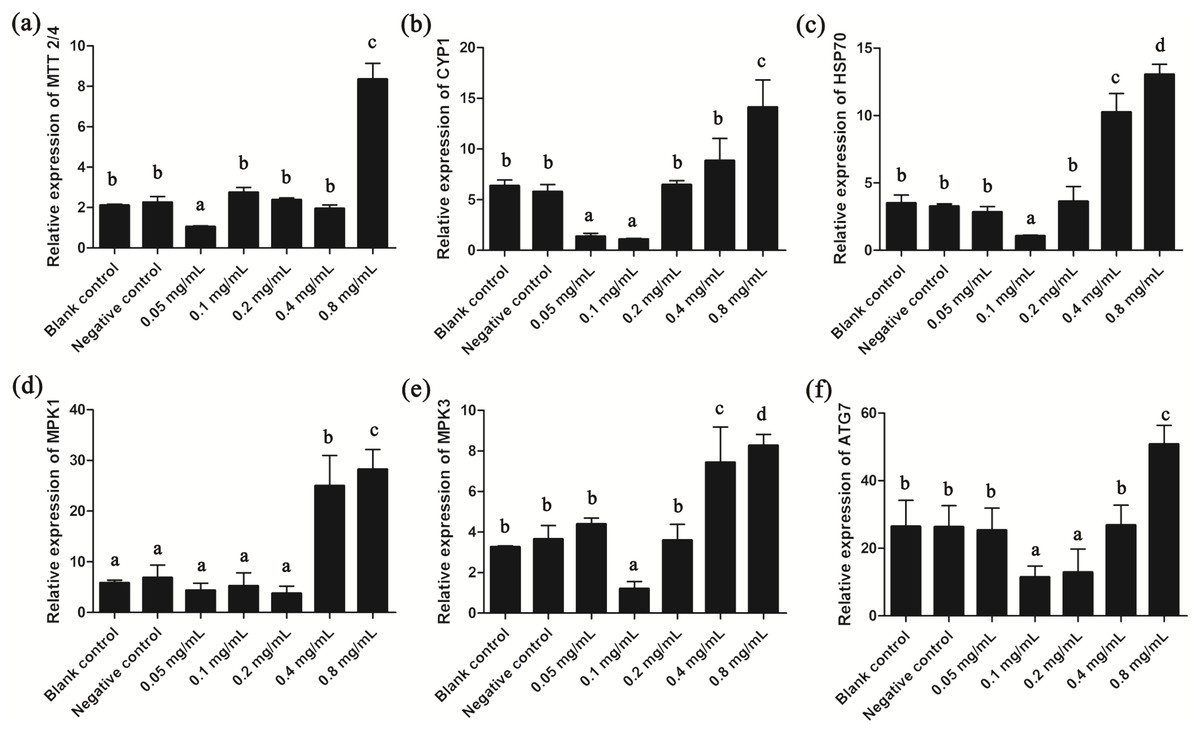
Figure 6: Relative expression levels of T. thermophila stress-related genes after gelsemine treatment for 24 h.
Expression levels were measured using qRT-PCR and normalized against 18S rRNA. (A) MTT2/4, (B) CYP1, (C) HSP70, (D) MPK1, (E) MPK3, (F) ATG7. Data are expressed as mean ± SD for n = 3. Values with no common superscript differ significantly (p < 0.05) or are highly significant (p < 0.01). Blank control, no added drug; Negative control (NC), vehicle only (0.1% DMSO).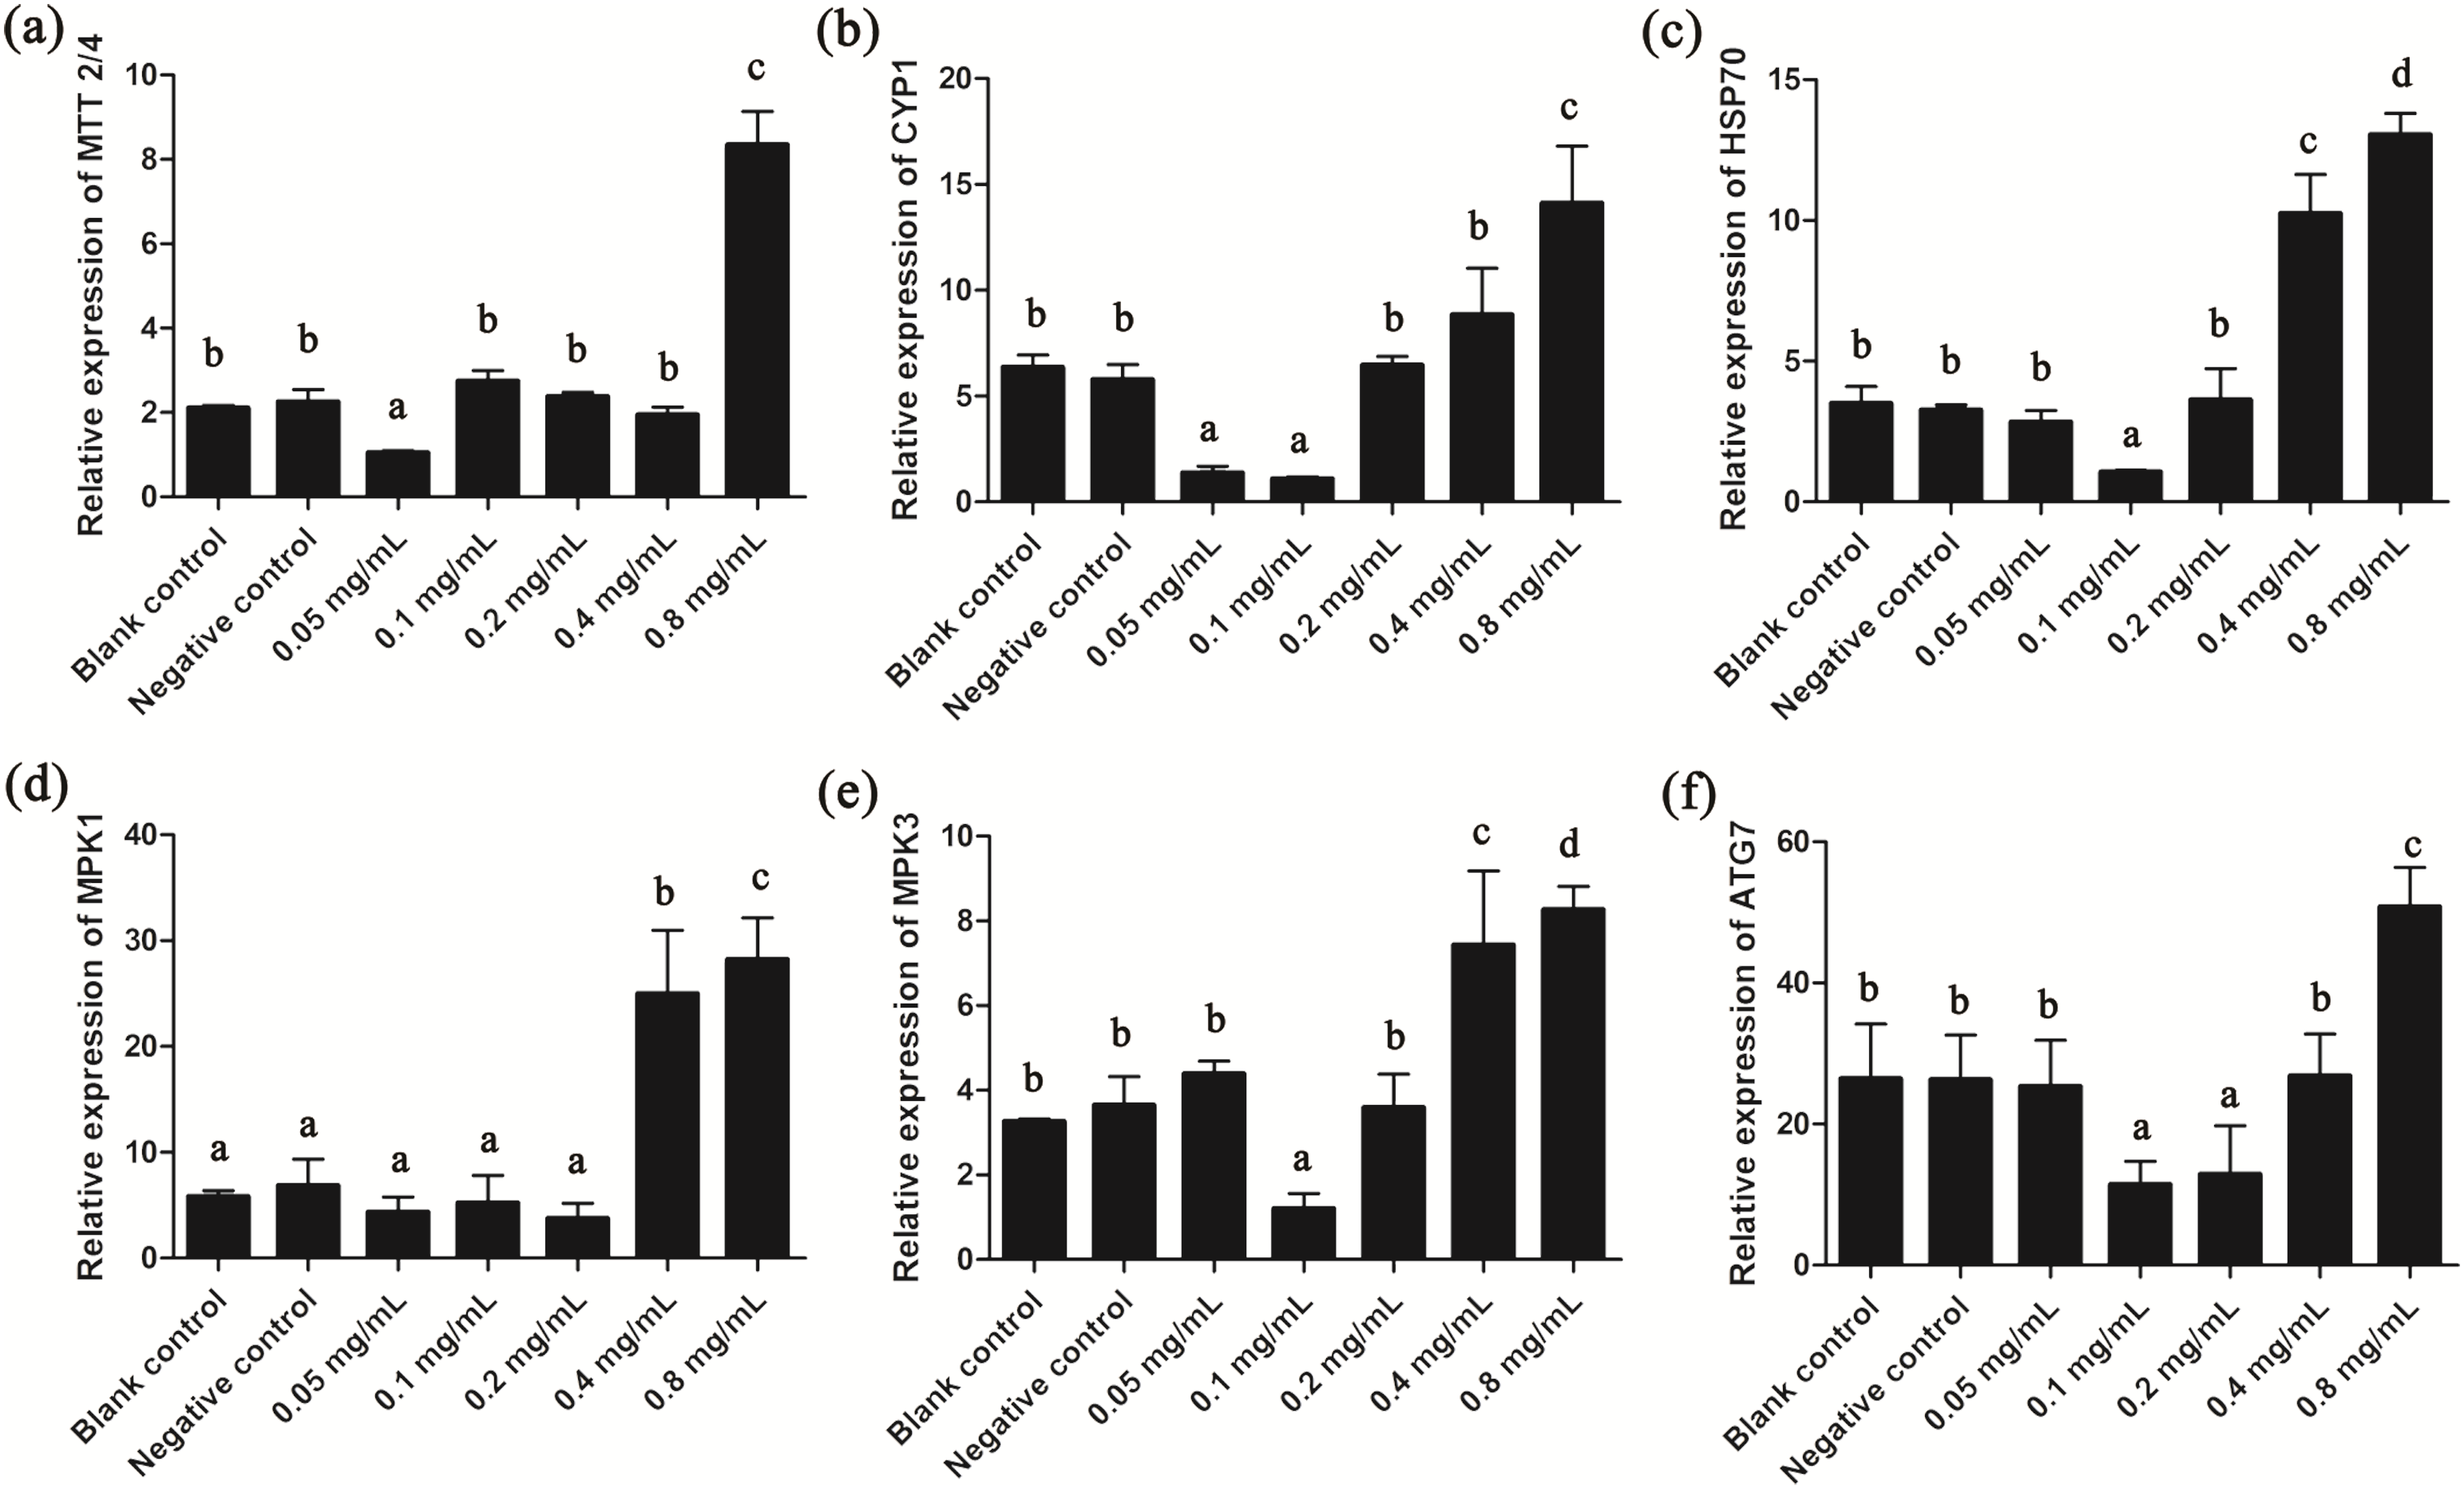
Discussion
Some pathogenetic eukaryotic microorganism, such as E. multilocularis, I. multifiliis and Vorticella caused potential aquatic ecological and human health risks (De Padua et al., 2013; Moyses et al., 2015; Bansal et al., 2018). T. thermophila is an excellent research model of these pathogenic eukaryotic microorganisms. Therefore, evaluation of the toxicity of gelsemine in T. thermophila has an important reference value for its further potential utilization in the disease control for livestock in general and humans. Toxicity and molecular mechanisms of biological responses to gelsemine have been previously examined in vertebrates. To the best of our knowledge, the current study is the first to examine the effects of gelsemine on a microorganism. Toxicities of hazardous substances are routinely determined by analysis of dynamic growth curves of T. thermophila. In our study, T. thermophila cell densities were inversely proportional to the gelsemine concentration in the culture medium. Cell viability also decreased in a dose-dependent manner as the gelsemine levels were increased. In general, the results of cell viability assays were consistent with that of the growth inhibition tests. The results described above showed that gelsemine can inhibit the growth of T. thermophila.
Beyond normal physiological roles, excessive reactive oxygen species (ROS) production can occur in response to toxin exposure, resulting in local oxidative stress (Deavall et al., 2012). Cells usually prevent or limit intracellular damage and ameliorate the harmful effects of ROS using antioxidant enzymes such as SOD, POD, CAT and GSH-PX (Deavall et al., 2012). The MDA produced by lipid peroxidation is a biomarker that reflects overall levels of oxidative stress (Liu et al., 2011b). Some chemicals, such as myclobutanil and cyproconazole caused notable changes in enzyme activities lead to oxidative stress in T. thermophila (Huang et al., 2016). In the present study, SOD, POD, GSH-PX and CAT in T. thermophila were significantly increased (p < 0.05) in the 0.4 and 0.8 mg/mL treatment groups. This indicates that gelsemine stimulates the production of ROS, thereby leading to oxidative stress. However, MDA content was significantly decreased at 0.8 mg/mL, and MDA was a common index used for membrane lipid peroxidation (Li et al., 2018). It means the gelsemine may first affect the oxidation of lipid in the cell membrane. Overall, activities of antioxidant enzymes were highly elevated indicating that gelsemine induces oxidative stress via ROS production.
Oxidative stress can also stimulate apoptosis (Wu et al., 2013; Yu et al., 2015). High melamine concentrations damaged the T. thermophila genome to a certain extent and induced apoptosis in the organism (Li et al., 2015b). We here found an obvious gelsemine-induced apoptosis in T. thermophila. The cellular apoptosis rates were elevated in the 0.8 mg/mL treatment group. In addition, Caspases 3, 8 and 9 were all significantly increased in different concentrations of gelsemine compared with that in controls. It has been shown that ROS can induce DNA damage. Under severe oxidative stress, high levels of DNA damage cause apoptosis in the damaged cells (Deavall et al., 2012; Belfield et al., 2014). The triclosan and triclocarban compound can lead to statistically significant DNA damage in T. thermophila (Gao et al., 2015). Thus, we wanted to determine whether gelsemine would produce the DNA damage effects in T. thermophila. Our results indicated that gelsemine induced DNA damage in a dose-dependent manner. High gelsemine level (0.8 mg/mL) induced serious DNA damage while antioxidant enzymes were also significantly changed. Therefore, DNA damage may be associated with oxidative stress in T. thermophila. Oxidative stress has been implicated in various cells disorders and may be a major cause of cell death. For example, oxidative stress induced mitophagic vacuoles resulting in mitochondria-dependent autophagy (Eid et al., 2016). We found that mitophagic vacuoles occurred with gelsemine exposure at 0.4 and 0.8 mg/mL. This correlated with that of the significant changes in all the antioxidant enzymes we measured. This also agrees with mitochondria damage, and we found that was the result of gelsemine-induced oxidative stress, indicating mitochondria as targets of gelsemine toxicity.
The MTT2/4 expression is induced by oxidative stress and toxins (Diaz et al., 2007; Figueira et al., 2012). CYP1 gene participates both in toxin metabolism and oxidative stress (Rao et al., 2016). For instance, CYP1 is induced by oxidative stress in the lungs and livers of rats exposed to incense smoke (Hussain et al., 2014). HSP70 has antioxidant functions and can protect cells from stress. For example, HSP70 is over-expressed in the preeclamptic placenta and HSP70 protects human neuroblastoma cells from apoptosis and oxidative stress (Padmini, Uthra & Lavanya, 2011; Yurinskaya et al., 2015). In our study, we found that MTT2/4, CYP1 and HSP70 were all increased significantly at 0.8 mg/mL gelsemine and this correlated with increased levels of oxidative stress. Taken together, these findings indicate that MTT2/4, CYP1 and HSP70 are also closely associated with the oxidative stress response to gelsemine in T. thermophila.
Protein kinases regulate cellular signals controlling growth, proliferation and survival in response to stress. Multiple kinase signaling pathways are affected by oxidative stress and kinase activation is critical in detecting oxidative stress (Ryter et al., 2007; Zhong et al., 2014). MPK1 and MPK3 genes are two important genes in MAP kinase signaling and can be activated by oxidative stress (Patel et al., 2011; Perez-Salamo et al., 2014). In our study, the expression levels of MPK1 and MPK3 increased significantly at the 0.4 and 0.8 mg/mL gelsemine implicating that gelsemine may affect the T. thermophila through the MAPK pathway. In addition, ATG7 as an important regulator of autophagy signal transduction and oxidative stress (Zhuo et al., 2013; Desai et al., 2013; Gonzalez et al., 2014), was also found to be significantly increased in the 0.8 mg/mL treatment group, which was consistent with our oxidative stress and electron microscopy experiments.
Conclusion
In summary, we here conducted a comprehensive investigation of potential gelsemine toxicity to T. thermophila. We found that gelsemine could exert oxidative stress, apoptosis, DNA damage and mitophagic vacuoles on T. thermophila, possibly via activating the MAPK pathway. In conclusion, our study clearly indicates that gelsemine has an antagonistic effect on eukaryotic single cell microorganisms. We believe the present study will aid in understanding the toxicity mechanisms of gelsemine on T. thermophila, as well as provide a theoretical basis for its possible practical utilization in pathogenetic eukaryotic microorganism control.